

The nuclear proliferation regime has design features that are interesting to the institutionalist research agenda.Footnote 1 A key feature is the complementarity of a multilateral instrument—the Nuclear Proliferation Treaty (NPT)—with superpower bilateral diplomacy. The United States and the Soviet Union did more than negotiate a text that was agreeable to other countries; they also bribed and threatened some of their respective clients into signing the NPT. This study suggests that the NPT regime, along with several other important regimes, is neither bilateral nor multilateral, but a combination of both.
The bilateral-multilateral dichotomy is a staple of the International Relations literature. It is prominently featured in the grand debate pitting constructivists against realists. RuggieFootnote 2 characterizes the last seventy years as a progressive shift away from bilateral and hegemonic regimes, in which relations among states are compartmentalized into dyads and obligations are specific to each dyad, toward multilateral regimes, characterized by equal treatment and universal participation. Realists such as MearsheimerFootnote 3 counter that the spread of international institutions changes nothing in the way states have been interacting for centuries, for these institutions merely reflect the more powerful states' calculations.Footnote 4 Using a more fine-grained approach to institutional reality, students of the trade and aid regimes have found that multilateral and bilateral obligations actually coexist, but in neither case has this finding led to a formalization that would make it possible to predict the actual proportion of multilateral and bilateral instruments.Footnote 5 The institutionalist literature in general holds that multilateral institutions perform better in issue areas involving bargaining and coordination, while bilateral institutions do better in areas involving enforcement through retaliation, but this literature stops short of arguing that the two instruments are necessary complements.Footnote 6 In this article, I show that both bilateral and multilateral instruments are optimally used in the nonproliferation regime, and for reasons other than the bargaining-enforcement dichotomy.
I offer a general rationale for the complementarity of multilateral and bilateral diplomacy. Regimes are like contracts in which a group of founders purchase a good from signatory states in exchange for a price and/or the nonimposition of a sanction. Such contracts can be multilateral, offering uniform terms across eligible participants, or they can be bilateral, customizing the offer to reflect each state's peculiar circumstances. The multilateral strategy has the advantage of saving on transaction costs—there is only one deal and it is the same for everyone—but has the drawback of being expensive: participants are offered an incentive that is calculated to be sufficient to elicit the participation of the individual state that is burdened with the highest cost of compliance with the proposed regime. In contrast, the bilateral strategy allows the founders to save on resources by giving each state the incentive it needs to participate and no more. However, the bilateral strategy offers drawbacks as well, multiplying transaction costs, since a brand new contract has to be written for each new participant. Consequently, I argue, for states with a low cost of compliance, a multilateral instrument should suffice, whereas for states with a higher cost of compliance, this multilateral instrument should be supplemented with bilateral deals.
A second notable feature of the NPT regime is nonparticipation. It took many years after the signing of the treaty in 1968 for most countries to join and to date four states still have not. Recent work on the causes for restricted membership point to the severity of the enforcement problem, in contrast with the severity of the distribution problem, which, instead, is thought to correlate with expanded membership.Footnote 7 I show that a severe distribution problem is a primary cause for restricted membership. States with a high cost of compliance are left out of the regime and, in some circumstances, even punished for not participating.
I model the NPT regime as a contract between nuclear and non-nuclear-weapon states. The former want the latter to forfeit the right to develop nuclear weapons, which the latter prefer to keep in order to face rivals in local arms races. I formally demonstrate the existence of an optimal combination of three instruments: the multilateral treaty itself, bilateral incentives in the form of security guarantees offered by the superpowers, and sanctions inflicted on nonparticipants. I then show, in accordance with the argument, the existence of a statistical relation between a country's marginal cost of compliance, the basket of positive and negative bilateral incentives that it received, and the decision to join the multilateral regime.
Last, because the model is custom-made for the nuclear proliferation regime, I assess its generalizability to currency, trade, and aid regimes. These cases provide a realistic assessment of the model's boundary conditions.
The article is organized as follows. I first present and model the nonproliferation regime. I then draw the comparative statics and confront the model against what is known of the nuclear nonproliferation regime. Last, I contrast the present approach with existing empirical studies of the NPT regime and sketch possible extensions of the model to the other regimes.
The Nuclear Proliferation Regime
This section describes the three-instrument structure—multilateral, bilateral, and exclusion—of the proliferation regime. The parties to the regime belong to two distinct groups: on the one side are the countries forming the nuclear cartel, on the other are the non-nuclear-weapon states. The cartel initially included the United States, Britain, and the Soviet Union; France and China were given an open invitation to join the cartel as nuclear powers; the non-nuclear countries were all the other countries. Then the first three nuclear powers co-opted all exporters of nuclear fuel or technology within the so-called Nuclear Suppliers Group (NSG) to enforce the treaty, with the result that many non-nuclear countries embraced the nuclear cartel countries' preferences, somewhat blurring the boundaries between roles.Footnote 8
The regime arms the cartel with three incentives to deter non-nuclear countries from pursuing nuclear arms, the first being a carrot in the form of easy access to future scientific nuclear technology. The NPT explicitly provides for signatory states to gain access to the scientific spin-offs and technological by-products of nuclear explosions at production price, free of research and development costs.Footnote 9 A second incentive is the stick against nonparticipation, of which the effect is to worsen a nonmember's reservation value by threatening to block access to fissionable material and technology for the production of nuclear material for peaceful purposes.Footnote 10 A third component is the stick against cheating, required to combat moral hazard. The cartel cannot directly observe whether or not signatories comply, but has access only to imperfect reports drawn up every year by the International Atomic Energy Agency (IAEA) inspectors. To deter cheating, the treaty threatens to refer to the UN Security Council signatories who would be caught in breach of compliance.Footnote 11
Noncartel members fall into three groups. A first group joined because the mix of carrots and sticks featured in the treaty provided just the right incentive to renounce the nuclear option. A well-known case is Sweden. Swedish premier Tage F. Erlander was very clear about the link between his country's renunciation of the nuclear program and the NPT. In 1963, he informed the United States that Sweden “had the possibility of developing its own weapons rather quickly and quite easily.”Footnote 12 He added that there was no desire to do so, but that it would depend on whether the Federal Republic of Germany acquired nuclear weapons. He also hoped that “a great power agreement to end tests and put the lid on Nth [sic] countries will spare the Government from facing this issue.”
Some countries would probably have given up the nuclear-weapon option for much less than offered by the NPT. While already at peace with their neighbors and entertaining no ambition in the nuclear energy field, signing the treaty would unlock access to U.S. nuclear fuel for the research reactors and other peaceful applications they had or were planning to build in the near future. This group included Mexico, Ecuador, Peru, Bolivia, Senegal, and Morocco—countries that were quick to ratify the NPT.
However, a second group of noncartel countries renounced nuclear weapons development only after receiving extra compensation or specific threats from the two superpowers. Countries that already benefited and kept benefiting from a superpower's security guarantee are the first to fall in this group. The North Atlantic Treaty Organization (NATO) extended the U.S. nuclear umbrella to Canada and the European allies and removed the need for indigenous nuclear weapons programs. A good illustration is Norway. Unlike Sweden, a non-NATO country that maintained a nuclear weapons program until 1972, Norway excluded that option as soon as it became a member of NATO in 1954.Footnote 13 East European states, with the possible exception of Romania, did not pursue nuclear weapons in exchange for the Soviet nuclear umbrella. As a result, with few exceptions, NATO and Soviet bloc European countries were ready to sign and ratify the NPT when it was offered to them.
Outside Europe, the United States had bilateral security arrangements with Japan, Australia, New Zealand, the Philippines, South Korea, and Taiwan, providing Washington with unique leverage on some of them. For instance, when South Korea announced it would buy a reprocessing facility from France, allowing it to separate plutonium from spent fuel that could be used in a nuclear bomb, the United States successfully blocked the deal by threatening to end further delivery of fuel and equipment to a U.S. reactor under construction and promising to maintain its military presence. A similar story unfolded in Taiwan in 1975–76.Footnote 14 Likewise, Egypt would have pursued the bomb had not it been for U.S. diplomatic initiatives, including reassurances that Israel “will not introduce” nuclear weapons into the Middle East.Footnote 15 Conversely, the drop in the credibility of Soviet security assurances in the late 1980s and the official withdrawal of all security guarantees by the new Russian government in 1991 prompted the acceleration of nuclear programs in North Korea, Iraq, and Iran.Footnote 16 U.S. bilateral diplomacy also played an important role in the denuclearization of South Africa and, consequently, the entire southern tip of the African continent. Active American mediation and financial assistance in the cases of Belarus, the Ukraine, and Kazakhstan were determinants in securing the membership of all three states in the NPT as non-nuclear-weapon states.Footnote 17
Third and last, there is a final group of countries for which neither the lure of multilateralism nor bilateral wheeling and dealing were sufficient to elicit participation. Many states waited several decades before accessing to the treaty: Brazil, Argentina, Chile, South Africa and its neighbors, Cuba, and Algeria. Three states have not signed the treaty yet—Israel, India, and Pakistan—while one, North Korea, signed it but then denounced it.
In sum, the nuclear proliferation regime presents a variety of instruments, each aimed at countries with different compliance costs: the NPT was targeted at countries with a low cost of compliance; superpowers' security guarantees and other offsetting policies supplemented the NPT for countries with intermediate costs; sanctions were imposed on a residual group of nonparticipants. I model this instrumental gradation in the next section.
A Contractual Model
I model the nuclear proliferation regime as a contract between a principal (the nuclear cartel) and a large number of agents (the rest of the world). Although the principal-agent terminology has been mostly used in political science to characterize a delegation from, say, voter to elected representative, or from state to international organization, it is the standard terminology in the field of mechanism design for characterizing opposite roles assumed by parties to a horizontal transaction—seller and buyer, employer and employee, lender and borrower.Footnote 18
I build on a model of monopolistic competition—a buyer-seller relation in a noncompetitive market under complete information. I leave the interaction among principals out of the model. The nuclear cartel is assumed to act like a single player by means of an iterated play that is left unmodelled. I first present the problem as it stands between two agents and the principal and then extend it to a large number of dyads.
Principal and One Dyad
I derive the agent's utility from a model of the utility of nuclear weapons in a local arms race. States in general are motivated by a desire to influence other states, and the asymmetric possession of nuclear weapons provides them with such influence. Two agents are engaged in an arms race modeled as a prisoner's dilemma, with temptation payoff z − c, sucker payoff −z, cooperation payoff normalized to 0 and suboptimal payoff −c. The index of rivalry between the two countries is z with z an integer drawn in the [1,N] segment. At this point, z can be interpreted as an agent's compliance cost (this is the right that the principal covets). The cost for an agent of building nuclear weapons is c with c > 0.
Both z and c are common knowledge. I assume common knowledge because asymmetric information would detract from the primary interest of this study, which is the relative importance of bilateralism, multilateralism, and exclusion in the NPT regime.
The principal values disarming by one agent at V > 0 and nondisarming at 0. The principal confronts each agent separately with a contract that (1) offers payment a in exchange for an agreement to disarm, (2) threatens sanction d in the case of no agreement, and (3) threatens sanction s in the case where an agreement is reached but the agent is thought to have armed nevertheless. This three-incentive structure closely mirrors the text of the NPT, which, as was shown earlier, combines one carrot and two sticks.
The principal incurs a per-agent cost ɛs for executing sanction s and a per-agent cost ρd for executing sanction d with ɛ and ρ > 0. I ignore transaction costs for now, for they are of no relevance to this preliminary game.
I also assume that promises and threats are credible ex ante. Credibility is the result of a costly signaling game or a reputation game that is not modeled here because it is unnecessarily complex. Leaving the credibility-generating mechanism out of the game, however, is bound to lead to absurd results with respect to incentives that do not fall on the equilibrium path, such as sanctions. For instance, the principal could threaten a hellish punishment and extract compliance at no cost because she would be released from having to deliver on the sanction threat. Unless the cost of sanctioning figures on the equilibrium path, any sanction value goes. To circumvent this problem, I assume that the mere threat of sanctioning is costly. The principal incurs a per-agent cost σs for threatening s and a per-agent cost δd for threatening d with σ and δ > 0. The two threat costs capture, in much-reduced form, the ex ante costs that a principal must sink prior to uttering a threat in order to establish a reputation, often through the initial imposition of high-cost sanctions.Footnote 19
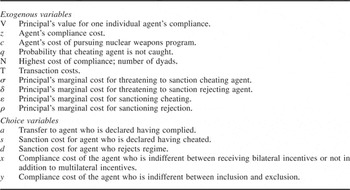
Compliance with treaty obligations is not directly observable by the principal. The probability that an agent who cheats is not caught by the principal is q. For convenience, AppendixTable A1 lists the notation used in the model.
The principal moves first, then the agents sequentially decide to reject or accept the offer. At no loss to generality, I assume that agent 1 moves first, agent 2 second. If neither accepts, the game ends. If one rejects and the other accepts, the former is sanctioned and the other chooses whether to comply and be rewarded, or cheat and be rewarded with q probability and punished with probability 1 − q. If both accept, then they simultaneously choose between complying and cheating (they do not observe each other's choice) and are either rewarded or punished accordingly. The game tree is drawn in Figure 1.
Game tree for the principal-and-one-dyad game

A strategy for the principal specifies the (a,d,s) regime she proposes. A strategy for agent 1 is the mapping (a,d,s) → {A,R} and (a,d,s) × {A} × {A,R} → {C,S} specifying for every possible regime whether to accept or reject and, after accepting and for every possible decision of agent 2, whether to comply or shirk. Similarly, a strategy for agent 2 is the mapping (a,d,s) × {A,R} → {A,R} and (a,d,s) × {A,R} × {A} → {C,S}. The solution concept is the subgame perfect Nash equilibrium.
The principal has a clear goal—nonproliferation—which her control of the agenda enables her to achieve by following a simple strategy: offer a regime that leads the agents successively to accept the offer and comply with the obligation of disarming. To enable such result, the principal's choice of design must satisfy a certain number of constraints. A first set of constraints, called “participation constraints,” insures that each agent prefers “accept” and “comply” to “reject.” Depending on what the other agent is doing, there are two participation constraints for each agent. A first participation constraint insures that agent i prefers “accept” and “comply” to “reject” given that agent j rejects, with i,j = 1,2. Formally, −z + a ≥ −c − d. In other words, the agent's payoff for acceptance and compliance, which is equal to sucker payoff −z plus transfer a, must be greater than or equal to the agent's payoff for rejecting the contract, which is equal to the suboptimal payoff −c plus the harm caused by the sanction for not participating −d.
A second participation constraint insures the same result given that j accepts and complies. Formally, a ≥ z − c − d, with, on the left side, the cooperation payoff (normalized to zero) plus transfer a, and, on the right side, the temptation payoff z − c plus the sanction payoff for not participating −d. This second constraint is mathematically identical to the first constraint.
In addition to insuring that agents participate, the principal must also insure that they comply. Two constraints, called “incentive constraints,” must be satisfied to insure that result. A first incentive constraint requires that i prefers “accept” and “comply” to “accept” and “shirk” given that j rejects. Formally, −z + a ≥ −c + qa − (1 − q)s. The left side is the same as above. The right side features the suboptimal payoff −c, the transfer a, which the cheating agent receives with q probability, and sanction payoff −s, which he receives 1 − q of the time. A second incentive constraint insures the same result given that j accepts and complies. It is mathematically identical to the first incentive constraint and need not be repeated.
Three additional constraints are required to prevent carrots from changing into sticks and sticks into carrots: a,d, and s ≥ 0.
Solving the game is tantamount to solving a constrained maximization problem—program P 1—in which the principal chooses the mix of incentives a,d, and s so as to maximize her utility for disarming the two agents subject to the five aforementioned constraints:

The principal's payoff U P is, for each agent, the gain for disarming V minus the paid transfer a, further diminished by the aggregate cost of threatening sanctions δd + σs.
The solution to the problem yields a unique equilibrium for each configuration of parameters V,δ,σ,z,c, and q. More precisely, depending on the relative marginal costs of the incentives that are featured on the equilibrium path, respectively unity for rewarding, δ for threatening to sanction nonparticipation, and σ for threatening to sanction cheating, the solution features either a reward-only regime, a regime with sanctions only, a regime with only one sanction, or any mix thereof. Since the determination of the incentive structure of a particular regime—the particular mix of sticks and carrots—is not the primary goal of this article, I only solve the game for the incentive structure that most closely conforms to the reality of the nuclear proliferation regime: a mixed-incentive structure or a,d, and s > 0. The solution to the principal-and-one-dyad game is stated in the following proposition.
Proposition (1):
The principal-and-one-dyad game has a family of mixed incentive equilibria of the form a* = z − c − d,
 , for any fixed d ≥ 0 and for 1 = δ + σ. Both agents accept the contract and disarm.
This result is proven in the Appendix. Note that the equilibrium is calculated for a and s as a function of d. This is because the mixed-incentive equilibrium is underspecified and can only be determined for two choice variables as a function of the third.Footnote 20 I chose to make d the determinant for reasons that will become apparent in the empirical section. Also note that both the reward and the two sanctions are present in the equilibrium because the reward has the same marginal cost as the two sanctions added together. This knife-edge condition does not necessarily mean that the mixed incentive equilibrium is a zero-probability event. More likely, it represents the unresolved nature of the debate on the relative efficiency of carrots and sticks, a debate that is fueled by the fact that different interest groups often have opposite stakes in this debate.
The result in proposition (1) exhibits both intuitive and counterintuitive causal connections. On the intuitive side, first, both transfer a and sanction against cheater s increase with the cost of compliance z, suggesting that countries that find it hard to part with nuclear weapons invite a higher price to join in and a steeper sanction to comply. Equally intuitive is that both incentives decrease in c, the opportunity cost of disarming. Also, a rise in nonparticipation sanction d logically commands a lower transfer a to participants; splurging on the sticks allows the principal to save on the carrot—carrot and sticks are interchangeable.
Less intuitive is that a rise in the sanction against nonparticipation, d, commands a higher sanction against cheating, s. This is because a rise in d brings into the regime members with higher compliance costs, who would not have joined otherwise, and therefore are harder to deter from cheating. Expanding membership to tough types without further repressing cheating is cause for cheating. This conclusion is in line with the link between “deep cooperation” and the need for enforcement underlined by Downs, Rocke, and BarsoomFootnote 21 as well as the simultaneous widening of European integration and deepening of its judicial system.Footnote 22
Principal and “N” Dyads
I now expand the model to a large number of dyads. I make the simplifying assumption that each country is part of only one dyad. The assumption captures the main idea that arms races are local, in the sense that Brazil worries about Argentina getting the bomb a lot more than North Korea or Iran. Note, though, that the assumption leads one to ignore arms races that are not strictly dyadic but involve three or more countries—Chile also worries about Brazil and Argentina getting the bomb.
Dyads differ with respect to the rivalry index, z. For the sake of simplicity, I assume that the dyads are distributed discretely on z; they are numbered according to the intensity of rivalry z k with k varying from 1 to N, such that z 1 = 1, z 2 = 2,…, z N = N. Hereon, z k may be interpreted as an agent's marginal cost of compliance: it is equal to the marginal value that each agent attributes to a prize equally valued at 1.
The incentive structure of the regime again is of the mixed type.Footnote 23
The principal's choice variables are twofold: whether to exclude or include, and, in the case of inclusion, whether to do so only by means of a multilateral treaty or also with bilateral instruments. The two types of instruments differ in two respects. First, a multilateral treaty provides all signatories with the same contract irrespective of their compliance costs. It is analogous to the law of one price in market economics. In contrast, a bilateral instrument allows the principal to offer each agent his own compliance cost. The bilateral approach is equivalent to market segmentation practiced by monopolists.
Second, the transaction costs for the multilateral approach are lower than for the bilateral approach. Transaction costs is a basket category, initially coined by economists to explain why market relations, understood as a contract between two independent individuals, might fail to maximize these individuals' joint utility.Footnote 24 Here, I adopt a restrictive definition of transaction cost as the contractual costs incurred in the process of making a deal. Aggregate transaction costs are lower for the multilateral approach to regime building than for the bilateral approach because there are scale economies in bargaining and dealmaking.Footnote 25 I model this feature by assuming that any deal, bilateral or multilateral, costs constant T to process, with T positive.
From these two differences, it follows that the principal matches instrument with agent's compliance cost: (1) the multilateral treaty is calibrated to the low and intermediate marginal-cost agents, (2) bilateral instruments are directed to intermediate cost agents, and (3) exclusion targets high cost agents. To see this, first imagine a situation with no transaction cost. The principal only uses bilateral contracts. This is easily seen in Figure 2A, in which I map the cost to the principal on the vertical axis as a function of the agent's compliance cost z on the horizontal axis, with integer v > 1 a point on the z axis. To keep the graph two-dimensional, it is assumed that the only incentive that is available to the principal is the transfer a(z); s(z) = d(z) = 0. The cost of wooing countries with compliance cost less or equal than v by means of a multilateral contract is equal to the va(v) rectangle, because the multilateral approach forces the principal to pay the transfer it pays to v to all agents left of v. In contrast, by means of bilateral contracts alone, this same cost would be equal to ∑1va(z), the triangle situated below the curve, which is only half the size of the rectangle. The triangle above the curve is a surplus that I refer to as the “agent surplus” in direct analogy with the “producer surplus” of market economics.Footnote 26
Impact of transactions costs

With a transaction cost T significantly different from 0, however, the v bilateral contracts could be costlier than a multilateral contract. This case is represented in Figure 2B, where the cost of the multilateral contract is the same as before plus the transaction cost incurred once (va(v) + T), while the cost of the bilateral contracts is the former triangle augmented with the transaction cost incurred v times (∑1va(z) + vT).
Impact of transaction costs

Finally, there is a higher value of v past which the bilateral approach becomes the less costly of the two again. Indeed, it is easy to verify that as v increases, so does the relative size of the c b a(v) triangle relative to the cde triangle. Therefore, from the principal's perspective, the presence of transaction costs makes the one-treaty approach more efficient than the bilateral approach for low-compliance-cost countries, but less efficient for high-compliance-cost countries.
Although I have assumed so far that every country is included, this need not be so. The principal would like to exclude countries with excessively high compliance costs. She gains nothing from an agent's nonparticipation, she may actually lose something if she sanctions them; and yet she is nevertheless better off excluding than including these countries in the regime.
Combining these different insights yields the solution template drawn in Figure 3 (also drawn under the assumption that s(z) = d(z) = 0). On the left-hand side of the graph, in the (1,x] segment, the agent's cost is sufficiently low that it makes sense to seek nonproliferation by offering a reward and by doing so through a single generic contract, minimizing transaction costs but providing a surplus to all the agents to the left of x. In the middle part of the graph, in the (x,y] interval, each agent's compliance cost is too high in relation to the fixed transaction cost for overlooking the surplus. Rather than offering a beefier multilateral contract, the principal tops off the existing multilateral contract with bilateral contracts customized to each member of the interval. Finally, there is a third group of agents on the right-hand side of the graph, the (y,N] segment, with costs of compliance that are so high that it is not in the interest of the principal to even try to elicit their compliance. To put it succinctly, the regime should obey the following generic condition:
Lemma 1: If x = z k, with k ∈ (1,N], is defined as the level of dyadic rivalry that makes the principal indifferent between giving or not giving bilateral incentives in addition to multilateral incentives to the agents in dyad k, and if y = z l, with l ∈ (1,N], is defined as the level of dyadic rivalry that makes the principal indifferent between including and excluding the agents in dyad l, the regime must satisfy 1 ≤ x ≤ y ≤ N.
Solution template

The analogy with consumer economics assumes that the incentive is a reward. What if, instead, the principal merely threatens to sanction noncompliance? The analogy still works provided that one is ready to think of sanctions as negative prices. For instance, Santa Lucia, a country better known for its beaches than its desire to pursue nuclear weapons, would comply with the proliferation ban even if she were given negative price −s or, to put it more intuitively, even if she were asked to pay s in addition to complying. The fact that she is not asked anything besides compliance means that she saves s. Generally speaking, positive incentives set the agent's reservation value to 0, whereas negative incentives set the reservation value below 0.
Solving the N-dyad game allows for the principal to choose cutpoints x and y that maximize her aggregate utility while simultaneously satisfying the constraints necessary to have y dyads take the mixed-incentive contract and comply. Formally, it means for the principal to solve program
![\begin{equation*}
P^{N}=\left\{
\begin{tabular}{l}
$\underset{x,y}{\max }U_{P}=2xg\left( x\right) -T+2\sum_{x+1}^{y}\left(
g\left( z\right) -T\right) -2\rho \widetilde{d}\left( N-y\right) $ \\
with $g\left( z\right) =V-\left( z-c-\widetilde{d}\right) -\sigma \left(
\frac{z-c}{1-q}q+\widetilde{d}\right) -\delta \widetilde{d}$ for any $z\in
(1,N]$ \\
and such that $1\leq x\leq y\leq N.$%
\end{tabular}%
\ \ \ \right.
\end{equation*}](https://static.cambridge.org/binary/version/id/urn:cambridge.org:id:binary-alt:20160714023257-42184-mediumThumb-S0020818308080156jra_eqnU003.jpg?pub-status=live)
Function g(z) is the principal's payoff for extending a mixed contract to a country with war intensity z. It is constructed by substituting the equilibrium values of proposition (1) into the principal's utility function previously defined in P 1. The first two terms of the principal's utility function U P are the principal's net gain for the multilateral treaty with the first x dyads: she gives to each of the x dyads of that group the same treatment as to the dyad with the highest marginal cost of compliance in that group, z = x, and pays only one transaction cost. The summation term is the principal's net gain for the y − x dyads with which she signs 2(y − x) bilateral treaties with as many transaction costs.Footnote 27 The last term is the cost to the principal of excluding N − y dyads from the regime.
The problem affords different types of solutions depending on the values taken by x and y. I do not solve for all of them, but focus instead on the one that corresponds to the NPT regime—the mixed instrument regime (not to be confused with the mixed incentive structure also present in the NPT regime), featuring a multilateral treaty, numerous bilateral agreements, and the exclusion of a handful of countries. This is the case for which 1 < x < y < N. That equilibrium is stated in proposition (2) and proven in the Appendix.
Proposition (2): There exists a subgame perfect Nash equilibrium in which the principal offers
1. transfer a M* = x* − c − d̃ and sanction threat
 to agents with rivalry index z ∈ [1,x*); agents accept and comply;
2. transfer a*(z) = z − c − d̃ and
to agents with rivalry index z ∈ [x*,y*); agents accept and comply;3. no transfer but inflicts sanction d̃ on agents with rivalry index z ∈ [y*,N]; with
 to agents with rivalry index z ∈ [1,x*); agents accept and comply;
 to agents with rivalry index z ∈ [x*,y*); agents accept and comply;

Clause (1) summarizes the multilateral instrument, clause (2), the multilateral together with the bilateral instruments, and clause (3), the conditions of exclusion. Incentives are higher for agents who receive bilateral instruments. Note also that the equilibrium obtains for a specific family of parametric configurations, which one may characterize as intermediate values of transaction cost T expressed as a function of the other parameters. A T that is too small takes the wind out of the multilateral instrument, whereas a very large T prices out all types of instruments.
Conjectures and Empirics
The central idea of this article is that the NPT regime has three components—multilateral, bilateral, and exclusion—and that the relative importance of each component is a function of both compliance and transaction costs. Although I showed in the first section that a cursory sorting of countries matched this three-tiered structure, the result could either be spurious or statistically insignificant. To raise confidence in the belief that the model captures the actual causal mechanisms behind this sorting, one needs to draw more predictions and test as many of those as possible against historical reality. Therefore, I use the model to draw a series of conjectures. The model's comparative statics—eight total—are calculated in the Appendix; four of them are tested below.
First, proposition (1) predicts that a higher rivalry index implies a higher compliance cost and thus a higher risk of exclusion. Although fairly intuitive, the prediction conflicts with Koremenos, Lipson, and Snidal's “M3 conjecture,” according to which “inclusive membership increases with the severity of the distribution problem.”Footnote 28 The M3 conjecture draws on Snidal'sFootnote 29 work on relative and absolute gains; it rests on the assumption that states are concerned about power gaps that might develop between them as a result of a commonly but asymmetrically beneficial endeavor, like trade for instance. Trading with other states, Snidal argues, may mitigate this concern—hence the drive for inclusion. Although the present model clearly deals with a distributive issue, the relative gains concern is absent from the principal-agent relation, yielding an opposite prediction as to the impact of distribution on inclusion. Hence, the first conjecture:
Conjecture 1.
Rivalry: A higher rivalry between members of a dyad and thus a higher marginal cost of compliance implies a greater risk of exclusion.
Second, the costlier the development of nuclear arms is to the agents (the higher c), the more inclusive the regime is. This stands to reason, the same way as it stands to reason that a buyer and a seller of a good are more likely to reach an agreement if the seller's value for the good is low. The monetary cost of pursuing a weapons program cannot be directly observed, but since it matters only in relation to the wealth of the potential agent, it is easily proxied by the latter. Hence the second conjecture:
Conjecture 2.
Affordability: The greater affordability of nuclear weapons raises the risk of exclusion.
Third, the regime is more inclusive if it is costlier to the principal to sanction nonsignatories. In such a case, the sanctioner tries to reduce the pool of nonparticipants who have to be sanctioned by signing in more countries. The hypothesis applies to the marginal cost ρ, and in some cases to the unitary cost d̃ (see Appendix for details). If the commitment to sanctioning nonparticipation frays, then initially-agreed-upon transfers will no longer suffice to prevent more agents from opting for nonparticipation. One should observe the following conjecture:
Conjecture 3.
Sanctioning Capacity: A rise in the sanctioner's sanctioning cost of nonparticipation increases the risk of exclusion.
Fourth, a rise in monitoring inefficiency q also leads to a rise in the fraction of excluded countries; this is because deterring cheating calls for a higher transfer, making inclusion costlier and thus exclusion cheaper. This is a standard result, though it is usually phrased differently: the more severe the moral hazard problem is, the more centralized the monitoring device has to be to hold membership constant.Footnote 30 Hence, the last conjecture:
Conjecture 4.
Monitoring Capacity: A rise in monitoring efficiency decreases the risk of exclusion.
Four more comparative statics should be mentioned despite the fact that they cannot be tested on the NPT case. First, a principal with a higher value for nonproliferation excludes fewer countries (a rise in V yields a rise in y). Since I see no reason why the superpowers' valuation for nonproliferation would have changed over time, the conjecture is not testable on the NPT case. Second, a rise in the cost of threatening sanctions makes inclusion costlier to the principal, thereby increasing the number of excluded states (a rise in σ or δ yields a drop in y). It is difficult, however, to entertain the idea that reputation costs change over time. Last, a rise in transaction costs yields a drop in the use of bilateral instruments (a rise in T yields a rise in x but drop in y). Although central to the model, this prediction can only be tested on a sample of regimes. I do not do this systematically but offer illustrations in the penultimate section.
I now look at the evidence for the four highlighted conjectures.
Rivalry and Affordability
I test the rivalry and affordability conjectures by correlating the principal's decision whether or not to include a country in the regime with that country's security characteristics and wealth. A nonparticipant being a nonsignatory, the dependent variable is npt ratification, coded 1 for ratification and 0 for nonratification.
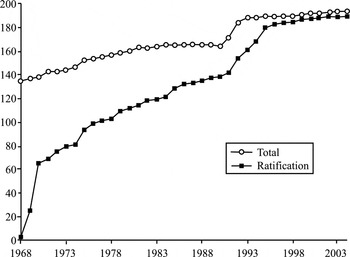
Ratification is a unidirectional decision: once made, it is typically not, with one exception, taken back. Moreover, countries that ratified did it over a period of thirty-plus years (see Figure 4), during which many countries' security position changed. I use the technique of event history modeling that allows one to focus on the spell of time before ratification occurs and study the respective impact of cross-national and time-varying covariates.Footnote 31
Number of ratifications and total number of countries

A first set of independent variables seek to capture the rivalry index (z). A key implication of the local arms race is that countries that feel threatened by their neighbors should be less eager to give up their right to acquire nuclear weapons. I assume that the sense of insecurity reflects the history of conflict. I alternatively use two measures of a country's history of conflict. A first measure hostility is the sum of the Correlates of War (COW) indices of hostility levels with contiguous states averaged over the prior twenty years.Footnote 32 A second measure, enduring rivalry, is participation in an enduring rivalry because most militarized disputes occur in the context of enduring rivalries.Footnote 33
A country's sense of insecurity may also reflect the regime type of its neighbors. Building on the democracy and war literature, I venture that being in the neighborhood of democracies provides a country with a greater sense of security than if it were surrounded with autocracies. The variable democratic neighbors is a weighted average of the democracy score of a country's neighbors. I used national capabilities as weight to select out information on a country's neighbors that are smaller than the country and unlikely to represent a military threat.Footnote 34
The modeling of the local arms race as a prisoner's dilemma suggests that the worst outcome is for one side to give up nuclear weapons unilaterally, for then the other side has an advantage in not doing so. This suggests that a country would not join the NPT regime unilaterally, but in coordination with its neighbors. One observes instances of this logic in Western Europe and in the Southern tip of Africa. I created the variable neighbor's ratification, which for a given country, identifies all its contiguous countries, determines whether or not they have ratified the NPT, and weighs that score with their relative power.Footnote 35
The presence of a security threat may not lead a country to acquire nuclear weapons if the threat is offset by a security guarantee from a nuclear power (variable a). Security guarantees figure as one of the most effective bargaining tools that the United States and the Soviet Union used in their respective bilateral efforts to stop proliferation. I build the variable superpower's defense guarantee, which identifies all the countries toward which the United States or the Soviet Union/Russia had a formal defensive obligation during the year of observation.Footnote 36 I am aware that many of the guarantees that are included in the dataset were not granted bilaterally but through a collective security treaty—NATO for example. I treat them as bilateral instruments nevertheless because the model does not recognize a regional level different from the bilateral and multilateral levels. There is also the fact that NATO—the most “collectivist” of the regional arrangements—is not a symmetric alliance: with the notable exception of the American superpower, no single member country is indispensable to the survival of NATO, not even Britain or France.
Not quite a security guarantee, but a source of U.S. leverage nevertheless, is u.s. aid per capita, the total amount of economic and military aid provided by this country and calculated as a proportion of the population of the receiving country.Footnote 37
The second independent variable is the affordability of a nuclear weapon program (−c), proxied by the wealth and size of the country: The larger and wealthier a country, the easier and more desirable the acquisition of nuclear weapons. I use total population to proxy for size and gdf per capita to proxy for level of development.Footnote 38
I round off the test with several control variables representing possible alternative accounts of a government's decision to ratify the NPT. A first control variable is peer pressure. Constructivists argue that, as more countries uphold the regime, the regime gains in authority and nonparticipants are hard-pressed to join. An easy measure of peer pressure is the cumulative number of members. I call this variable total ratification.
A second control variable is the end of the Cold War, which, according to realists, took the wind out of global regimes. I create the dichotomous variable 1991–2002, coded “1” during the corresponding years and “0” otherwise.
Moreover, Singh and WayFootnote 39 found an occasional role for regime type, the idea that a democracy is less likely to pursue nuclear arms and thus more likely to join the nonproliferation regime.Footnote 40
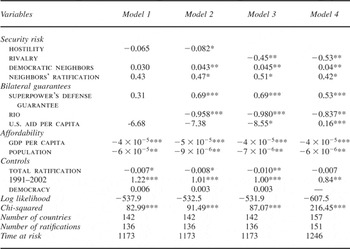
I estimate four Cox proportional hazards models on various combinations of independent variables. The proportional model is preferable to a parametric model in the absence of a particular theory about the way time affects the causal impact.Footnote 41 The universe is all sovereign countries in a given year, with the exclusion of the five nuclear powers recognized in the NPT. The results are presented in Table 1.
Cox models of NPT ratification

Notes:
Coefficients are estimates for Cox proportional hazards model; robust standard errors, adjusted for clustering by country, are used to calculate the p values for two-sided tests. GDP = gross domestic product.
*** p < .01;
** p < .05;
* p < .10.
The results for the baseline model, listed in column (1), seem weak at first sight—none of the security risk and bilateral guarantee variables are statistically significant. A closer examination of the data identifies as the cause for the unexpected result the Rio Pact countries: being a member of the Rio Pact makes a country less likely to sign and ratify the NPT than not being a member. Controlling for the Rio Pact in the other columns brings the security and guarantee variables in line with the present argument. There is one apparent exception to this generalization, the variable u.s. aid per capita, which in models 1, 2, and 3 is wrongly signed. Once again, a closer look at the data reveals that this result is not robust, but instead the artifact of collinearity with the democracy variable. Dropping the latter leads the variable u.s. aid per capita to be positively and significantly correlated with the dependent variable (model 4). A possible reason for this correlation is the greater likelihood for U.S. aid to be distributed to democratic than authoritarian regimes.Footnote 42
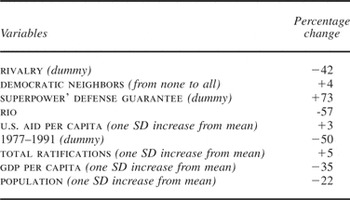
Models 2 to 4 underscore the importance of two sets of variables: the raw security risk, whether measured by hostility or enduring rivalry, and the security guarantees with the exception of the Rio Pact. I have no ready-made explanation for the Latin American exception, other than referring to the love-hate relation that exists between the United States and its traditional zone of influence. The coefficients on the security and guarantee variables are significantly different from zero. Their estimated impact on the dependent variable is also substantial. The entries of Table 2 represent the percentage change in the baseline hazard rate for a given change in each explanatory variable of model 4. For example, a country involved in an enduring rivalry with a neighbor has a hazard rate for signing the NPT that is 41 percent lower than a similar country involved in no enduring rivalry. In contrast, a formal security guarantee from a superpower other than through the Rio Pact increases the hazard rate by 71 percent. U.S. financial aid also plays a role, though a more limited one: a one-standard deviation increase from the mean yields a puny 4 percent increase in the chance of ratifying the treaty. These results make it clear that exclusion is a function of rivalry between neighboring states and thus of compliance costs with the principal's goal of nonproliferation. Koremenos, Lipson, and Snidal'sFootnote 43 idea that distributive problems at large can be solved by increasing membership is not observable in the nuclear proliferation regime.
Percentage change in hazards for statistically significant variables (Model 4)

Notes:
The change is calculated according to the formula: [(exp(beta*X2) − exp(beta*X1))/exp(beta*X1)] * 100, with beta the estimated coefficient, X1 and X2 respectively the mean and the mean augmented by a standard deviation for continuous variables, and 0 and 1 for dummy variables. SD = standard deviation.
In accordance with predictions, the economic variables have a meaningful negative impact on the odds of ratifying the NPT, confirming the affordability hypothesis.
Among the control variables, the cumulative ratification index has no noticeable effect on the rate of ratification in model 4 and is wrongly signed in models 1 to 3, and thus does not support the view that states wish to conform. Only the end of the Cold War is significantly and substantively correlated with ratification, though the sign belies gloomy neorealist predictions—ratification received a boost after 1990. Rather than sapping the basis for the nonproliferation regime, the end of the Cold War led to a revival of the NPT. I further investigate the reasons for this revival in the next section.
Sanctioning Nonparticipants and Monitoring Participants
I now present anecdotal and systematic evidence for conjectures 3 and 4 related to the principal's ability to sanction (ρ) and monitor (1 − q). During the period 1977–91, the founders lost their capacity to sanction nonparticipants and monitor cheating. They did not offset the deficiency in this incentive by making the other incentives more powerful. As a result, the nonproliferation regime exhibited a loss in efficiency; it stopped attracting participants. In 1991, in contrast, the founders rebuilt this capacity; they also strengthened the IAEA safeguards and verification regime, resulting in greater participation.
The surprise explosion of an Indian device in 1974 led the founders to open their initial export cartel to other suppliers of nuclear fuel and technology. They founded the Nuclear Suppliers Group (NSG) and established the Trigger List, a list of material and equipment, the export of which they would regulate. From then on, however, the NSG fell into a state of, in one of his past chairman's words, “relative inactivity.”Footnote 44 The supplier cartel broke up, divided between the three Anglo-Saxon countries (United States, Canada, and Australia), who held near-monopolist control on the supply of uranium, and France, Germany, Switzerland, and Belgium, who were willing to fill the demand for the construction of fuel facilities—uranium enrichment and plutonium reprocessing plants.Footnote 45 Cooperation within the cartel came to an abrupt halt. The group did not meet for thirteen years. During that period, no change was made to the Trigger List, despite a pressing need for regular updating and extension to keep up with new technologies.
Compounding the erosion of the export controls regime was the ongoing weakness of the IAEA verification regime. The regime was admittedly weak from the start: time, frequency, and scope of inspections had to be prearranged with each government. Still, it was expected that the discovery of cases of noncompliance would call for and result in step-by-step strengthening. The thirteen-year lack of coordination among supplier states prevented this from happening, giving a headstart to would-be rogues. Iraq's first-attempt at getting the bomb—centered around the Osirak reactor and an Italian hot cell to separate plutonium—was to have been an NPT-safeguarded and regularly IAEA-inspected facility. After Israel bombed Iraq's reactor in 1981, Iraqi leader Saddam Hussein created a clandestine weapons program, which, despite employing seven thousand people, remained hidden from Western inspectors for nearly a decade.Footnote 46
From a contractual perspective, the breakup of the cartel of suppliers modified the terms of the generic contract in favor of non-nuclear weapon states. Furthermore, the superpowers were not willing to make up for the weakening of the multilateral instrument by means of an active bilateral approach. The fall of the pro-American Shah in Iran and the Soviet invasion of Afghanistan in 1979 led the United States to take a more favorable attitude toward exports of fuel to India and Pakistan.Footnote 47 The administration of President Jimmy Carter exempted India from sanctions, while the Reagan administration maintained full military aid to Pakistan until 1990.Footnote 48
The 1977–91 years were bleak for nuclear nonproliferation. On average, fewer countries adhered to the treaty in that period. During this time, Brazil and Argentina, two nonsignatories, began their nuclear weapon programs, and South Africa, a nonsignatory, succeeded in building a nuclear device, while Libya, Iran, Iraq, and North Korea, four signatories, began cheating with their obligations under the treaty.
This dismal period came to an end in 1992, when the conjunction of long-trend effects (abundance of uranium, drying out of the market for nuclear power) and short-term emergencies (the Persian Gulf War and the subsequent discovery of unsuspected amounts of sensitive materials, equipment, and technology in Iraq) led France and Germany to rejoin the cartel and side with the U.S. desire to tighten up the regime. The list of sensitive items was expanded and export restrictions agreed upon thousands of items. The safeguards were tightened and the verification regime was strengthened through the 1997 Model Additional Protocols.Footnote 49 The 1990s saw a readjustment of the terms of the regime in favor of the nuclear cartel.
As a result, more states either signed and ratified or complied. Indeed, the list of states that acceded as non-nuclear-weapon states included Argentina, Chile, and Brazil in Latin America; South Africa, Angola, Namibia, Zambia, and Zimbabwe in the southern tip of Africa; Tanzania and Algeria in the rest of Africa; and all the ex-Soviet Republics in Asia. With the possible exception of some ex-Soviet Republics, none of these countries received positive or negative incentives other than those included in, or implied by, the NPT.Footnote 50
The hypothesis that the breakdown of the cartel led to a slack in joining rates is easily tested on the ratification dataset. To this end, I create the dichotomous variable 1977–91, coded “1” during the corresponding years and “0” otherwise. I merely introduce this variable in the prior data analysis, from which I remove the end of the Cold War variable 1991–2002 on the grounds that it corresponds, both statistically and substantively, with the rebirth of the cartel. Percentage changes in hazard rates for a given change in each statistically significant explanatory variable are reported in Table 3. The 1977–91 period exhibits a strong negative impact on ratification, with a level of ratification half of what it was in the prior and posterior periods. All prior results hold.
Percentage change in hazards for statistically significant variables (Model 4 modified)

Notes:
The change is calculated according to the formula: [(exp(beta*X2) − exp(beta*X1))/exp(beta*X1)] * 100, with beta the estimated coefficient, X1 and X2 respectively the mean and the mean augmented by a standard deviation for continuous variables, while 0 and 1 for dummy variables. SD = standard deviation.
In sum, four of the comparative statics that were drawn from the model find some form of historical validation: the risk of exclusion increases with (1) high compliance costs, (2) high opportunity costs, (3) poor sanctioning of nonparticipation, and (4) poor monitoring of compliance. These predictions are fairly intuitive, but given that they were all drawn from the theory, their empirical validation strengthen our confidence in the ability of the theory to explain the three-tiered structure of the nuclear proliferation regime.
Extensions
It remains to be seen what applicability the present model commands in cases other than nuclear proliferation. I try the model on the currency, trade, and aid regimes. Although the currency regime seems a straightforward application of the present model, the trade and aid regimes call for special attention because they differ from the proliferation and currency regimes in important ways: transaction costs take a different meaning in trade, whereas multilateralism can support market segmentation in aid.
Currency
The role of transaction costs in regulating the relative importance of multilateral and bilateral instruments is visible in currency regimes. Bretton Woods consisted of a multilateral agreement signed in 1944, featuring a common positive incentive—the possibility to draw resources from the International Monetary Fund (IMF)–and various bilateral arrangements between national treasuries.Footnote 51 In contrast, the gold standard in its heyday featured no multilateral instrument proper but consisted mainly of various informal arrangements between central banks. It is only after World War I that the regime became a matter for negotiations at international conferences.Footnote 52
The ratio between multilateral and bilateral components thus differed markedly between the two regimes: whereas Bretton Woods was run through the IMF according to rules consigned in the agreement, the gold standard essentially was run by central bank governors meeting one another on an ad hoc basis whenever they felt the need to. The principle of gold convertibility was commonly shared without having ever been sanctioned by an international conference because relations between governments were delegated to and mediated by financial markets, a mechanism apt to minimize transaction costs.
Today's international currency regime resembles the gold standard. There is no institutionalized multilateral regime beyond the occasional Group of 8 (G8) meetings among the major currency countries, while the IMF's role is limited to helping peripheral countries. Most of the bidding is made in global capital markets.
An effect of market mediation was, and is, to minimize the agent surplus that characterized Bretton Woods. Countries that were capable of monetary discipline still preferred to pursue liberal growth policies on the grounds that in case of emergency they could always avail themselves of the resources that were initially put in place for countries with less flexible domestic constituencies—a choice that eventually fueled worldwide inflation. Under market mediation, national treasuries pay interest rate premiums that closely reflect their monetary policies. Although more efficient, market mediation was not available in the postwar era because banks and securities markets were strictly regulated.Footnote 53 The multilateral agreement helped overcome problems of coordination among treasuries, which were held responsible for the collapse of the gold standard in the interwar period.
Trade
The notion of transaction costs that I have used so far is restricted to the contractual costs of bargaining usually expended in time, transport, hotel, and legal assistance, which can be substantial given the multiple rounds it often takes for each side to figure out their respective reservation value. Although present in trade negotiations too, these costs take second place to another kind of transaction costs known as externalities. Under the modern trade regime, any bilaterally-negotiated tariff reduction is extended to all other parties on the basis of most-favored-nation (MFN) treatment, potentially lessening the benefit that any country may expect from entering into a bilateral negotiation in the first place. As a result, negotiators have an interest in free riding on one another and few deals get made. The solution to externalities of such kind is a multilateral negotiation in which trade partners follow an inflexible bargaining rule such as a 10 percent cut across the board, cuts proportional to current level of protection, or what not.Footnote 54
While the inflexible rule approach addresses the externality problem (in a way that parallels how multilateral bargaining addresses the transaction cost problem), at the same time it presents the drawback of forcing the negotiations into a suboptimal outcome, since cuts no longer reflect each economy's relative comparative advantages and marginal costs, but are homogeneous across trade partners, causing an agent surplus cashed in by those who would have made the same cuts for less in return. This is the reason why, whenever externalities were tolerable, negotiations within the General Agreement on Tariffs and Trade (GATT)—and a fortiori outside the GATT in the form of voluntary export restraints (VERs)—were conducted on a “principal supplier” basis, whereby “a country could be requested to make a concession on a product only by the partner which provided the largest share of its imports.”Footnote 55
The trade-off between externality and agent surplus gives one a sense of the relative role of multilateral and bilateral negotiations within the GATT. Consider a country like the United States, a group of trade partners, and a given basket of products. The United States would want to engage in an inflexible multilateral round of negotiations with suppliers of products for which it does not have a principal supplier, thereby limiting externalities, while it would want to have bilateral talks with suppliers of products for which it does, thereby limiting the agent surplus. Of course, the fact that the United States is also a supplier and that all countries are in this dual position may complicate the calculations, but it does not change the comparative statics of the institutional equilibrium, making room for bilateral negotiations when externalities, that is, transaction costs, are low in order to minimize the agent surplus.
It is interesting to note that within the GATT/WTO, all enforcement, whether it is mandated by panel rulings or pursued outside of the legal framework (for instance, through “Section 301”), is done bilaterally. There is no multilateral sanctioning mechanism within the trading regime.Footnote 56 While some have been eager to see something in enforcement that would make it bilateral rather than multilateral, note that one-on-one retaliation does not work in matters of proliferation, which calls instead for export control groups—the NSG in the nuclear regime, the Australia Group in the chemical and biological regimes, the equivalent body in the Missile Technology Control Regime, and the granddaddy of all, the Coordinating Committee on Multilateral Export Controls (COCOM).Footnote 57
Aid
A key assumption of the model is the market analogy: the multilateral instrument treats all members in the same way, while the bilateral instruments, in contrast, allow for market fragmentation. This assumption is useful in regimes such as nuclear proliferation, currency, trade with MFN treatment, and probably many other regimes, but not in the aid regime. Aid, whether multilateral or bilateral, can be made to reflect the recipient's needs. As a result, the present model, applied as is, would predict that all aid should be multilateral because it has the advantage of minimizing transaction costs without the drawback of generating an agent surplus, since each recipient is (or could be) given to according to needs. Of course, this is not the case: no more than a third of all aid is estimated to be multilateral.Footnote 58 The mechanism responsible for the multilateral-bilateral structure in the aid regime calls for further analysis.
Recipient's need is the wrong dimension on which to classify countries. Recent studiesFootnote 59 have made patent what one always suspected: the need for aid plays second fiddle to the recipient's strategic, political, or trading usefulness to the donor, with the result that bilateral aid, unlike multilateral aid, is almost always politicized. Moreover, the two dimensions of need and usefulness are negatively correlated, and this for two reasons: first, the poorest countries are also those that are the least likely to be useful to rich donors; second, the poorest countries offer a greater developmental bang for the buck—morally, if not economically—than wealthier ones. As a result, Milner notes, “multilateral aid tends to be given to poorer countries on average than does bilateral aid.”Footnote 60
Analytically, the marginal gain of aid to the donor is one of two marginals. It is either the marginal developmental gain, which is obtained through multilateral aid and decreases with the recipient's wealth, or the marginal political gain, which is obtained through bilateral aid and increases with the recipient's wealth. The level of recipient's wealth at which these two marginals are equal defines a cutpoint below which the donor prefers multilateral aid to bilateral aid and beyond which the donor's preference switches to bilateral aid.
For a visual representation of this cutpoint, consider Figure 5, mapping the recipient's wealth on the horizontal axis and the donor's various marginal gains on the vertical axis. The descending curve maps the donor's marginal developmental gain of one dollar of aid as a function of the recipient's wealth, while the ascending curve maps the marginal political gain. The donor's marginal gain is maximized with multilateral aid up to the intersection point and with the addition of bilateral aid thereon. This intersection point corresponds to the x of the proliferation regime model, while the y falls to the right of x at a level of wealth past which it no longer is considered reasonable to ask for, or hand out, aid.
Structure of the aid regime

Therefore, only bilateral aid can be customized to the donor's political goals. The attribution of multilateral aid, in contrast, obeys fixed, impersonal criteria, over which individual governments have limited or no control. It is this second-order rigidity—the fact that all recipients have to be treated according to the same rules—that makes the member-surplus problem applicable to multilateral aid. Efficient for the most underdeveloped recipients, from which hardly any favor can be had, the multilateral mode of allocation becomes inefficient with countries that present donors with greater strategic or diplomatic opportunities. Rather than raising incentives for all recipients, donors prefer to customize incentives to targets of special interest to them. For instance, although both the United States and Europe value the protection of human rights and use aid to promote it, they have different geographic priorities, reflecting different colonial histories, inherited contacts, physical proximity, unresolved differences, and bargaining leverage. They use bilateral aid to foster human rights in their respective areas of influence.
In sum, the aid regime presents the same three-tiered structure as the nuclear proliferation regime. It can be modeled as a principal-agent contract and the logic for the cutpoint between multilateral and bilateral aid indirectly reflects the same member-surplus rationale, which I found to be at work in the NPT, currency, and trade regimes. Generally, to the extent that any multilateral regime treats members according to a set of fixed, impersonal criteria, it creates an inefficiency in the form of an agent surplus—a surplus distributed to members with compliance costs well below incentive levels set by impersonal rules.
Other Approaches to the Nuclear Proliferation Regime
Existing studies do not seek to explain membership in the NPT regime but focus instead on the decision to pursue nuclear weapons programs or acquire nuclear weapons.Footnote 61 While nuclear proliferation has been given a good deal of scrutiny in the literature, I wish to restrict this survey to two approaches—quantitative and interpretive—that have recently received attention.
On the quantitative side, three studiesFootnote 62 agree on the importance of technological determinants, economic capacity, and the existence of a security guarantee in the decisions to launch a nuclear research program and acquire and deploy nuclear arms. Of the three, the two more recent studies assess the relevance of NPT membership to proliferation: while they both find a statistically significant negative relation between accession to the treaty and developing nuclear weapons, Jo and Gartzke also test for what they call the “systemic effect” of the regime, proxied by the number of total ratifications, and find no relation. They conclude that “these results cast doubt on the validity of constructivist arguments about the transformative effect of international agreements at the system level… .”Footnote 63
The present analysis replicates most of these econometric results while using accession as a dependent variable, suggesting that the decisions to proliferate and join the NPT can be viewed as one and the same. The present study, however, cautions against Jo and Gartzke's conclusion that the regime is irrelevant. Their non-finding only applies to the multilateral component of the NPT regime, which they test against the bilateral component (the existence of nuclear guarantees). Not surprisingly, they find the latter to be both significant and important in predicting the launching of a nuclear program, but too hastily credit the finding to realpolitik in contradistinction with the regime, overlooking the fact that nuclear guarantees are a key component of the regime as a whole.
On the interpretive side, a new set of studies have portrayed nuclear proliferation as the new threat that has come to dominate the security discourse in the wake of the disappearance of the Soviet threat.Footnote 64 The “securitization” of proliferation and the demonization of proliferators as “rogue states,” these authors argue, further distanced the NPT regime from disarmament, which, along with nonproliferation, was among its initial goals. This trend has fueled the antagonism of developing countries led by India, who denounce the discrimination between the nuclear haves and the nuclear have-nots. According to Mutimer,Footnote 65 the current framing of proliferation as the main threat to world stability constitutes the main reason for India's consistent refusal to sign the NPT and its more recent refusal of signing the Comprehensive Test Ban Treaty.
This line of argument in many ways dovetails with the present analysis, which, more than any other, demonstrates the importance of bilateral security guarantees to the working of the regime. Security guarantees would not be credible if the guarantors were considering serious disarming. The drop in the credibility of Soviet security assurances in the late 1980s and their official withdrawal in 1991, for instance, had negative consequences for the NPT regime, prompting the acceleration of nuclear programs in North Korea, Iraq, and Iran.Footnote 66 Given the negative effects that disarming would have on guarantees, the price that India asked in order for its government to sign the NPT—disarmament—exceeds what the superpowers are willing to pay.
The difference, if any, between the interpretive argument and the present analysis resides in the future consequences of the Indian exclusion. Interpretivists may see it as the discursive basis for the mobilizing of widespread opposition among developing countries. I see it as an uncharacteristically high cost of compliance, affecting only India and a handful of countries finding themselves in a situation similar to that of India.
Conclusion
I used the NPT regime to illustrate the idea that dyadic diplomacy is not incompatible with the building of a multilateral regime, but an efficient component thereof. I also showed that exclusion is a constituent part of that regime.
Starting from a characterization of proliferation as the result of large number of prisoner's dilemmas played out between countries engaged in local dyadic rivalries, I used contract theory to characterize as equilibrium a strategy profile in which states with low compliance costs joined the regime on the terms of the multilateral treaty alone; states with intermediate compliance costs needed additional customized incentives, delivered through bilateral agreements; and states with high compliance costs were not only left out of the regime but also punished for nonparticipating.
I offered systematic historical evidence of the exclusion hypothesis, showing that non-nuclear weapons states' membership in the global regime was a negative function of their compliance costs and reservation value—the cost of building nuclear weapons. I offered anecdotal evidence that several other important regimes in the currency, trade, and aid areas, offered multilateral and bilateral dimensions in proportions compatible with the optimization calculation formalized in the model.
Dyadic diplomacy is a necessary component of the NPT regime because the NPT, as with all multilateral instruments, generates an “agent surplus,” collected by signatories who would have signed for much less than is being offered. It is this feature that made it impossible for the nuclear countries to write a collective security guarantee to all non-nuclear countries into the multilateral instrument itself, but required, instead, the use of bilateral diplomacy. The inefficiency of multilateralism is a cause for bilateralism that differs from the current literature's emphasis on enforcement. I suggested that the agent surplus inefficiency also characterized the trade and currency regimes as well as, with some modifications, the aid regime.
The exclusion of countries with high compliance costs is another requisite component of the NPT regime, because the nuclear cartel is unable or unwilling to meet their costs. Trying to bring India within the fold of non-nuclear countries at this juncture would require the nuclear five to cut their nuclear armament and thus weaken their capacity to extend security guarantees to countries with intermediate compliance costs, thereby reopening the question of these countries' membership in, and compliance with, the regime in the same way as the withdrawal of military security guarantees by Russia following the end of the Cold War led Iraq, Iran, and North Korea to reconsider their obligations under the terms of the treaty.
It is hard to agree with some characterizations of the last seventy years as constituting a progressive shift either away from multilateralism to minilateralism or bilateralism,Footnote 67 or from bilateral and hegemonic regimes toward multilateral regimes.Footnote 68 Nor should the reassertion of bilateral diplomacy under the administration of U.S. President George W. Bush drive one to skepticism about the empirical relevance of multilateralism. The existence or resurgence of bilateral agreements in and of itself provides no evidence for one characterization over the other. Bilateralism is no proof of realpolitik, but could be evidence of its opposite—regime strength—in an area characterized by a high degree of subsidiarity. It must also be determined whether bilateral agreements complement or detract from the corresponding multilateral regime.
The article has consequences for the definition of an international regime. The commonality of norms is more important to the existence of a regime than the laterality of the instruments that carry out compliance. Notwithstanding Ruggie, the two dimensions should not be conflated but kept separate. Moreover, the degree of institutionalization of an issue, usually defined by how much of it falls under the supervision of a multilateral instrument or an international organization, is no indication of the strength of that regime. In some cases, as with the gold standard, the institutionalized part of the regime, like the legendary tip of the iceberg, hides a much larger body below its flotation line, whereas in other cases, such as Bretton Woods, foam floating on the surface of an ocean is the more apt comparison.
Appendix: Proofs
Proposition (1)
The principal's problem is to solve program P 1 as specified in the text. Assume that λ,θ,γ,ψ,π ≥ 0 are the Lagrangian parameters for each constraint in the order they are listed in P 1. The Kuhn-Tucker conditions are twofold: (1) a nonbinding constraint implies that its corresponding parameter is zero—call it KT1; (2) a positive parameter implies that the constraint is binding—call it KT2. Forming the Lagrangian and deriving the first-order conditions with respect to a,d, and s yield


I do not solve the problem for all possible equilibria, but for one only, the mixed-incentive equilibrium.Footnote 69 A mixed-incentive equilibrium by definition is of the form a,d,s > 0, implying by KT1 that γ,ψ,π = 0. These zero values along with FOCd and FOCs imply that λ,θ > 0, in turn yielding by KT2 the following system of three variables and two equations:

Two variables are endogenously determined as a function of a given third. I choose to express both a and s as a function of a given value of d yielding the results listed in proposition (1).
To establish the parametric conditions under which the mixed-incentive equilibrium obtains, subtract FOCd and FOCs and then the result from FOCa. Recalling that γ,ψ,π = 0, the calculation yields the unique circumstances of the mixed incentive equilibrium, 1 = δ + σ; the marginal cost of the positive incentive is equal to the sum of the marginal costs of the negative incentives.
Proposition (2)
The principal now faces N dyads numbered according to the rivalry index z i from 1 to N, such that z 1 = 1, z 2 = 2,…, z N = N. z is distributed over the set (1,N] with
 , the set of positive integers.
Following lemma 1, assume that x and y partition the z segment into three sets, multilateral from 1 to x, multi-bilateral from x + 1 to y, and exclusion from y + 1 to N. A mixed instrument regime in equilibrium must satisfy the following set of inequalities: 1 < x* < y* < N. This requires that x* and y* be internal maxima. Were the principal's objective function continuous, identifying such maxima would directly follow from showing concavity. Since the function is not continuous, additional cases must be considered.
First, I calculate U P in program P N as specified in the text. The summation term is equal to
 . Substituting this expression into U P along with the value for g(x) and rearranging yields


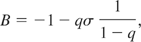


Lemma 2. U P is concave.
Proof. Concavity requires that for any pair of distinct points (x 1,y 1) and (x 2,y 2) in the domain of Û P, and for 0 < θ < 1, the following weak inequality holds: θU P(x 1,y 1) + (1 − θ)U P(x 2,y 2) ≤ U P(θ(x 1,y 1) + (1 − θ)(x 2,y 2)). Developing yields θ(Ax 1 + Bx 12 + Cy 1 + By 12 + E) + (1 − θ)(Ax 2 + Bx 22 + Cy 2 + By 22 + E) ≤ A(θx 1 + (1 − θ)x 2) + B(θx 1 + (1 − θ)x 2)2 + C(θy 1 + (1 − θ)y 2) + B(θy 1 + (1 − θ)y 2)2 + E. Rearranging and simplifying, one obtains θ(1 − θ)B((x 1 − x 2)2 + (y 1 − y 2)2) ≤ 0, which is true since B is negative.
One can now prove proposition (2).
Proof. The principal's problem is to choose x for a given y so that x ∈ S x|y with
 and U P(x|y) ≥ U P(x − 1|y)} and to choose y for a given x so that
 and U P(y|x) ≥ U P(y − 1|x)}, with 1 < x* < y* < N. Consider x first. Define Û P as the principal's objective function U P defined on the continuous domain [1,N] × [1,N]. Define x̂*as the maximum of Û P for a given y. From the definition of U P above,
 while x* ∈ S x|y implies
 .
Four types of solutions are possible:
(i)
and thus x̂* ∈ S x|y. It is unique because x̂* + 1 or x̂* − 1 fall out of the allowed range and do not belong to S x|y.(ii)
and U P([x*]|y) > U P([x*] + 1|y), with [x*] defined as the nearest integer below x̂*: it can be shown that [x*] ∈ S x|y because
on (1,[x*]) implies that U P([x*]|y) > U P([x*] − 1|y). Moreover, there is no other x that meets these conditions. Indeed, assume there exists x′ < [x*] with x′ ∈ Z;
on (1,[x*]) implies that U P(x′|y) < U P(x′ + 1|y).(iii)
and U P([x*]|y) < U P([x*] + 1|y): a reasoning similar to that in (ii) yields [x*] + 1 as the sole maximizer.(iv)
and U P([x*]|y) = U P([x*] + 1|y): this case affords two maximizers,
and
, with
.
 and thus x̂* ∈ S x|y. It is unique because x̂* + 1 or x̂* − 1 fall out of the allowed range and do not belong to S x|y.
 and U P([x*]|y) > U P([x*] + 1|y), with [x*] defined as the nearest integer below x̂*: it can be shown that [x*] ∈ S x|y because
 on (1,[x*]) implies that U P([x*]|y) > U P([x*] − 1|y). Moreover, there is no other x that meets these conditions. Indeed, assume there exists x′ < [x*] with x′ ∈ Z;
 on (1,[x*]) implies that U P(x′|y) < U P(x′ + 1|y).
 and U P([x*]|y) < U P([x*] + 1|y): a reasoning similar to that in (ii) yields [x*] + 1 as the sole maximizer.
 and U P([x*]|y) = U P([x*] + 1|y): this case affords two maximizers,
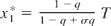 and
 , with
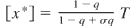 .
Similar reasoning for y*|x yields
 ,
 , and four different cases.
Furthermore, assuming the particular case in which
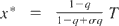 and
 , equilibrium values x* and y* must satisfy 3 constraints:



Comparative Statics
Despite discontinuity, comparative statics is possible on U P because it is monotonic in all its parameters.
 ;
 .
 ;
 .
 ;
 .
 ;
 if the sum of the marginals on the delivered incentives is greater than the sum of the marginals on the threats (1 + ρ ≥ δ + σ).
 ;
 , with
 if
 and
 otherwise.
 ;
 .
 ;
 , with
 .
 ;
 .
List of variables