Introduction
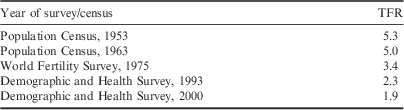
Many of the developed countries in the world completed the demographic transition in the early 20th century, whereas the developing countries only started the transition in the late 1950s. Japan is reported to be the first country to experience fertility decline in Asia; it completed the transition and achieved replacement level fertility by the mid-1970s (Gubhaju, Reference Gubhaju2006; McDonald, Reference McDonald2008). Then, other Asian countries such as Singapore, Taiwan, South Korea, China, Thailand and Sri Lanka started to experience a rapid demographic transition. Sri Lanka is cited as the first country to achieve replacement level fertility in South Asia (Department of Census and Statistics, 2014; De Silva, Reference De Silva2015). The Total Fertility Rate (TFR) in Sri Lanka declined from 5.3 children per woman in 1953 to 1.98 children per woman in 2000. However, in the first decade of the 21st century a slight increase in the TFR, to 2.3 in 2006/2007 and 2.4 in 2012, was observed (Department of Census and Statistics, 2009, 2014). Demographers have also been debating whether this tempo shift is a post-war or post-tsunami effect, or due to changes in fertility intention among younger and older cohorts (De Silva, Reference De Silva2015; Dissanayake, Reference Dissanayake2016; Maheswaran & Perera, Reference Maheswaran and Perera2012).
The theoretical and empirical literature on fertility transition in developing countries has demonstrated a number of socio-demographic, economic, political and cultural factors that have significantly contributed to the fertility transition. The ‘inter-generational wealth flows theory of fertility decline’ posits that transition from high to low fertility is the result of a change in family structures from upward to downward wealth flows (Caldwell, Reference Caldwell1980, Reference Caldwell1982). In this context, the changing economic value of children is considered to be a key factor in fertility decline. In traditional societies families required many children as they were a source of income and had high economic value. Over the decades, with the improvement of social and economic conditions in many societies, parents have started to invest in the human resource development of their children, expecting high quality children rather than high quantity. In addition, factors such as improvements in child survival, life expectancy, mass education and female labour force participation, and a rise in the status of women within the family, have played a crucial role in reducing fertility in many Asian countries (McDonald, Reference McDonald2000; Dissanayake, Reference Dissanayake1996; Bongaarts, Reference Bongaarts2003).
Fertility transition can also be explained in terms of a supply and demand framework and diffusion of innovations. The spread of information and new ideas makes it possible to use highly effective modern contraceptive methods and helps people engage in safe sexual activity, thereby reducing unwanted childbirths. Furthermore, in many contexts, planning programmes have been implemented by governments under maternal and child health programmes that have had a considerable impact on reducing fertility. Thus the regulation of fertility and use of modern contraceptive methods have become accepted as a ‘social norm’ by societies. In many developing countries, there is empirical evidence that a combination of these factors resulted in a decline in fertility to replacement level or below during the second half of the 20th century (Abeykoon, Reference Abeykoon2000; Gubhaju, Reference Gubhaju2006).
The main objective of this study was to explore fertility transition and its dynamics in Sri Lanka in order to understand whether the recent increase in fertility reflects a temporary or long-term phenomenon by identifying significant predictors of fertility in Sri Lanka. The study aimed to examine factors associated with the fertility increase during the first decade of the 21st century and used logistic regression models to understand the predictors of future fertility intentions of married women in the country.
Methods
The study was based on data obtained mainly from secondary sources such as the Sri Lankan Population and Housing Censuses (SLPHC) and Sri Lankan Demographic and Health Surveys (SLDHSs) of Sri Lanka. In addition, published data from the World Fertility Survey (1975 WFS), Sri Lanka Contraceptive Prevalence Survey (1982 SLCPS) and Sri Lanka Contraceptive Survey (1985 SLCS) were used. The SLDHS has been conducted by the Department of Census and Statistics since 1987, and has collected fertility data on actual number of children, desired number of children and sex preferences of children for women aged 15–49 at the time of the survey. However, there are several limitations to be considered when interpreting the data gathered through the SLDHS as the survey questions focus only on individual women’s fertility intentions while ignoring factors such as husband’s or family desires, community desires and social or cultural pressures, which may have a key influence on fertility decisions. In addition, the SLDHS conducted between 1987 and 2006/07 excluded seven districts due to civil disturbances in the northern and eastern parts of the country. The SLDHS data for 2006/07, which are the latest, were used to analyse the pattern and determinants of fertility among ever-married women. The survey used a multi-stage, stratified sampling design and covered 19,872 households and 14,692 ever-married women aged 15–49 years.
In order to understand fertility preferences, in the 2006/07 SLDHS ever-married women were asked the total number of children that they would like to have, if they were to start childbearing afresh. These data were used to predict future fertility intentions among married women in Sri Lanka. A binary logistic regression model was used to identify predictors of preferred family size:
 $${{P}} \left( {{Y}} \right){\equals}{{{{e}} ^{{{{b}} _{0} {\plus}{{b}} _{1} {\rm }{{x}} _{1} {\plus}{{b}} _{2} {\rm }{{x}} _{{2{\plus}\,\ldots\,{\plus}}} {{b}} _{{{n}} } {\rm }{{x}} _{{{n}} } }} } \over {1{\plus}{{e}} ^{{{{b}} _{0} {\plus}{{b}} _{1} {\rm }{{x}} _{1} {\plus}{{b}} _{2} {\rm }{{x}} _{{2{\plus}\,\ldots\,{\plus}}} {{b}} _{{{n}} } {\rm }{{x}} _{{{n}} } }} }}$$
The dependent variables chosen for the analysis were: the ideal number of children, which was recorded as 1, 2, 3, up to 15, constructed as a categorical dummy. If the answer was 0, l or 2 they were considered as women who prefer small families (considering replacement level 2.1) and was coded as ‘0’, and if women preferred 3 or more children they were coded as ‘1’.
Results
Demographic transition and fertility decline in Sri Lanka
Sri Lanka’s demographic transition has been cited as unique as the country experienced rapid transition during the period 1920–2000 as a result of social development, but under conditions of low economic development (Caldwell, Reference Caldwell1996; Abeykoon, Reference Abeykoon2006; De Silva et al., Reference De Silva, Perera and Anuranga2010). During the first phase of the demographic transition, before the 1920s, the Crude Birth Rate (CBR) and Crude Death Rate (CDR) were around 40 and 25 per thousand of the population, respectively. A gradual decline in the CDR was observed in the second phase of the transition, from 1920 to 1950, reporting 12 deaths per thousand persons but CBR remained at a high level of 37 per thousand of the population, and the population grew by more than 2% per annum during this period. The third phase of the transition occurred from 1960 to 2000, with a steady decline in birth rates reaching below replacement level fertility and a decline in the CBR from 36.6 to 18 per thousand of the population (Department of Census and Statistics, 2009; De Silva, Reference De Silva2015). Similarly, the TFR also decreased, from 5.3 in 1953 to around 1.9 in 2000, as presented in Table 1.

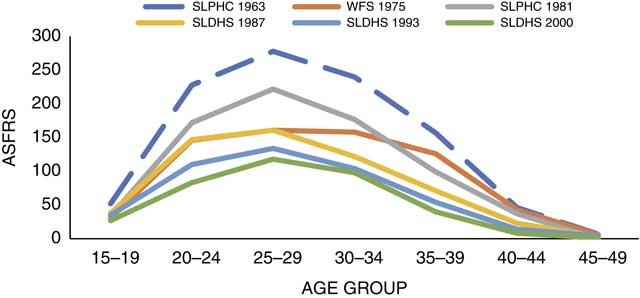
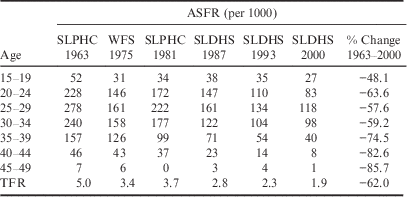
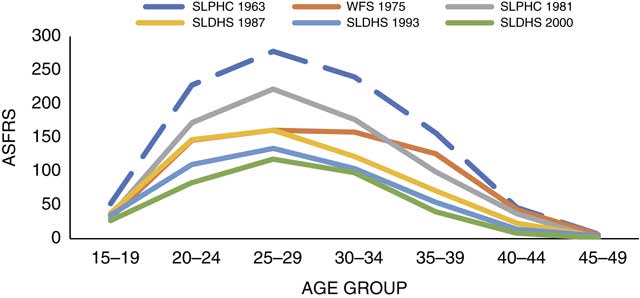
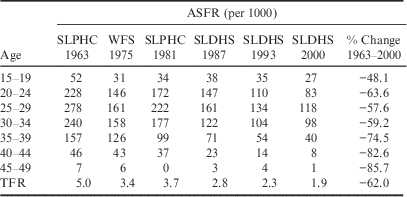
The fertility transition began in Sri Lanka during the early 1960s, and from then up until the year 2000 the county experienced a steady decline in fertility, indicating changes in the level and pattern of fertility. The trends in the Age-Specific Fertility Rates (ASFRs) and Total Fertility rate (TFR) during the period 1963 to 2000 are shown in Table 2. It is evident that there was a significant decline in ASFRs in all age groups. The data further show that both younger and older cohorts experienced a marked decline in fertility during the period 1975 to 2000. As a result, the TFR fell by 62% during the period 1963–2000. The age pattern of fertility in Sri Lanka shows that the ASFRs increased in the age groups 15–19 and 20–24, peaked in the age group 25–29 and started a gradual decline after age 30–34 with the declining fecundity of women. No change was observed in the age pattern of Sri Lankan fertility during this period (Fig. 1).
Age pattern of fertility in Sri Lanka, 1963–2000.
Factors affecting the fertility decline in Sri Lanka
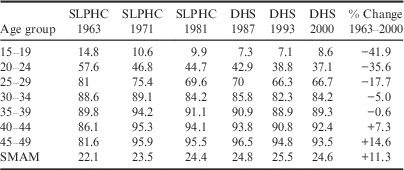
Fertility decline in Sri Lanka was found to be associated mainly with four proximate determinants of fertility: proportion married, use of contraception, postpartum factors and incidence of abortions. In addition, several other contextual factors, including women’s education, women’s employment participation, infant and child mortality, availability of free health service and cultural factors, have made a significant contribution to reducing fertility in Sri Lanka. As in many Asian societies, in Sri Lanka marriage is considered to be a significant point in a woman’s life when childbearing becomes socially acceptable. Age at first marriage has a major effect on childbearing because women who marry early have, on average, a longer period of exposure to the risk of becoming pregnant and a greater number of lifetime births. Table 3 shows that the Singular Mean Age at Marriage (SMAM) increased steadily from 22.1 years in 1963 to 24.6 years in 2000, an overall 11.3% increase over the period, thus contributing to the fertility decline in Sri Lanka. Similarly, the percentage of ever-married women also reduced in all age groups from 15–19 to 35–39 years, but not in the 40–44 and 45–49 age groups, and this decrease was particularly observed between 1963 and 2000 due to an increase in female education and female labour force participation in the country. The percentage of women aged 15–19 who had ever married decreased from 14% in 1963 to 8.6% in 2000, a decrease of 42% (Table 3).
Percentage of ever-married women and Singulate Mean Age at Marriage (SMAM), 1963–2000
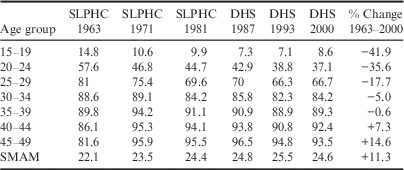
Sources: Abeykoon (Reference Abeykoon2006); Department of Census and Statistics (2002, 2009).
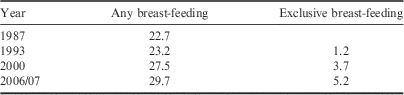
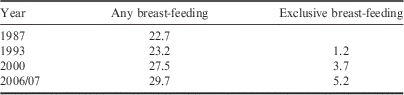
In addition to age at first marriage and proportion ever-married, a woman’s exposure to the risk of pregnancy is influenced by postpartum factors, particularly duration of breast-feeding. Table 4 presents data on the mean duration of breast-feeding for the period 1987–2000. The mean duration of breast-feeding increased from 22.7 months in 1987 to 27.5 months in 2000, and the mean duration of exclusive breast-feeding increased from 1.2 months in 1993 to 3.7 months in 2000. Abeykoon (Reference Abeykoon2006) found that the higher the mother’s education level, the greater the duration of exclusive breast-feeding in Sri Lanka.
It is difficult to measure the effect of induced abortions on fertility decline as abortions are illegal in Sri Lanka. Thus there is lack of reliable data on the incidence and rates of induced abortions. Nevertheless, De Silva (Reference De Silva1997) estimated that about 125,000 to 175,000 induced abortions are performed annually. Rajapaksha estimated in 2000 that 658 induced abortions took place each day, and the abortion ratio was 741 per 1000 live births (Rajapaksha, Reference Rajapaksha2000). The incidence of induced abortions had an increasing trend during the period 1990–2000, and thereafter gradually declined to a lower level (Abeykoon, Reference Abeykoon2009).
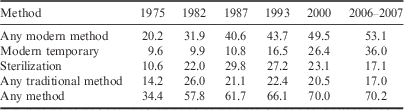
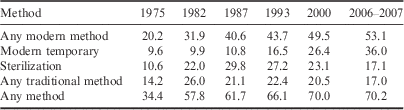
The use of contraception has also been a key determinant of fertility decline in Sri Lanka over the past decades. The contraceptive prevalence rate (the proportion of currently married women of reproductive age, 15–49 years, who currently use any method of contraception) in Sri Lanka increased from 34% in 1975 to 70% in 2000. It is evident that over the years there has been an increase in the use of all methods of contraceptives, while the use of traditional methods has declined. In 2006/07 the SLDHS also reported that more than half of currently married women used modern methods (Table 5). The current use of modern temporary contractive methods among currently married women increased from 9.6% in 1975 to 36.0% in 2006/07.
In 1965, the key policy decision taken by the Sri Lanka government to incorporate the national family planning programme into maternal and child health care services significantly contributed to the decline in fertility. The effect of each proximate variable on fertility was examined for the year 2000 by Abeykoon (Reference Abeykoon2006), who found that around 33% of the fertility preventing effect was due to the increase in age at marriage, while another 34% was due to increased contraception use. The effects of postpartum and induced abortion variables on fertility in 2000 were found to be about 31.5% and 1.5%, respectively (Abeykoon, Reference Abeykoon2006). Furthermore, below replacement level fertility was achieved through programme and non-programme factors that were in operation in Sri Lanka during the period 1963–2000, and which facilitated the development of the social environment (Abeykoon, Reference Abeykoon2000, Reference Abeykoon2006). Sri Lanka’s government, in its policy statement issued in 1991, set a target of achieving replacement level fertility (TFR 2.1) by the year 2000. Sri Lanka is the only country in the South Asian region that achieved replacement level fertility before the end of the last century. Furthermore, several other significant factors such as enhancing social conditions, social interactions, the spread of information and institutional change, followed by changes in reproductive values and behaviours, explain the fertility transition in Sri Lanka.
Recent fertility increase in Sri Lanka
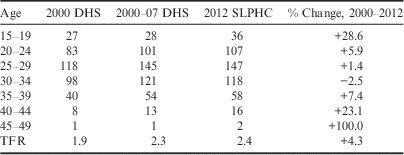
Data from the 2006/07 SLDHS and 2012 Population Census demonstrate that a significant fertility increase has occurred in almost all age groups in Sri Lanka. However, the ASFRs for the periods 2000–2007 and 2007–2012 confirm that teenage fertility (15–19 years) and older women’s fertility (35–39 and 40–44 years) increased over the period, which contributed to transforming the country’s fertility from below replacement level to above replacement level. The age patterns of fertility reported in the 2000 SLDHS and subsequent SLDHS and SLPHC are shown in Table 6. It is evident that the ASFRs increased in almost all age groups (except 30–34 years) during the period 2000–2012. It is also interesting to note that teenage fertility (15–19 years) increased by 28.9% while women in older reproductive age groups (40–44 and 45–49) showed an increase in the ASFRs of 23.1% and 100% respectively (Table 6). Consequent to this reversed trend, it is vital to address current needs and attitudes towards family planning and how they are responding to the post-tsunami and post-war period. Teenage fertility is higher, which may be due to a transition in social values and adolescent behaviour. Although abortion is illegal in Sri Lanka, the crackdown on illegal facilities has also contributed (De Silva, Reference De Silva2015). Increasing pressure by socio-political and religious groups against family planning has been observed.
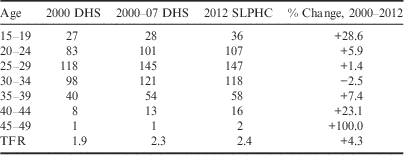
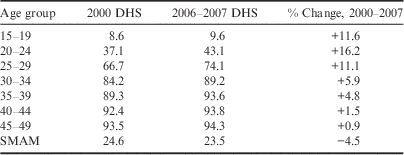
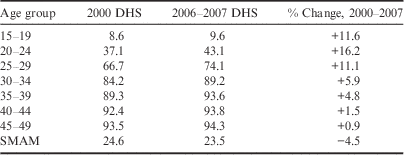
The recent increase in fertility can also be explained through an increase in the percentage of ever-married women observed between 2000 and 2006/07 (Table 7). Furthermore, a reduction in the age at marriage has also affected the increase in recent fertility.
Fertility preferences in Sri Lanka
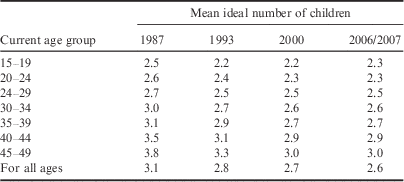
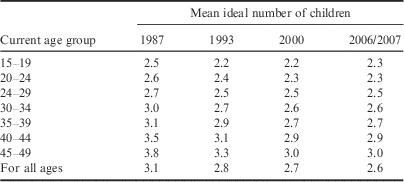
The recent fertility increase can also be explained by married women’s fertility desires. The mean ideal number of children of women by their number of living children is reflected to some extent in the fertility preferences. Table 8 presents the mean ideal number of children for ever-married and currently married women by their number of living children, as reported in the 2006/07 SLDHS. It shows the high fertility preferences for both ever-married and currently married women observed among those who had 2 or fewer living children. In contrast, women who had 4 or more living children reported a lower mean ideal number of children than the number of living children that they had reported having. Table 9 presents the mean ideal number of children for ever-married women by their current age as reported in the 1987, 1993, 2000 and 2006–07 SLDHS, and also depicts that fertility had decreased in almost all age groups over these three decades.
Mean ideal number of children by number of living children, 2006/07

Source: Department of Census and Statistics (2009).
The fertility preferences of Sri Lankan women have been captured in several surveys since 1975. The findings across surveys reflect reproductive preferences and norms pertaining to a particular period. The World Fertility Survey (WFS), conducted in 1975, found that the mean ideal family size was 2.4, but for women who had 2 or fewer children the mean was 2.5, and for women with 3 or more children the mean was 3.8 (Pullum, Reference Pullum1980). It was also found that Moors had higher fertility preferences than other ethnic groups. Furthermore, if the child sex preference was balanced (i.e. they had at least one daughter and one son), women seemed to be satisfied with the sex composition of their children. Similar patterns have been identified in subsequent surveys (De Silva, Reference De Silva1995, Reference De Silva2015; Department of Census and Statistics, 2009). Women play a significant role in fertility decision-making in Sri Lanka. This was shown in a longitudinal study based on two surveys – the SLCPS conducted in 1982 and the SLCS conducted in 1985. In both surveys the same group of women was interviewed on their fertility intentions and it was found that over 65% of those who wanted one or more children were found to have had the expected number of children during the inter-survey period. Thus, it can be concluded that the fertility intentions of Sri Lankan women were at least moderately predictive of their future fertility (De Silva, Reference De Silva1995). The significant segment of fertility decline in Sri Lanka occurred among women below 30 years of age as a result of the deliberate desire of younger women to limit their number of children to around two (Abeykoon, Reference Abeykoon2001).
Research on the fertility preferences of women in several contexts has shown that their fertility intentions are influenced by demographic, socioeconomic and programme factors. The fertility intentions of women vary with the age of women, number of living children, place of residence, education, exposure to media and values and attitudes towards a large or small family. In some countries, a significant proportion of women report bearing more children than they want, and also the level of unwanted childbearing has been reported to vary over the course of the fertility transition (Bongaarts, Reference Bongaarts1999, Reference Bongaarts2010). A significant relationship between education and fertility preferences has also been observed in some developing countries. Evidence indicates that when the number of years women have been in education increases, their age at marriage also increases, along with their contraceptive use, and this lowers their fertility preferences and number of childbirths (Cleland & Germán, Reference Cleland and Rodríguez1988; Bongaarts, Reference Bongaarts2010). The current age of women also affects their fertility preferences, as observed from the SLDHS data. Table 6 presents the mean ideal number of children for ever-married women by their current age reported by surveys performed in 1987, 1993 and 2000. It is clear that when women move to higher age groups their fertility preferences change. Women aged 15–19 in 1987 were in the age group 20–24 in 1993. In 2000 – that is 7 years later – more than half of the women in age group 20–24 would be in the age group 25–29. Similarly, 45–49 cohorts in 2000 belonged to the 25–29 cohorts in 1987. The younger age cohorts preferred small families than the older age cohorts of women.
Fertility differentials and factors affecting fertility preferences in Sri Lanka
Significant variations in fertility were observed across districts. In 2012, the districts of Colombo, Jaffna and Gampaha reported the lowest fertility (TFR=2.0), which was below replacement level, while all other districts reported above replacement level fertility. The highest TFRs were reported in Trincomale (3.02) and Nuwara Eliya (2.83) districts. In addition, ethnic group was also highlighted as an important determinant of fertility increase in Sri Lanka (De Silva, Reference De Silva2015). Indian Tamils and the Sri Lankan Moors have more children (TFR 2.9 and 3.3 respectively) compared with the Sinhalese and the Sri Lankan Tamils, who had a TFR of 2.3 (Department of Census and Statistics, 2015).
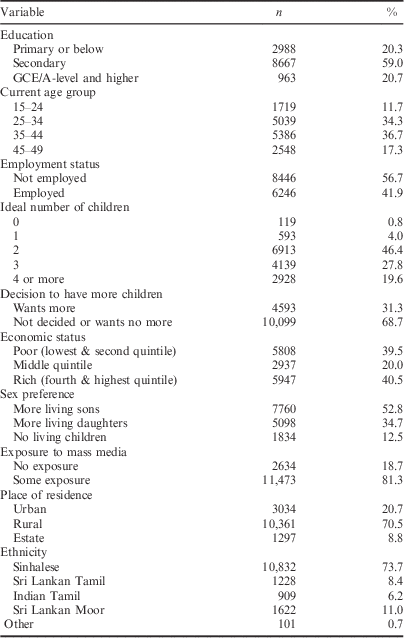
Fertility preferences are determined by a number of demographic, socio-cultural and economic factors. Using data from the 2006/07 SLDHS factors contributing to fertility preference in Sri Lanka were examined. Table 10 depicts the demographic and socioeconomic characteristics of the respondents. Approximately 60% of the women had secondary level education and 20% had primary or below level of education, while the remaining 21% had college level (General Certificate of Education/Advanced Level; GCE/A-level) and higher education. More than half of the married women (56.7%) were not engaged in employment. Nearly half of the women (46.4%) preferred to have 2 children while 27.8% preferred to have 3 children, and one-fifth desired 4 or more children. About two-thirds of the women (68.7%) had decided to have no more children or not decided to have more children, while only about one-third (31.3%) had decided to have more children. About 39.5% were poor and belonged to lowest and second quintiles while 40.5% were rich (fourth and highest quintile). Fifty-three per cent of women had more sons than daughters while 34.7% had more daughters than sons, and only about 12.5% had had no living child. The majority of women (70.5%) lived in the rural sector, while 20.7% lived in urban areas and 8.8% lived in the estate sectors (commercial areas of 20 acres or more employing 10 or more labourers). More than two-thirds of women had exposure to mass media. Ethnicity was used as a proxy variable for cultural background, and it was found that the majority of women (approximately three-quarters) were Sinhalese (73.7%). Nearly a quarter of women belonged to the ethnic groups Sri Lankan Moor (11%), Sri Lankan Tamil (8.4%) and Indian Tamil (6.2%).
Demographic and socioeconomic characteristics of ever-married women

The survey excluded Jaffna, Killinochchi, Mullaitivu, Mannar and Vavuniya districts.
The study sample size was 14,692 ever-married women.
Source: Department of Census and Statistics (2009).
Factors influencing large family
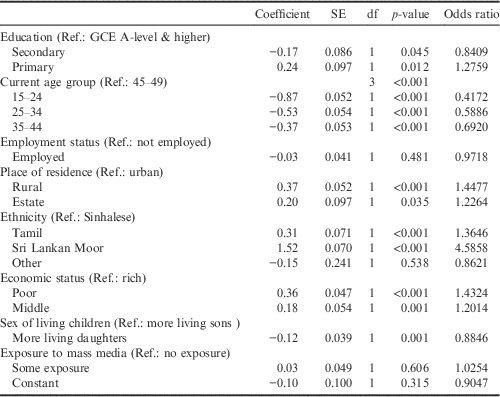
Table 11 describes to what extent the demographic, economic and socio-cultural factors affect the likelihood of having a larger family (3 or more children). When compared with the women with GCE/A-level and higher level education, women with primary education were 1.3 times more likely to prefer a large family. The younger women, when compared with the women who had completed their fertility (age group 45–49), were negatively associated with, and less likely to prefer, a large family. Women who lived in rural and estate sectors were 1.4 and 1.2 times, respectively, more likely to prefer more children when compared with the urban women. Sri Lankan Moor women were 4.5 times more likely to prefer more children when compared with Sinhalese women. Similarly, Tamil women (both Sri Lankan Tamil and Indian Tamil) were also 1.4 times more likely to prefer a large family. The economic status of women also significantly contributed to large families. The poor women were 1.4 times more likely to have a desire for large families compared with the rich women, while the women in the middle quintile were 1.2 times more likely to desire more children. The women who had more sons than daughters were less likely to desire large families.
The effect of demographic, economic, socio-cultural factors on the desire for a large family

Model χ 2 value is 1140.4.
Discussion and Conclusion
The Sri Lankan fertility transition experience has unique features and the country was the first country in South Asia to achieve replacement fertility, in the later part of the last century. Sri Lanka has undergone an increase in fertility in recent years. The fertility transition from 5.3 children per woman in 1953 to 1.98 children per woman by 2000 was a somewhat rapid process, and social and health factors have played a key role. It is evident that an increase in years of female education, increase in age at marriage and successful implementation of effective family planning and maternal and child health programmes throughout the country have been significant factors that have contributed to bringing down the country’s fertility to below replacement level by 2000.
The recent fertility experience of an upward trend, resulting in a TFR of 2.4, has been explained through different scenarios. One is the effect of the tsunami disaster that took place in 2004 and its post-disaster effect on fertility. Another is the ending of the 30-year civil war or the post-war effect on reporting fertility data of women, especially those living in the war-affected areas in the northern and eastern districts of Sri Lanka. Also, there has been a pro-natalist atmosphere, whereby families have been encouraged to have more children, especially among minority ethnic groups. In addition, the weakening of Sri Lanka’s family planning programmes after 2000 has resulted in an increase in both young and older women’s fertility (age groups 15–19, 35–39 and 40–44).
Furthermore, this study’s logistic regression analyses have shown that the fertility decisions and preferences for large families among Sri Lankan women are mainly determined by demographic, socio-cultural and economic factors. It was found that, compared with women with a higher level education, women with only primary level education were more likely to prefer large families. This relationship has been established in previous studies in many developing countries. This may be due to the fact that higher educated women marry later, have more knowledge about reproductive health and have access to contraceptives and use them effectively. In addition, more educated women have greater autonomy in reproductive decision-making compared with less-educated women. Similar findings were made by Bongaart (Reference Bongaarts2010) in sub-Saharan Africa; he found that education levels were positively associated with demand for, and use of, contraception and negatively associated with fertility and desired family size.
Compared with the urban women, women from rural and estate sectors in Sri Lanka were more likely to have more children. The most acceptable explanation for this that urban exposure encourages women to decide and act more independently than rural and estate women. Moor women preferred more children and they were more likely to decide to have additional children compared with Sinhalese women, and this finding is supported by previous studies (Pullum, Reference Pullum1980; De Silva, Reference De Silva1995).
Sri Lanka’s fertility patterns and preferences described in this study should be discussed considering its current socio-demographic structure. The current population of 22 million comprises a large working age population (about 54%) compared with younger and older population groups, and the country is thus experiencing a ‘demographic dividend’. Also, the country has been experiencing an ageing of its population and projections show that a quarter of the population will be aged 60 years and older by the year 2041. After four decades of fertility decline reaching replacement level, the recent experience of a reversal in this trend could have a negative impact in terms of increasing dependants in young and old aged population in the future. The fertility increase and its negative impact may trigger a decrease in the rate of female labour force participation rates, currently about 35% in Sri Lanka. However, the increase in fertility could be considered to be a temporary phenomenon if issues related to female employment participation, family planning programmes, women empowerment and ensuring their reproductive rights are addressed. The promotion of dynamic job opportunities with flexible working hours, facilitation of women working from home and providing quality childcare facilities would increase female labour force participation of the country. Future family planning programmes should be more focused on addressing unmet need for family planning among teenagers (15–19 years) as well as older women (40–44 and 45–49). The results further suggest that Sri Lanka needs to re-visit its population and reproductive health policy and family planning programmes to see how it can better manage fertility among all its population and ethnic groups.
Acknowledgment
The author would like to thank the Department of Census and Statistics of Sri Lanka for granting permission to use data from the SLDHS 2006–2007.