Implications
Present study investigated the impact of using a mathematical model estimating real-time daily lysine requirements in a sustainable precision-feeding program for growing pigs. Results clearly indicate that this is an effective approach for reducing nutrient intake, nutrient excretion and feeding costs. Feeding pigs individually with daily tailored diets that provide 100% of estimated requirements can reduce lysine intake by 26% and nitrogen excretion by 30% without compromising the pig performance. The proposed precision-feeding system represents a paradigm shift in pig production, as it takes into account between-animal differences in nutrient requirements within a population and their dynamic evolution over time.
Introduction
Conventional feeding programs are designed to maximize animal performance by providing a single feed to all the pigs in the herd for a certain period of time. However, pigs’ nutritional requirements change dynamically during the growing period and also vary greatly among individuals, even in age- and sex-homogeneous populations (Pomar et al., Reference Pomar, Jondreville, Dourmad and Bernier2003; Brossard et al., Reference Brossard, Dourmad, Rivest and van Milgen2009). By disregarding these variability issues, conventional group phase-feeding programs lead to inappropriate nutrient supply, usually with diets formulated to satisfy the requirements of the most demanding pigs (Hauschild et al., Reference Hauschild, Lovatto, Pomar and Pomar2010).
Multi-phase group-feeding systems allow feed composition to be adjusted over time to better match the evolution of the population’s nutrient requirements (Niemi et al., Reference Niemi, Sevón-Aimonen, Pietola and Stalder2010), particularly when diets are updated daily. The economic and environmental advantages of this method were demonstrated previously (Bourdon et al., Reference Bourdon, Dourmad and Henry1995; Pomar et al., 2014Reference Pomar and Rivesta). In addition to this adjustment over time, it is important to take into account the variability among individuals within a given population. Although dealing with the individual variability in nutritional requirements is a difficult task, precision farming techniques may provide a solution (Wathes et al., Reference Wathes, Kristensen, Aerts and Berckmans2008). Precision feeding arises in this context as a tool that aims to make pig production systems more sustainable by providing feed with the exact nutrient composition at the right time to each individual according to its pattern of feed intake and growth (Pomar et al., Reference Pomar, Pomar, Dubeau, Joannopoulos and Dussault2010).
The results of previous evaluations of precision feeding are very promising (Pomar et al., Reference Pomar, Pomar, Dubeau, Joannopoulos and Dussault2010 and Reference Pomar and Rivest2014a; Andretta et al., Reference Andretta, Pomar, Rivest, Pomar, Lovatto and Neto2014) and only a few trials have been conducted to assess the use of this new approach. The current study was therefore performed to evaluate, in terms of pig performance, nutrient balance, serum parameters and feeding costs during the growing–finishing period, the impact of switching from conventional feeding to precision-feeding (multi-phase) systems in which pigs were fed individually with daily tailored diets.
Material and methods
Animals, housing and management
A total of 70 pigs (35 females and 35 barrows) of the same high-performance genotype (Fertilis 25×G Performer 8.0; Genetiporc Inc., Saint-Bernard, QC, Canada), in absence of clinical signs of diseases were shipped in a single batch to Agriculture and Agri-Food Canada’s Dairy and Swine Research and Development Centre, in Sherbrooke, QC, Canada. The pigs had free access to feed and fresh water throughout the experiment and were cared for in accordance with a recommended code of practice (Agriculture and Agri-Food Canada, 1993) and the guidelines of the Canadian Council on Animal Care (2009).
The pigs were fed a commercial starter diet for 2 weeks before the experiment, and then the animals were randomly assigned to the experimental treatments at 30.4±2.2 kg BW. The pigs were housed in a single 48 m2 pen with a fully slatted floor in a mechanically ventilated room. On the 42nd day of the performance trial, the pen area allowance was adjusted to 96 m2 to meet the space requirements for finishing pigs. The room temperature was progressively decreased from 22°C when the pigs arrived to 18°C when the pigs reached around 100 kg BW, thus ensuring thermoneutral conditions.
Water was provided with low-pressure nipple drinkers, and feed was provided individually with five feeding stations (Automatic and Intelligent Precision Feeder; University of Lleida, Lleida, Spain). The functioning of these feeders was described previously (Pomar et al., Reference Pomar, Pomar, Rivest, Cloutier, Letourneau-Montminy, Andretta and Hauschild2011; Andretta et al., Reference Andretta, Pomar, Rivest, Pomar, Lovatto and Neto2014). Briefly, the feeding stations identify each pig when its head enters the feeder, and deliver, in response to each animal request, a blend of feeds A and B containing the estimated concentration of lysine required by this pig this day corrected according to the assigned experimental treatment. Pigs tend to empty the feeder hopper or leave only very small amounts of feed behind at each visit, providing assurance that each pig received the assigned amount of blended feeds. The feeder calibration (matching between registered and provided amounts of feed) was checked weekly. The automatic and intelligent precision feeders were designed to provide each pig with the required feed blend, and this feature allowed all animals in the trial to be housed in the same pen.
Diets and feeding
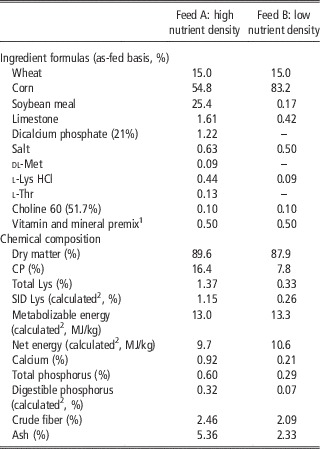
Two experimental feeds (named A and B) were independently formulated on the basis of net energy (NE) and standardized ileal digestible (SID) amino acids, using the same ingredient composition database, without any energy constraint and with no growth promoters or any other additives (Table 1). Feed A had high nutrient density level given that they were determined for the most demanding pigs at the beginning of the first growing period, whereas feed B had a low nutrient density level given that they were estimated for the less demanding pigs at the end of the last growing period following the National Research Council (NRC) (2012) recommendations for amino acid profile and Jondreville and Dourmad (Reference Jondreville and Dourmad2005) for digestible phosphorus. The ratio between calcium and digestible phosphorus was 2.9 : 1 in both feeds, as suggested by Jongbloed et al. (Reference Jongbloed, Everts, Kemme and Mroz1999). Vitamins and micro mineral additions were kept similar between feeds. Feeds were presented in steam-pelleted form. The appropriate final feed composition was obtained by blending the two feeds at each pig visit to the feeder, thus creating a complete feed with the desired estimated lysine concentration.
Ingredient formulas and chemical composition of experimental feeds

SID=standardized ileal digestible.
1 Premix should provide at least the following nutrient amounts per kilogram: vitamin A, 456 000 IU; vitamin D, 45 600 IU; vitamin E, 1400 IU; vitamin K, 80 mg; vitamin B12, 1.2 mg; niacin, 800 mg; pantothenic acid, 600 mg; pyridoxine, 80 mg; riboflavin, 120 mg; thiamine, 80 mg; copper, 4.9 g; iodine, 12 mg; iron, 4 g; manganese, 2.5 g; selenium, 12 mg; zinc, 6.1 g.
2 Values for growing pigs were estimated from the gross composition of the ingredients according to EvaPig (Software Version 1.3.1.4, INRA, Saint-Gilles, France).
The performance trial consisted of three feeding phases, each 28 days long. Five feeding programs (treatments) were evaluated in this study. The control treatment consisted of a three-phase feeding program (3P) that provided all the pigs in this group with a fixed blend of feeds A and B within each feeding phase. The blend for each phase was determined during the first 3 days of the phase, so as to satisfy the requirements of the 80th percentile pig in the population and thus to maximize population BW gain (Hauschild et al., Reference Hauschild, Lovatto, Pomar and Pomar2010). Only data collected in pigs assigned to this control treatment was used for these calculations.
The pigs assigned to the different multi-phase treatments were fed a blend of feeds A and B that was adjusted daily to match 110% (MP110), 100% (MP100), 90% (MP90) or 80% (MP80) of the estimated nutrient requirements of each individual pig. The required concentration of lysine was estimated individually for each pig in all treatments with a previously described mathematical model (Hauschild et al., Reference Hauschild, Pomar and Lovatto2012) using individual daily feed intake and the weekly BW information. In this model, the empirical component estimates the expected BW, feed intake and daily gain for the next day, whereas the mechanistic component uses these three estimates to calculate, with a factorial method, the optimal concentration of amino acids that should be offered that day to each pig in the herd so as to meet their requirements. In this mechanistic component of the model, daily lysine requirements (g/day) were calculated by adding together the maintenance and growth requirements. Daily maintenance lysine requirements were estimated by adding together basal endogenous losses (0.313 g lysine/kg dry matter×daily feed intake), losses related to desquamation in the digestive tract (0.0045 g lysine/kg0.75 per day×BW0.75) and losses related to basal renewal of body proteins (0.0239 g lysine/kg0.75 per day×BW0.75) (van Milgen et al., Reference van Milgen, Valancogne, Dubois, Dourmad, Sève and Noblet2008). The SID lysine requirements for growth were calculated assuming that 7% of body protein is lysine (Mahan and Shields, Reference Mahan and Shields1998) and that the efficiency of lysine retention from dietary digestible lysine is 72% (Möhn et al., Reference Merkatoris, Rortvedt and Crenshaw2000). The protein content in live weight gain was predicted using a regression equation empirically obtained with data collected in previous studies in which body lean mass was measured by dual-energy X-ray absorptiometry (DXA). In all the previous studies, daily feed-intake records were available for each pig and individual body composition was estimated at the beginning and at the end of each feeding period. The amount of protein contained in the BW gain of each pig was estimated by regression analysis relating within each feeding period the observed performance variables and the protein content in live weight gain (Rivest J and Pomar C, unpublished data). This method of estimating nutrient requirements has been described previously (Hauschild et al., Reference Hauschild, Pomar and Lovatto2012; Pomar et al., Reference Pomar, López and Pomar2014b) and validated in two previous studies (Zhang et al., Reference Zhang, Pomar, Pomar and Del Castillo2012; Cloutier et al., 2014).
Performance and body composition
The pigs were weighed individually on conventional scales at arrival, twice during the pre-experimental phase and weekly during the trial. At the beginning of each feeding phase (on days 0, 28 and 56) and at the end of the performance trial (on day 84), back fat thickness and loin muscle depth were measured using a B-mode ultrasound device (Ultrascan 50, 120 mm/3.5 MHz transducer; Alliance Médicale Inc., Montreal, QC, Canada) between the third- and fourth-last ribs at 5 cm from the midline. Total body fat, lean, bone mineral content and bone mineral density were measured by DXA on days 0, 28, 56 and 84 with a densitometry device (GE Lunar Prodigy Advance; GE Healthcare, Madison, WI, USA). The pigs were scanned in prone position using the total body scanning mode (GE Lunar enCORE, version 8.10.027). Anesthesia was induced with sevoflurane (5%) and maintained with isoflurane (4%) during the scans. The DXA body lean and fat mass values were converted to their protein and lipid chemical equivalents, as proposed by Pomar and Rivest (Reference Pomar, Hauschild, Zhang, Pomar and Lovatto1996). Total body phosphorus was estimated assuming that 18% of bone mineral content is phosphorus and that DXA bone mineral content represents 80% of total body phosphorus (Nielsen, Reference Nielsen1973; Merkatoris et al., Reference Möhn, Gillis, Moughan and de Lange2012). Nitrogen and phosphorus excretion values were obtained for each pig by subtracting the respective nutrient retention from the respective nutrient intake values. Nutrient efficiencies were calculated by dividing the gain of protein (estimated using the values obtained by DXA) or lysine (estimated assuming that 7% of body protein is lysine) by the CP or SID lysine intake, respectively.
Blood sampling
On days 0, 28, 56 and 84, blood samples (around 20 ml/pig) were collected via anterior vena cava puncture in heparinized tubes and stored on ice. After collection, the plasma was separated by centrifugation (15 min, 4°C, 2990 r.p.m.) (accuSpin 1R Centrifuge; Thermo Fisher Scientific, Waltham, MA, USA) and then stored at −20°C until analysis.
The animals were not fasted before blood collection, so that feeding behavior and performance data would not be altered. This procedure without fasting is based on the fact that blood sampling at any time reflects average plasma urea concentrations for the whole day period in pigs with free access to feed (Cai et al., Reference Cai, Zimmerman and Ewan1994), indicating that the specific time of blood sampling is less relevant for pigs in no-meal feeding systems (Zervas and Zijlstra, Reference Zervas and Zijlstra2002). To check a possible effect of fasting state on the responses, correlations between the fasting period (interval calculated individually between blood sampling time and the last registered meal in the computerized feeding system) and plasma responses were studied.
Analytical procedures
Representative samples of the feeds were taken upon delivery and once weekly throughout the experiment. The samples of each feed were mixed together at the end of the experiment to obtain a representative composite sample. The composite samples of feeds were analyzed using Association of Official Analytical Chemists (1990) standard methods for lyophilization (Method 938.18) and for determination of total protein (Method 992.15), lipids (Extraction Method 991.36), dry matter (Method 950.46) and ash (Method 920.153). Calcium concentration was obtained by inductively coupled plasma spectrometry (Method 984.27; ICP-ES PerkinElmer Optima 3000, PerkinElmer, Whaltham, MA, USA), whereas phosphorus concentration was obtained by colorimetric analysis (Method AOAC 995.11; Lambda-35 spectrometer; PerkinElmer). For amino acids (excluding tryptophan), feed samples were ground to pass through a 0.5 mm screen and acid-hydrolyzed with 6 N phenol-HCl for 24 h at 110°C (method 994.12), and amino acid concentrations of the hydrolysates were determined by the isotope dilution method (Calder et al., Reference Calder, Garden, Anderson and Lobley1999) as described by Borucki Castro et al. (Reference Borucki Castro, Phillip, Lapierre, Jardon and Berthiaume2007). Blood concentrations of total protein were determined using enzymatic colorimetric kits (Bicinchoninic Acid Protein Assay Kit, #BCA1 and B9643; Sigma Aldrich, St. Louis, MO, USA), whereas blood urea concentrations were measured with an automatic analyzer (Technicon Autoanalyser II; Technicon Instruments Corporation, Tarrytown, NY, USA) as previously described (Huntington, Reference Huntington1984) on fresh samples on the day of sampling.
Economic evaluation
Feeds A and B were formulated using the least-cost formulation method. For the economic evaluation, the price of each ingredient used in the feeds was determined based on the situation in April 2013 in Quebec, Canada. The feeding cost was obtained individually by multiplying daily intake of ration A and B by the respective feed cost. The feeding cost of total period was divided by total growth to obtain a relativized value. All cost values are expressed in US dollars.
Statistical analysis
Each pig was considered to be an experimental unit. Variables that did not provide normally distributed residuals with the Shapiro–Wilk test (feed efficiency, lean content and bone mineral content) were transformed logarithmically. By means of SAS version 9.2 (SAS Institute Inc., Cary, NC, USA), performance data were submitted to variance analysis to evaluate the treatment effect over time using the MIXED procedure, whereas responses without repetition in time series (e.g. feeding costs) were studied using the GLM procedure. Sex and interactions (treatment×period, treatment×sex, period×sex and treatment×period×sex) were also included in the models. Correlations between the fasting period before sampling and plasma responses were studied.
Results and discussion
Pigs consumed feed and gained weight according to the expected performance of the genotype throughout the entire trial. During the experimental period, no health problems were observed except severe inflammatory foot problems, unrelated to the treatments that were identified in three barrows during the last feeding phase. The animals involved were isolated from the group, and their data were not considered in the analysis. Thus, the information presented in this paper consists of means of 14 pigs per treatment for all treatments except MP110 and MP80, for which the information consists of means of 12 and 13 pigs, respectively.
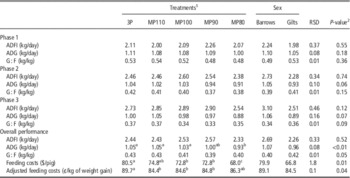
The effect of feeding phase was significant (P<0.05) for all studied responses except plasma content of phosphorus. With respect to the effect of sex, the barrows showed higher (P<0.05) values than the females did for average daily feed intake (ADFI), nutrient intake, average daily weight gain (ADG), BW, back fat thickness, protein mass, lipid mass, bone mineral density, bone mineral content, nutrient retention, nutrient excretion and feeding costs across feeding phases (Tables 2 to 4). The sex effect was, however, not significant for feed efficiency (G : F), loin muscle depth or any plasma response (Table 5). The sex×treatment interaction was not significant for any of the studied variables and therefore, only the across-sex-pooled means by treatment are presented in this paper.
Performance of pigs in a three-phase feeding program (3P) or in daily-phase feeding programs provided individually to meet 110% (MP110), 100% (MP100), 90% (MP90) or 80% (MP80) of the estimated nutritional requirements

ADFI=average daily feed intake; ADG=average daily weight gain; G : F=feed efficiency.
1 Data are means of 14 pigs per treatment for all treatments except MP100 and MP80, for which the data are means of 12 and 13 pigs, respectively.
2 Treatment effect (T). Statistical models also included: period (P), interaction treatment×period (T×P), sex (S), interaction treatment×sex (T×S), interaction period×sex (P×S) and interaction treatment× period×sex (T×P×S) per variable. ADFI: P<0.01, T×P=0.12, S<0.01, T×S=0.51, P×S<0.01, T×P×S=0.04; ADG: P<0.01, T×P=0.70, S<0.01, T×S=0.45, P×S<0.01, T×P×S=0.87; G : F: P<0.01, T×P=0.88, S=0.13, T×S=0.90, P×S=0.58, T×P×S=0.15; feeding cost: S=0.01, T×S=0.68; adjusted feeding costs: S=0.03, T×S=0.63.
a,b,cValues within a row with different superscripts differ significantly at P<0.05 according to Tukey’s test.
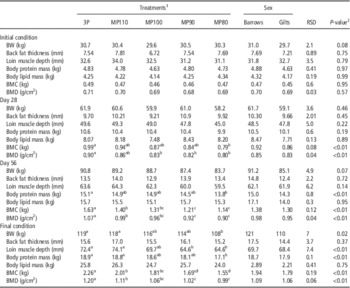
BW and body composition of pigs in a three-phase feeding program (3P) or in daily-phase feeding programs provided individually to meet 110% (MP110), 100% (MP100), 90% (MP90) or 80% (MP80) of the estimated nutritional requirements

BMC=bone mineral content; BMD=bone mineral density.
1 Data are means of 14 pigs per treatment for all treatments except MP100 and MP80, for which the data are means of 12 and 13 pigs, respectively.
2 Treatment effect (T). Statistical models also included: period (P), interaction treatment×period (T×P), sex (S), interaction treatment×sex (T×S), interaction period×sex (P×S) and interaction treatment×period×sex (T×P×S) per variable. BW: P<0.01, T×P<0.01, S<0.01, T×S=0.19, P×S<0.01, T×P×S=0.59; back fat thickness: P<0.01, T×P=0.86, S<0.01, T×S=0.68, P×S<0.01, T×P×S=0.71; loin muscle deep: F<0.01, T×P=0.16, S=0.75, T×S=0.24, P×S=0.61, T×P×S=0.29; body protein mass: F<0.01, T×P<0.01, S<0.01, T×S=0.45, F×S<0.01, T×P×S=0.74; body lipid mass: P<0.01, T×P=0.67, S<0.01, T×S=0.26, F×S<0.01, T×P×S=0.31; BMC: P<0.01, T×P<0.01, S<0.01, T×S=0.55, P×S<0.01, T×P×S=0.68; BMD: P<0.01, T×P<0.01, S<0.01, T×S=0.81, P×S=0.07, T×P×S=0.67.
a,b,c,dValues within a row with different superscripts differ significantly at P<0.05 according to Tukey’s test.
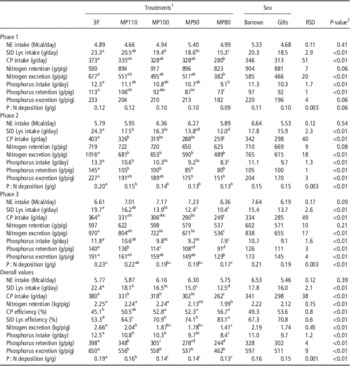
Nutrient balance of pigs in a three-phase feeding program (3P) or in daily-phase feeding programs provided individually to meet 110% (MP110), 100% (MP100), 90% (MP90) or 80% (MP80) of the estimated nutritional requirements

NE=net energy; SID=standardized ileal digestible; P : N deposition=phosphorus : nitrogen deposition.
1 Data are means of 14 pigs per treatment for all treatments except MP100 and MP80, for which the data are means of 12 and 13 pigs, respectively.
2 Treatment effect (T). Statistical models also included: period (P), interaction treatment×period (T×P), sex (S), interaction treatment×sex (T×S), interaction period×sex (P×S) and interaction treatment×period×sex (T×P×S) per variable. NE intake: P<0.01, T×P=0.08, S<0.01, T×S=0.46, P×S<0.01, T×P×S<0.05; lysine intake: P<0.01, T×P<0.01, S<0.01, T×S=0.40, P×S=0.97, T×P×S=0.85; CP intake: P<0.01, T×P<0.01, S<0.01, T×S=0.63, P×S=0.33, T×P×S=0.39; nitrogen retention: P<0.01, T×P=0.82, S<0.01, T×S=0.52, P×S=0.82, T×P×S=0.88; nitrogen excretion: P<0.01, T×P=0.02, S<0.01, T×S=0.55, P×S=0.40, T×P×S=0.21; phosphorus intake: P<0.01, T×P<0.01, S<0.01, T×S=0.61, P×S=0.43, T×P×S=0.46; phosphorus retention: P<0.01, T×P<0.01, S<0.01, T×S=0.50, P×S=0.21, T×P×S=0.77; phosphorus excretion: P<0.01, T×P=0.04, S<0.01, T×S=0.80, P×S=0.58, T×P×S=0.13; P : N deposition: P<0.01, T×P<0.01, S=0.15, T×S=0.12, P×S=0.22, T×P×S=0.98.
a,b,c,dValues within a row with different superscripts differ significantly at P<0.05 according to Tukey’s test.
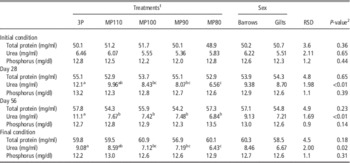
Plasma concentrations of total protein, urea and phosphorus in pigs in a three-phase feeding program (3P) or in daily-phase feeding program provided individually to meet 110% (MP110), 100% (MP100), 90% (MP90) or 80% (MP80) of the estimated nutritional requirements

1 Data are means of 14 pigs per treatment for all treatments except MP100 and MP80, for which the data are means of 12 and 13 pigs, respectively.
2 Treatment effect (T). Statistical models also included: period (P), interaction treatment×period (T×P), sex (S), interaction treatment×sex (T×S), interaction period×sex (P×S) and interaction treatment×period×sex (T×P×S) per variable. Total protein: P<0.01, T×P=0.11, S=0.32, T×S=0.44, P×S=0.08, T×P×S=0.84; urea: P<0.01, T×P<0.01, S=0.07, T×S=0.15, P×S=0.03, T×P×S=0.92; phosphorus: P=0.12, T×P=0.05, S=0.12, T×S=0.58, P×S=0.85, T×P×S=0.05.
a,b,cValues within a row with different superscripts differ significantly at P<0.05 according to Tukey’s test.
Performance and body composition
Sex-pooled ADFI, G : F, back fat thickness and body lipid mass were similar across treatments throughout the project (Tables 2 and 3). Feeding the pigs with daily tailored diets containing 110%, 100% or 90% of the estimated lysine requirements did not affect ADG in comparison with the 3P treatment. Bringing the lysine supply down to 80% of the estimated individual lysine requirements reduced (P<0.05) the overall ADG by 11% in comparison with the control (3P) and MP110 treatments. The MP80 pigs also had 10% lower (P<0.05) ADG in comparison with the MP100 pigs.
The treatment by time interaction was significant (P<0.05) for BW and body protein mass. The BW results were similar across treatments on days 0, 28 and 56, whereas the similarity among treatments was observed for body protein mass on days 0 and 28. However, MP80 treatment reduced final BW by 9%, and body protein mass by 9% on days 56 and 84 in comparison with the 3P pigs.
Increasing the number of feeding phases was described previously as an effective technique to better adjust the dietary nutrient concentrations to the estimated requirements for pig populations (Bourdon et al., Reference Bourdon, Dourmad and Henry1995; Pomar et al., 2014Reference Pomar and Rivesta) or individual animals (Andretta et al., Reference Andretta, Pomar, Rivest, Pomar, Lovatto and Neto2014) without compromising on animal performance. The current performance results are also consistent with those obtained earlier through in silico simulation (Pomar et al., Reference Pomar, Pomar, Dubeau, Joannopoulos and Dussault2010).
Lysine requirements and intake
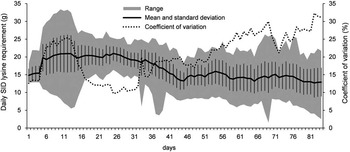
The intraday range in SID lysine requirements, meaning the difference between the most demanding pig and the least demanding pig in the population, was 15.2 g/day on average for the overall trial, and the maximum intraday range was 27 g/day and occurred on day 13 of the trial (Figure 1). The intraday CV for SID lysine requirements increased during the trial (from a mean of 16.5% in the first feeding phase to 17.8% in the second phase and 26.7% in the last phase), probably because of the increasing variation in ADG. The maximum intraday CV was 32.3% (on day 82) and the minimum was 9.7% (on day 25), for an overall average of 20.3%. These values are similar to those observed in a previous trial (with same duration and equivalent BW range) that found that the average intraday range for SID lysine requirements was 16.7 g and that the CV for the estimated SID lysine requirements increased during the trial, from 16% in the first feeding phase to 22% in the second phase and 28% in the last phase (Andretta et al., Reference Andretta, Pomar, Rivest, Pomar, Lovatto and Neto2014).
Range, mean and standard deviation (vertical bars) and CV of standardized ileal digestible (SID) lysine requirements estimated for each pig in the project.

The between-animal variation in lysine requirements may be associated with the heterogeneity of the population in terms of age, BW and genetic potential for protein and lipid growth (Noblet and Quiniou, Reference Noblet and Quiniou1999). It should be noted that the impact of feeding pigs with daily tailored diets on nutrient efficiency will increase as the heterogeneity of the population increases (Pomar et al., Reference Pomar, Jondreville, Dourmad and Bernier2003; Brossard et al., Reference Brossard, Dourmad, Rivest and van Milgen2009).
Accounting for variations in lysine requirements reduced the average percentage of feed A (high nutrient density) included in the blends that were served from 76.8% in 3P to 56.9% in MP110, 49.2% in MP100, 39.4% in MP90 and 34.2% in MP80. Because both feeds were formulated to have comparable energy levels, the NE intake did not differ among the treatments (overall means: 3P, 24.1 MJ/day; MP110, 24.6 MJ/day; MP100, 25.8 MJ/day; MP90, 26.3 MJ/day; and MP80, 24.1 MJ/day, P=0.39).
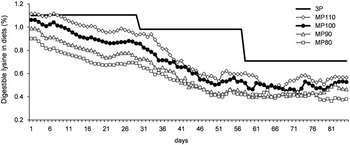
Treatment by time interaction (P<0.05) was found for lysine intake, with significant differences (P<0.05) found among treatments in all studied periods. Switching from 3P to precision feeding (MP100) reduced the dietary content of SID lysine by 14% in the first phase, 34% in the second phase and 31% in the last phase (Figure 2). In addition, SID lysine intake was reduced (P<0.05) by 19% in MP110, 26% in MP100, 33% in MP90 and 44% in MP80 in comparison with the intake of the 3P pigs in the overall period (Table 4). The MP100 pigs also showed a 27% reduction in the ratio between ingested SID lysine and protein deposition in comparison with the 3P pigs (data not shown).
Dietary lysine levels for pigs in a three-phase feeding program (3P) or in daily-phase feeding programs provided individually to meet 110% (MP110), 100% (MP100), 90% (MP90) or 80% (MP80) of the nutritional requirements estimated daily throughout the trial.

The impact of precision feeding on nutrient intake and excretion is dependent on the 3P nutritional composition, which was used in this study as reference method. This control treatment (3P) provided to all the pigs of this group and within each feeding phase a fixed blend of feeds A and B determined based in the requirements of the 80th percentile pig of the population. This lysine level was previously suggested to maximize the response of the population in terms of BW gain (Hauschild et al., Reference Hauschild, Lovatto, Pomar and Pomar2010) and it is in agreement with other in vivo (Brossard et al., Reference Brossard, Vautier, van Milgen, Salaun and Quiniou2014) and in silico results (Brossard et al., Reference Brossard, Dourmad, Rivest and van Milgen2009). These later authors suggested that oversupplying the average pig of the population by 15% at the beginning of the feeding phase maximizes population performances. This increase is similar to the daily NRC lysine requirements that are 13% higher than those of the average pig daily requirements (Remus et al., Reference Remus, Pomar and Hauschild2015). In fact, the NRC (2012) model was calibrated for maximum population responses by implicitly considering the between-animal variability adjusting different estimates (e.g. post-absorptive efficiencies of nutrient utilization) from values that have been established in individual animals (e.g. Pomar et al., Reference Pomar, Jondreville, Dourmad and Bernier2003, cited by NRC, 2012). The amount of SID lysine consumed per kilogram of BW gain by the 3P pigs during the entire trial was 21.4 g/kg, which is the same consumed by the control treatment group in a previous experiment (Andretta et al., Reference Andretta, Pomar, Rivest, Pomar, Lovatto and Neto2014), close to the 22.4 g/kg consumed by the pigs fed commercial diets (formulated according to industry standards for similar animals in Andretta et al., Reference Andretta, Pomar, Rivest, Pomar, Lovatto and Neto2014) and to the 20.5 to 21.1 g/kg estimated by the NRC (2012). However, the dietary levels of lysine given in this experiment to 3P pigs are higher than the levels used in standard commercial diets. For instance, the NRC (2012) reference pig requires 0.94, 0.81 and 0.69% SID lysine in phases 1 to 3, respectively. However, the observed 3P pigs average ADG was 42%, 14% and 7% and the estimated SID lysine requirements 14%, 15% and 0% higher than the NRC (2012) reference pigs. Finally, because pig performance is affected by many genetic and environmental factors, using the 80th percentile pig of the actual population rather than a priori fixed lysine concentration ensured a fair and unbiased comparison between conventional and precision feeding systems. Using in the 3P reference treatment lower lysine concentration diets (e.g. 10% under maximal growth) would certainly reduce animal performance and comparisons with pigs fed with daily tailored diets for maximal performance would not be adequate.
Nitrogen intake, retention and excretion
To improve nutrient efficiency, the optimal dietary concentration of lysine should be progressively decreased during the growing period, with the dietary concentration of nutrients concomitantly adjusted to match the estimated requirements (NRC, 2012). Significant differences (P<0.05) were found among treatments in all studied periods for CP intake. Considering the overall means, CP intake was reduced (P<0.05) by 13% in MP110, 16% in MP100, 21% in MP90 and 31% in MP80 in comparison with CP intake in the 3P pigs. Despite this reduction in protein intake, the pigs fed according to the 3P, MP110 and MP100 feeding programs retained similar amounts of protein during the growing–finishing period, with MP90 showing intermediate results between these previous treatments and the MP80. Pigs fed on the MP100 feeding program showed much higher (P<0.05) nitrogen retention efficiency than did the 3P pigs; these results are consistent with those reported previously in pigs fed individually with daily tailored diets (Zhang et al., Reference Zhang, Pomar, Pomar and Del Castillo2012).
Treatment by time interaction (P<0.05) was found for nitrogen excretion, with significant differences (P<0.05) found among treatments in all studied periods. Overall results of nitrogen excretion was reduced (P<0.05) by 23% in MP110, 30% in MP100, 33% in MP90 and 47% in MP80 in comparison with the 3P treatment. This reduction in nitrogen excretion obtained by feeding pigs using the precision-feeding technique was the result of the reduction in nitrogen supply due to the increased number of feeding phases (i.e. daily phases) and the concomitant adjustment of the supply to meet requirements. Thus, accounting for the variation in lysine requirements over time and within the population is an efficient approach to significantly reduce nutrient excretions in pig production systems.
Phosphorus intake, retention and excretion, and bone mineralization
Treatment by time interaction (P<0.05) was found for intake, retention and excretion of phosphorus, with significant differences (P<0.05) found among treatments in all studied periods. Total phosphorus intake was reduced (P<0.05) by 14% in MP110, 18% in MP100, 22% in MP90 and 33% in MP80 in comparison with the 3P treatment in the overall period. Relative to the 3P pigs, bone mineral content, bone mineral density and phosphorus retention were also reduced (P<0.05), respectively, by 11%, 7% and 13% in the MP110 pigs; 20%, 12% and 23% in the MP100 pigs; 25%, 15% and 30% in the MP90 pigs; and 32%, 18% and 39% in the MP80 pigs. The ratio between phosphorus and nitrogen retention was influenced by the treatments in phases 2 and 3 of the trial. The estimated phosphorus excretion was also reduced (P<0.05) by 14%, 17% and 29% in the MP100, MP90 and MP80 pigs, respectively, in relation to the 3P pigs. Phosphorus excretion was similar across precision-feeding treatments.
No effects of daily-phase feeding on bone mineralization or phosphorus retention were observed in previous studies (Andretta et al., Reference Andretta, Pomar, Rivest, Pomar, Lovatto and Neto2014; Pomar et al., 2014Reference Pomar and Rivesta). However, lower daily intake of digestible phosphorus was observed in the current project than the previously reported studies as a result of the lower mineral supply of feed B. For instance, the average levels of digestible phosphorus provided in the MP100 diets were 0.26%, 0.18% and 0.14% in the first, second and third feeding phases, respectively. The average levels provided throughout the trial in the 3P, MP110, MP100, MP90 and MP80 treatments were 0.26%, 0.20%, 0.19%, 0.16% and 0.15%, respectively. These levels are lower than the ones recommended for growing–finishing pigs (NRC, 2012), namely 0.26%, 0.23% and 0.21% for pigs of BW equivalent to the BW of the pigs in this trial in feeding phases 1 to 3, respectively. Total phosphorus retention for the overall trial was 4.5, 4.0, 3.5, 3.3 and 3.1 g/kg of BW gain for the 3P, MP110, MP100, MP90 and MP80 pigs, respectively; those values are >5.3 g/kg of BW gain observed in pigs with maximal bone mineralization (Jondreville and Dourmad, Reference Jondreville and Dourmad2005). Nonetheless, it has been clearly established that maximum growth performance can be obtained at digestible phosphorus levels lower than those maximizing phosphorus retention and bone mineralization (Nicodemo et al., Reference Nicodemo, Scott, Buchan, Duncan and Robins1998; Pomar et al., Reference Pomar, Kyriazakis, Emmans and Knap2006; NRC, 2012).
In this trial, phosphorus retention efficiency (i.e. phosphorus retention/total phosphorus intake) was 36% on average and did not change significantly between treatments and feeding phases (data not shown). In these circumstances, the decrease in phosphorus excretion was the consequence of reduced phosphorus intake rather than the reduction of excess phosphorus.
Although precision-feeding treatments reduced phosphorus retention, there is evidence that low levels of phosphorus do not necessarily affect feed intake or reduce growth performance (Pomar et al., Reference Pomar, Kyriazakis, Emmans and Knap2006; Létourneau-Montminy et al., Reference Létourneau-Montminy, Narcy, Dourmad, Crenshaw and Pomar2015). The optimal mineral levels in diets formulated for precision feeding are difficult to establish and several ongoing projects are addressing the real-time estimation of individual pig’s calcium and phosphorus requirements.
Plasma parameters
The fasting interval before blood collection (time between the last recorded meal and blood collection) was 156 min on average. This interval was not correlated with the studied plasma responses. Plasma phosphorus concentration was not correlated with total phosphorus intake, retention or excretion. However, plasma concentrations of total protein and urea were correlated (P<0.05) with nitrogen excretion (0.266 and 0.397, respectively) and CP efficiency (−0.407 and −0.127, respectively).
The serum parameters were similar across treatments at the beginning of the trial (Table 5). The feeding programs did not influence the plasma contents of total protein and phosphorus during the experiment. However, treatment by time interaction (P<0.05) was found for urea concentration and precision feeding (MP100) reduced (P<0.05) the plasma concentration of urea on days 28 (−30%), 56 (−33%) and 84 (−22%) of the trial in relation to the 3P treatment. Major reductions (P<0.05) in plasma urea concentration were achieved with the MP80 treatment.
The urea excreted in urine is the main nitrogenous end-product of amino acid catabolism in pigs. A relationship between serum urea and urinary nitrogen excretion was found previously in pigs with free access to feed (Zervas and Zijlstra, Reference Zervas and Zijlstra2002). Previous studies also found that plasma urea is closely and inversely correlated to net protein utilization, which is affected by dietary protein quality and quantity (Cai et al., Reference Cai, Zimmerman and Ewan1994). Based on this relationship, the plasma concentration of urea can be used as an important metabolism indicator, with lower blood urea concentration indicating higher dietary biological value.
Economic evaluation
Feeding pigs to requirements with daily tailored diets (i.e. MP100) reduced (P<0.05) the cost of feed by $7.60/pig (i.e. −10%) relative to the 3P treatment. The ratio between feeding costs and weight gain was also reduced (P<0.05) by 6%, 6% and 5% in the MP110, MP100 and MP90 feeding treatments, respectively, in relation to the 3P treatment. Corroborating the current findings, the economic benefits of precision-feeding programs were already reported previously in silico (Pomar et al., Reference Pomar, Pomar, Dubeau, Joannopoulos and Dussault2010; Brossard et al., Reference Brossard, Vautier, van Milgen, Salaun and Quiniou2014) and in vivo (Niemi et al., Reference Niemi, Sevón-Aimonen, Pietola and Stalder2010) studies. Feeding individual pigs with daily tailored diets reduces excesses of the most expensive nutrients and ingredients, but the magnitude of the reduction in feeding costs depends on current local ingredient prices. In relation to the diets served to the 3P pigs, those served to the MP100 pigs had 7% less soybean meal and 0.33% less dicalcium phosphate. In addition, precision feeding could provide greater economic benefits in a global scenario, because the system requires only two feeds to be prepared, transported and stored. In conventional phase feeding systems minimal feeding cost or for maximal revenue is often obtained with nutrient levels lower than those required for maximal population growth (Hauschild et al., Reference Hauschild, Lovatto, Pomar and Pomar2010). In the context of feeding populations of pigs, nutrient requirements should be seen as the balance between the proportion of pigs that are going to be overfed and underfed (Brossard et al., Reference Brossard, Dourmad, Rivest and van Milgen2009; Hauschild et al., Reference Hauschild, Lovatto, Pomar and Pomar2010; Pomar et al., Reference Pomar, López and Pomar2014b).
In conclusion, feeding growing pigs individually with daily tailored diets may be a key tool to optimize the sustainability of pig farming. Although this system is still being developed and some issues still need further consideration (e.g. mineral requirements), precision feeding has great potential to improve nutrient-use efficiency in comparison with conventional group phase-feeding programs. Feeding growing pigs individually with diets tailored daily to the estimated requirements can reduce lysine intake by 26% and nitrogen excretion by 30% without compromising the pigs’ performance. According to the current findings, the precision-feeding technique is an effective approach to reduce nutrient excretion and costs in the pig industry.
Acknowledgments
The authors acknowledge the financial support received from Swine Innovation Porc (Canada) and Aliments Breton (Canada). The support of a PDSE fellowship (CAPES, Brazil) is also gratefully appreciated. The automatic precision feeders were provided by the University of Lleida, Spain and partly financed by the Ministry of Science and Education of Spain. Special thanks go to N. Ouellet and the employees of the Agriculture and Agri-Food Canada swine complex in Sherbrooke, QC, Canada, for conducting the research.