I. INTRODUCTION
Eutectic alloys are of great potential as in situ composite material for their excellent mechanical properties. Upon solidifying under near-equilibrium conditions, the eutectic morphology will be regular (lamellar or rod structure) if all the phases possess low entropies of fusion but irregular as long as one phase has high entropy of fusion.
Solidification mechanisms of eutectic alloys have been widely studied. The JH (Jackson and Hunt) modelReference Jackson and Hunt1 illustrates the growth mechanism of lamellar and rod eutectics, based on two assumptions: (i) the lamellar spacing is much smaller than the solute diffusion distance; (ii) the interface undercooling is so small that the liquid composition at the solid–liquid (S–L) interface is about the same as the equilibrium eutectic composition. By relaxing the above assumptions, the TMK (Trivedi, Magnin, and Kurz) modelReference Trivedi, Magnin and Kurz2 extends the JH analysis to rapid solidification subjected to relatively large undercoolings. Afterward, Kurz and TrivediReference Kurz and Trivedi3 suggested that the effect of local nonequilibrium must be considered at the fast-moving S–L interface. However, it must be pointed out that in their deduction, there is an implied condition that the eutectic alloys solidify with a positive thermal gradient at the interface.
Upon free solidification of undercooled melts, eutectic morphologies are dependent on the melt undercooling prior to nucleation. A transition from lamellar to anomalous eutectic above a critical undercooling was found in many eutectic alloys,Reference Kattamis and Flemings4–Reference Wei, Herlach, Feuerbacher and Sommer6 especially in nonfacetted–facetted (nf–f) eutectic systems (all the eutectic couples discussed below belong to nf–f system). In anomalous eutectics, all the eutectic phases no longer exhibit the lamellar or rod morphology.
Anomalous eutectics are the eventual products of solidification. Their formation does not mean that the two phases must nucleate and grow separately from the beginning to the end of solidification.Reference Li, Li, Liu and Lu7 In theory, both coupled and decoupled growths result in anomalous eutectics.Reference Goetzinger, Barth and Herlach8,Reference Li, Jie, Zhao and Zhou9
Using a local nonequilibrium model in solidification, Galenko and HerlachReference Galenko and Herlach10 argued that a suppression of eutectic reaction occurs in the range v ≥ v d (with v as the growth velocity and v d the solute diffusion speed both at the interface and in bulk liquid). This will result in the growth of a homogeneous crystalline phase with initial composition of the eutectic system.Reference Galenko and Herlach10 For instance, at higher rate of quenching, where the latent heat of crystallization is conducted to ambient quickly, such kind of growth would lead to a completely chemically homogeneous crystalline microstructure. This demonstrates the competition between the coupled and decoupled growths in the eutectic system. If that kind of growth occurs in free solidification of undercooled eutectic melts, the latent heat would cease the homogeneous growth and cause the decomposition of supersaturated leading phase, thus resulting in anomalous eutectic. But the GK (Galenko and Herlach) model cannot identify whether the leading phase is a solid solution or a faceted intermetallic.
It is generally consideredReference Gill and Kurz11 that the solid solution acts as the leading phase upon eutectic reaction, owing to its simple structure. Actually, this judgment is the lack of in-depth theoretical basis. By introducing Aziz's interface attachment kinetic modelsReference Aziz and Boettinger12,Reference Aziz13 for single-phase solidification, Li and KuribayashiReference Li and Kuribayashi14 argued that supersaturated solid solution could act as the leading phase, since the growth modes of solid solution and intermetallic are collision-limited and short-range diffusion-limited, respectively. It should be noted that a difference of three orders of magnitude in growth velocity is predicted for the two-growth mode,Reference Wang and Prasad15 i.e., the solid solution grows much faster than intermetallic. However, Li's analysis ignored an essence in interface attachment kinetic modelsReference Aziz and Boettinger12: a transition between diffusion- and collision-limited growth modes could occur under certain conditions. For intermetallic compounds, the growth could also be collision-limited only if the growth velocity is comparable to the diffusion speed and the complete disorder trapping occurs.Reference Boettinger and Aziz16 For solid solutions, the growth could also be diffusion-limited when the undercooling is sufficiently smallReference Aziz and Boettinger12,Reference Wang, Lv, Qin and Wei17 and complete solute trapping does not occur. So it is arbitrary to negate the probability of intermetallic as the leading phase in decouple growth process.
Models about solute trappingReference Aziz18,Reference Aziz and Kaplan19 and disorder trapping,Reference Boettinger and Aziz16 studied by Aziz in 1980s, have been adopted to explain experimental and simulation works about solute trappingReference MacDonald, Malvezzi and Spaepen20 and disorder trapping.Reference Boettinger, Bendersky, West, Aziz and Cline21,Reference West22 Although the two models are similar in some physical senses, a competitive analysis between the two trapping mechanisms has never been reported. Particularly upon solidification of nf–f eutectics, decoupled growth occurs under extreme nonequilibrium conditions; the leading phase, solid solution or intermetallic, plays an important role. So, a competitive analysis between the two trapping mechanisms will contribute to figure out the physical insight of the decoupled growth mechanism and to understand the trapping mechanism better.
In the present work, Fe40Ni40P14B6 eutectic alloy is selected as the research object. The microstructures obtained from free solidification of undercooled melts and crystallization of amorphous alloys, as well as rapidly quenched solidification, are studied systematically (Fe40Ni40P14B6 is a kind of well developed commercial soft magnetic material. The studies about this alloy have been concentrated on amorphous formation and crystallization. The studies of free solidification of this alloy have also been presented about the so-called spinodal decomposition under large undercooling (>260 K).Reference Li23,Reference Zhang and Yao24 To study the decoupled growth mechanism systematically, we devoted to achieving as-crystallized samples subjected to a wide range of undercoolings. But in our work, the initial melt undercooling could only reach 150 K in free solidification experiments. Thus, crystallization of amorphous alloys and rapidly quenched solidification are adopted to achieve large undercoolings). The experimental procedures are presented in Sec. II. The experimental results, revealing two different decoupled growth mechanisms, are presented in Sec. III. Competition between coupled growth and decoupled growth and phase competition in decoupled growth are discussed in Sec. IV. Our conclusions are summarized in Sec. V.
II. EXPERIMENTAL PROCEDURES
Fe40Ni40P14B6 ingots were prepared from Fe (99.98%), Ni (99.95%), B granules (99%), and Ni2P ingots (99.98%) in argon atmosphere. After weighing in the right proportions, they were put in a clean fused silica tube and alloying was brought about by high-frequency induction furnace under argon atmosphere. The melting point of the alloy was measured via differential thermal analysis (DTA; NETZSCH, STA 449C, Selb, Germany). To remove impurities and acquire a wide range of undercooling ΔT, fluxing experiments were performed, in which Fe40Ni40P14B6 ingots and desiccative B2O3 were put in a clean silica tube and held at an elevated temperature for 10 h in argon atmosphere. After fluxing experiments, the Fe40Ni40P14B6 specimens were maintained at different undercoolings to be crystallized and then cooled down naturally. The temperature of melts was measured by infrared pyrometer. Fe40Ni40P14B6 amorphous alloy foils with a thickness less than 100 μm were prepared by single-roller melt-spinning technique in argon atmosphere, with a rolling speed of 40 m/s. To study the crystallization mechanism of amorphous alloys, partially crystallized samples in the processes of isochronal crystallization were obtained with the aid of accurate temperature-controlling program in differential scanning calorimetry (DSC; Perkin-Elmer, DSC 8500, Waltham, MA).
Rapidly quenched solidification experiments were also performed via single roller melt-spinning technique as well. The rolling speeds range from 15 to 24 m/s to produce crystallized samples of different states. Except for the rolling speed, the other experimental parameters, such as initial melt temperature (1100 K), vacuum degree (10−3 Pa), and injection pressure (5000 Pa), were fixed.
The as-solidified samples were characterized by x-ray diffraction (XRD; RigakuD/max-3C, Cu Kα radiation, Akishima, Japan) and transmission electron microscopy (TEM; JEM-200CK). Samples for TEM studies were thinned in an ion mill (GATAN, model 600, Pleasanton, CA) with a liquid nitrogen-cooled specimen holder. The metallographic structures of the samples were studied by optical microscopy (PMG3 Olympus) and scanning electron microscopy (Zeiss Supra 55, Oberkochen, Germany). Three different etchants [i.e., aqua regia (hydrochloric acid and nitric acid, 3:1), nital (nitric acid and ethanol, 1:24) and a mixture of perchloric acid and ethanol (1:9)] were used to reveal metallographic structures of eutectic, supersaturated solid solution and partially crystallized microstructures, respectively.
III. EXPERIMENTAL RESULTS
Free solidification of undercooled melts and crystallization of amorphous alloys both reflect the transformations from disorder phase (liquid or amorphous) to crystallized phase, although there are significant differences between them: thermodynamics plays a more important role in solidification, whereas kinetics determines the amorphous crystallization due mainly to the much higher ΔT. On this basis, an integrated study upon solidification and amorphous crystallization will help us to understand the decoupled growth systematically. Free solidification of undercooled Fe40Ni40P14B6 melts is described in Sec. III. A, where the evolution of eutectic morphology, phase constitution, and chemical composition with ΔT is shown. Crystallization of amorphous foil is described in Sec. III. B, where different microstructures of partially and fully crystallized samples are shown.
A. Free solidification
1. Eutectic morphology
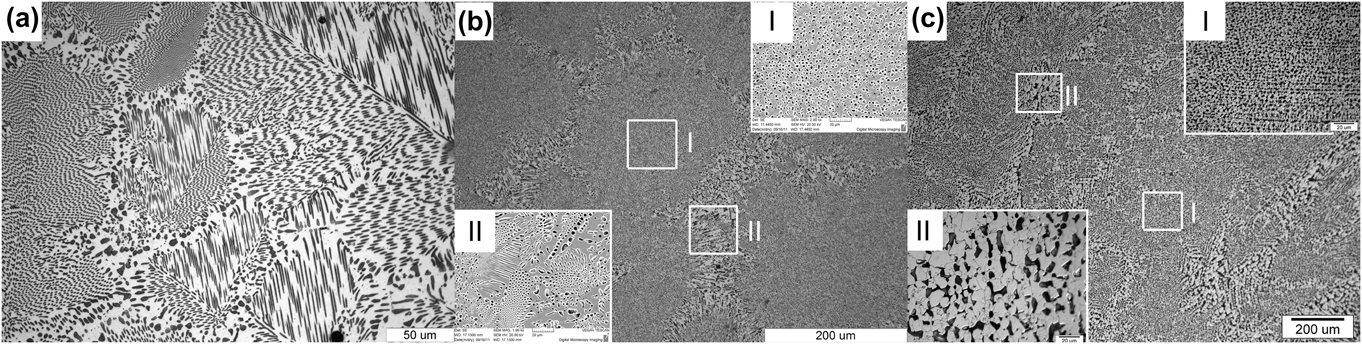
The evolution of as-solidified microstructure with ΔT is shown in Fig. 1. The microstructures are all composed of independent eutectic colonies regardless of the undercooling. But the detailed structures within the colonies are different. For ΔT < 35 K, every colony exhibits a rod regular eutectic morphology [Fig. 1(a)]. As ΔT exceeds 35 K, in the center of every colony is anomalous eutectic [the right inset in Fig. 1(b)], around which is regular eutectic [the left inset of Fig. 1(b)]. With ΔT exceeding 120 K, as illustrated in Fig. 1(c) and its insets (ΔT = 150 K), only anomalous eutectic is found. This kind of “regular-anomalous” transition is common for many eutectic alloys.Reference Han, Wang and Wei25 The anomalous eutectic in Fig. 1(c) appears a dendrite-like morphology. As shown in the right inset of Fig. 1(c), distribution of the dark grains in the center of every eutectic colony has some preferred orientations. Besides, as shown in the left inset of Fig. 1(c), the dark grains on the edge of every eutectic colony have branches. These features indicate that the anomalous γ(Fe, Ni) phase probably results from disintegration of the dendritic network by partial remelting during and after recalescence. If undercooling is relatively small, however, as seen in Fig. 1(b), the morphology shows no trace of dendritic. The formation mechanism of anomalous eutectic will be further discussed in Sec. IV. A.
As-solidified microstructures of Fe40Ni40P14B6 eutectic alloy subjected to different undercoolings, which are composed of independent eutectic colonies regardless of the undercooling: (a) near-equilibrium as-solidified microstructure with the undercooling of 20 K, of which every colony exhibits a rod-like regular eutectic morphology; (b) nonequilibrium as-solidified microstructure with the undercooling of 100 K. In the center of every colony is anomalous eutectic (the upper right inset), around which is regular eutectic (the bottom left inset); (c) nonequilibrium as-solidified sample with the undercooling of 150 K. Only anomalous eutectic is found in every colony. The anomalous eutectic appears a dendrite-like morphology. The distribution of the dark grains in the center of every eutectic colony has some preferred orientations (the right inset). On the edge of every eutectic colony, the dark grains have branches (the left inset).

2. Phase (composition) identification
To confirm whether the phase constitution of the as-solidified Fe40Ni40P14B6 alloy changes with ΔT, XRD analysis was performed. As shown in Fig. 2(a), the diffraction patterns of the samples subjected to different undercoolings are similar. Only two phases, the solid solution γ(Fe, Ni) and the intermetallic (Fe,Ni)3(P,B) can be indexed.
(a) X-ray diffraction patterns of as-solidified Fe40Ni40P14B6 eutectic alloy subjected to different undercoolings, indicating that the phase constitutions are the same, a mixture of solid solution γ(Fe, Ni) and intermetallic (Fe,Ni)3(P,B), regardless of the undercooling; (b) the dependence of P contents in γ(Fe, Ni) and (Fe,Ni)3(P,B) on the undercooling in the solidification of undercooled Fe40Ni40P14B6 melt.
Microzone compositional analysis via EDS was performed and shown in Fig. 2(b) (as a reference of average composition of the alloy, the EDS analysis of amorphous Fe40Ni40P14B6 alloy was also given. It is noteworthy that the measured values of compositions deviate from the actual ones, since the element B cannot be detected by EDS). The matrix phases (white phase) in both regular and anomalous eutectic, have a relatively high content of P, corresponding probably to the intermetallic (Fe,Ni)3(P,B). For the dark phase dispersed in the matrix, corresponding probably to the solid solution γ(Fe, Ni), the P content increases with the undercooling, and as the undercooling exceeds 120 K, the P content becomes close to the average P content of the alloy (larger than 15.37 at.%).
Within the undercooling range achieved here, the phase constitutions hold similar, but the microstructures are totally different, i.e., regular eutectic corresponding to relatively small undercoolings and anomalous eutectic corresponding to relatively large undercoolings.
B. Amorphous crystallization
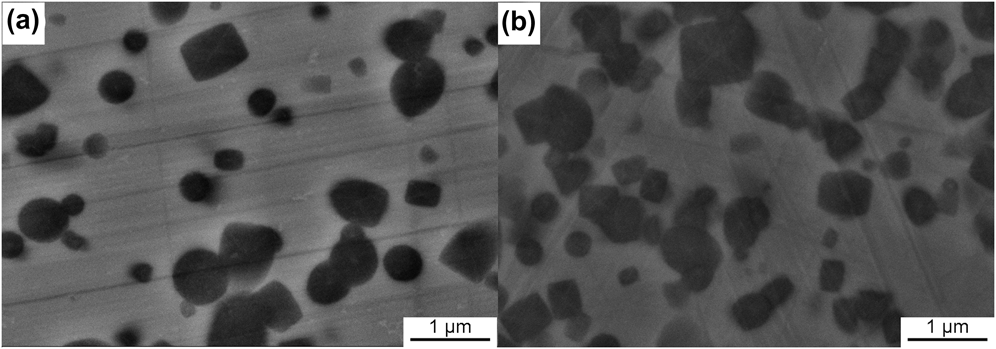
As compared to free solidification, crystallization of amorphous alloys is so slow that the intermediate stages can be preserved. Meanwhile, the corresponding undercooling in crystallization of amorphous Fe40Ni40P14B6 alloys is about 490 K (the crystallization temperature of Fe40Ni40P14B6 amorphous alloy in DSC experiments with heating rate of 40 K/min is about 693 K; the melting point of Fe40Ni40P14B6 alloy is measured as 1183.86 K), which is much larger than that in free solidification. Evolution of the as-crystallized microstructure with the temperature (at which the samples are quenched), upon the isochronal crystallization process of amorphous Fe40Ni40P14B6 alloy with a heating rate of 40 K/min, is shown in Fig. 3. The cross sections of the crystallized clusters range from circular to rectangular.
Evolution of the as-crystallized microstructure with temperature, upon isochronal crystallization process of amorphous Fe40Ni40P14B6 alloy with a heating rate of 40 K/min. The quenching temperatures are (a) 694.15 K and (b) 695.15 K, respectively. The cross-sections of the crystallized clusters range from circular to rectangular shape and grow without apparent morphological change until their impingement.
1. Partially crystallized sample
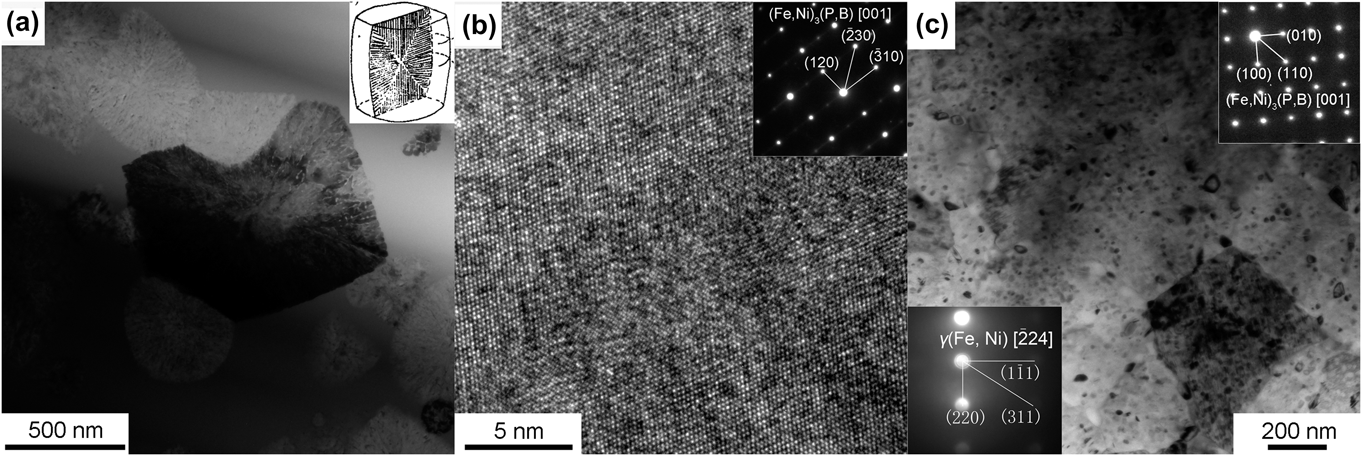
As shown in Fig. 4(a), a clear diffraction contrast appearing as a lamellar structure can be observed in the bright-field images of crystallized clusters in the partially crystallized samples, analogous to that obtained in eutectic reactions.Reference Walter, Rao, Koch and Bartram26 This phenomenon was also observed in the isothermal experiments,Reference Walter, Rao, Koch and Bartram26,Reference Watanabe and Scott27 where a two-phase lamellar model, as shown in the upper right inset in Fig. 4(a), was suggested: a cooperative growth of continuous matrix, (Fe,Ni)3(P,B), and rod-like phase, γ(Fe, Ni), growing radially. The model assumes that the crystallized phases should contain two phases, which is supported by the lamellar appearance of the clusters but could not be proved unambiguously.Reference Watanabe and Scott27 However, this assumption deviates from the diffraction patterns and HRTEM images made for many clusters [Fig. 4(b)], where the prevailing diffraction pattern is indexed only as [001] (Fe,Ni)3(P,B) phase [the upper right inset in Fig. 4(b)], i.e., the clusters are composed only of (Fe,Ni)3(P,B) phase, consistent with a homogeneous atomic arrangement in the HRTEM image [Fig. 4(b)]. It then follows that the diffraction contrast appearing as a lamellar structure is not ascribed to a two-phase structure; details can be seen in Sec. IV. C. Furthermore, the EDS analysis indicates the same composition of the cluster as that of the amorphous matrix, i.e., the (Fe,Ni)3(P,B) phase deviates from stoichiometry and becomes supersaturated.
For partially crystallized samples, a bright-field TEM image (a) of crystallized clusters shows a clear diffraction contrast, appearing as a lamellar eutectic structure (see the right inset). The HRTEM image (b) and the corresponding SAED (see the right inset) of crystallized clusters indicate the clusters are composed of only (Fe,Ni)3(P,B) phase; for fully crystallized samples, bright-field TEM images (c) show that the crystallized clusters impinge severely, where some dot-like objects are dispersed. The continuous matrix phase is indexed as (Fe,Ni)3(P,B) phase [the right inset in Fig. 4(c); SAED], and the dot-like object is indexed as γ(Fe, Ni) phase [the left inset in Fig. 4(c), microbeam electron diffraction].
2. Fully crystallized sample
Upon annealing to 723.15 K at a heating rate of 40 K/min, the Fe40Ni40P14B6 amorphous foil becomes fully crystallized. XRD analysis indicates that two phases, γ(Fe, Ni) and (Fe,Ni)3(P,B), are indexed. In the bright-field images [Fig. 4(c)], the crystallized clusters impinge severely and cannot be distinguished explicitly, and the lamellar appearance appearing in the partially crystallized sample disappears, whereas dot-like eutectic morphology appears, i.e., some dot-like objects disperse in the continuous matrix phase. With the aid of selected area electron diffraction (SAED) and microbeam electron diffraction techniques, the continuous matrix phase is indexed as (Fe,Ni)3(P,B) phase [the upper right inset in Fig. 4(c)], but the dot-like object is indexed as γ(Fe, Ni) phase [the bottom left inset in Fig. 4(c)], i.e., the as-crystallized structure of amorphous Fe40Ni40P14B6 alloy follows a dot-like eutectic morphology. Since the final microstructure is composed of γ(Fe, Ni) and (Fe,Ni)3(P,B) phases, the γ(Fe, Ni) phase must be precipitated from the as-formed supersaturated (Fe,Ni)3(P,B) phase.
Thus it is concluded that, upon crystallization of amorphous eutectic alloy, the decoupled growth prevails, although the eutectic phase is obtained finally. Supersaturated (Fe,Ni)3(P,B) phase, with the same composition as the parent phase, acts as the leading phase. Therefore, it is reasonable to deduce that disorder trapping of high degree occurs under this circumstance, since deviation from stoichiometry is a feature of complete disorder trapping for intermetallics.Reference Aziz13
IV. DISCUSSION
In amorphous crystallization, decoupled growth is evident owing to the feasibility to observe the crystallization process. As for free solidification, although in a great deal of literature the anomalous eutectic formation is ascribed to the decoupled crystal growth,Reference Kattamis and Flemings4–Reference Wei, Herlach, Feuerbacher and Sommer6 it must be pointed out that both coupled and decoupled growths result in anomalous eutectics.Reference Li, Li, Liu and Lu7–Reference Li, Jie, Zhao and Zhou9 Although the anomalous eutectic forms so long as undercooling exceeds 35 K, the morphologies and the composition of γ(Fe, Ni) phase corresponding to ΔT > 120 K and ΔT < 120 K are different as seen in Sec. III. A, indicating possibly different forming mechanisms.
A. Formation mechanism of anomalous eutectic
Below the equilibrium eutectic temperature, the two eutectic phases are both thermodynamically permitted to grow cooperatively (coupled growth) or separately (decoupled growth).Reference Li, Jie, Zhao and Zhou9 The coupled growth of eutectic phases breaks down only if the undercooling is so high that one of them, with a faster growth velocity, grows as a single-phase dendrite.Reference Li and Zhou28
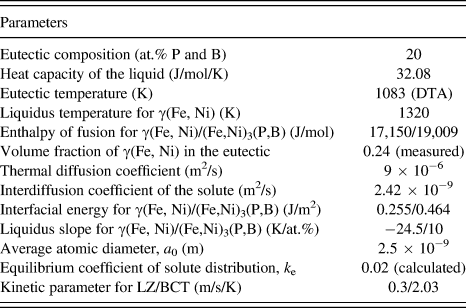
Recently, Li and ZhouReference Li and Zhou28 established a model to describe the regular eutectic growth in undercooled melts, which, different from the JH model,Reference Jackson and Hunt1 includes the kinetic effect and thermal diffusion, permits a negative thermal gradient at the interface, and can be used in free solidification. Using the physical data listed in Table IReference Binder, Kolbe, Klein and Herlach29–Reference Shen and Schwarz36 and assuming linear liquidus and solidus, the eutectic growth velocity during rapid solidification was calculated (Fig. 5) via the LZ model.Reference Li and Zhou28 As undercooling increases, the velocity is enhanced continuously. Using the physical data listed in Table I, the dendrite growth velocity of γ(Fe, Ni) in the undercooled Fe40Ni40P14B6 melt was calculated using the BCT (Boettinger, Coriell, and Trivedi) model,Reference Boettinger, Coriell, Trivedi, Mehrabian and Parrish37 and the results were also plotted in Fig. 5. The two velocity curves intersect at an undercooling of 120 K, below which the eutectic dendrite grows faster than the γ(Fe, Ni) dendrite, whereas above which the γ(Fe, Ni) dendrite grows faster. As seen in Fig. 2(b), the composition of γ(Fe, Ni) gets close to the average P content of the alloy when undercooling exceeds 120 K. With reference to Aziz's model for solute trapping,Reference Aziz and Boettinger12 such a high degree of solute trapping implies collision-limited growth mode and high growth velocity. This means that the lamellar eutectic growth of γ(Fe, Ni) and (Fe,Ni)3(P,B) should be substituted by their decoupled growth when the undercooling exceeds 120 K.
Thermal–physical parameters for calculating the growth of eutectic dendrite by LZ model and γ(Fe, Ni) dendrite by BCT model in Fe40Ni40P14B6.Reference Binder, Kolbe, Klein and Herlach29–Reference Shen and Schwarz36
Calculated growth velocities in the undercooled melt when eutectic dendrite or γ(Fe, Ni) dendrite is assumed to form.
Besides, if γ(Fe, Ni) dendrite is assumed to form, remelting will occur during recalescence because of the deviation of the average solute concentration of γ(Fe, Ni) from the equilibrium concentration, and the deviation becomes more severe as the undercooling increases.Reference Li, Jie, Zhao and Zhou9 Since it is proportional to the composition deviation,Reference Li, Jie, Zhao and Zhou9 the remelted fraction of the primary γ(Fe, Ni) increases with the undercooling, which means that the fragments of γ(Fe, Ni) dendrites would be observed more easily at small undercooling. However, the fact in our work is that the fragments are found at higher rather than lower undercoolings, as seen in Figs. 1(b) and 1(c). Therefore, a reasonable speculation is that the formation mechanism of anomalous eutectic changes as the undercooling increases, and the transition from coupled to decoupled growth is not the prerequisite for anomalous eutectic formation.Reference Li, Jie, Zhao and Zhou9 When the undercooling is less than 120 K, lamellar γ(Fe, Ni) and (Fe,Ni)3(P,B) grow cooperatively during both the rapid and the slow solidifications. Because the lamellar eutectics formed upon rapid solidification contain a high density of γ(Fe, Ni)/(Fe,Ni)3(P,B) interfaces, they will be partially remelted and disintegrated into anomalous eutectics when the undercooling is above 35 K, even though the amount of excess solute trapped in the lamellar eutectics is not too large.Reference Goetzinger, Barth and Herlach8
Therefore, decoupled growth takes place upon free solidification of undercooled melts (ΔT > 120 K) and crystallization of amorphous for Fe40Ni40P14B6 system. The leading phases are supersaturated solid solution γ(Fe, Ni) and intermetallic (Fe,Ni)3(P,B), due to solute trapping and disorder trapping, respectively. In the following sections, further evidences will be presented to elucidate the mechanism of decoupled growth. Besides, competition between the two trapping mechanisms will be discussed, in combination with rapidly quenched solidification experiments.
B. Decoupled growth in free solidification: Solute trapping
Regular eutectic results from cooperative growth of eutectic phases, whereas when the undercooling is larger than 120 K, anomalous eutectic results from decoupled growth with γ(Fe, Ni) as the leading phase. Different growth mechanisms lead probably to different interfacial structures; it is worthwhile to study the structures of phase interfaces in the regular and anomalous eutectic via a HRTEM experiment.
1. Semi-coherent interface formed in cooperative growth process
Usually, the specific energy of phase interface increases with dissimilarity of the phases increasing, so that certain (low-energy) crystallographic orientations develop between the phases and thereby minimize the interfacial energy. That is to say, the low-energy interface is made from crystallographic planes possessing similar atomic densities and consistent atomic arrangements.Reference Kurz and Fisher38,Reference Gupta, Vieregge and Gust39 On this basis, coherent interfaces can be defined as low-energy interfaces, whereas incoherent interfaces, high-energy interfaces, and semi-coherent interfaces in between.Reference Hu40
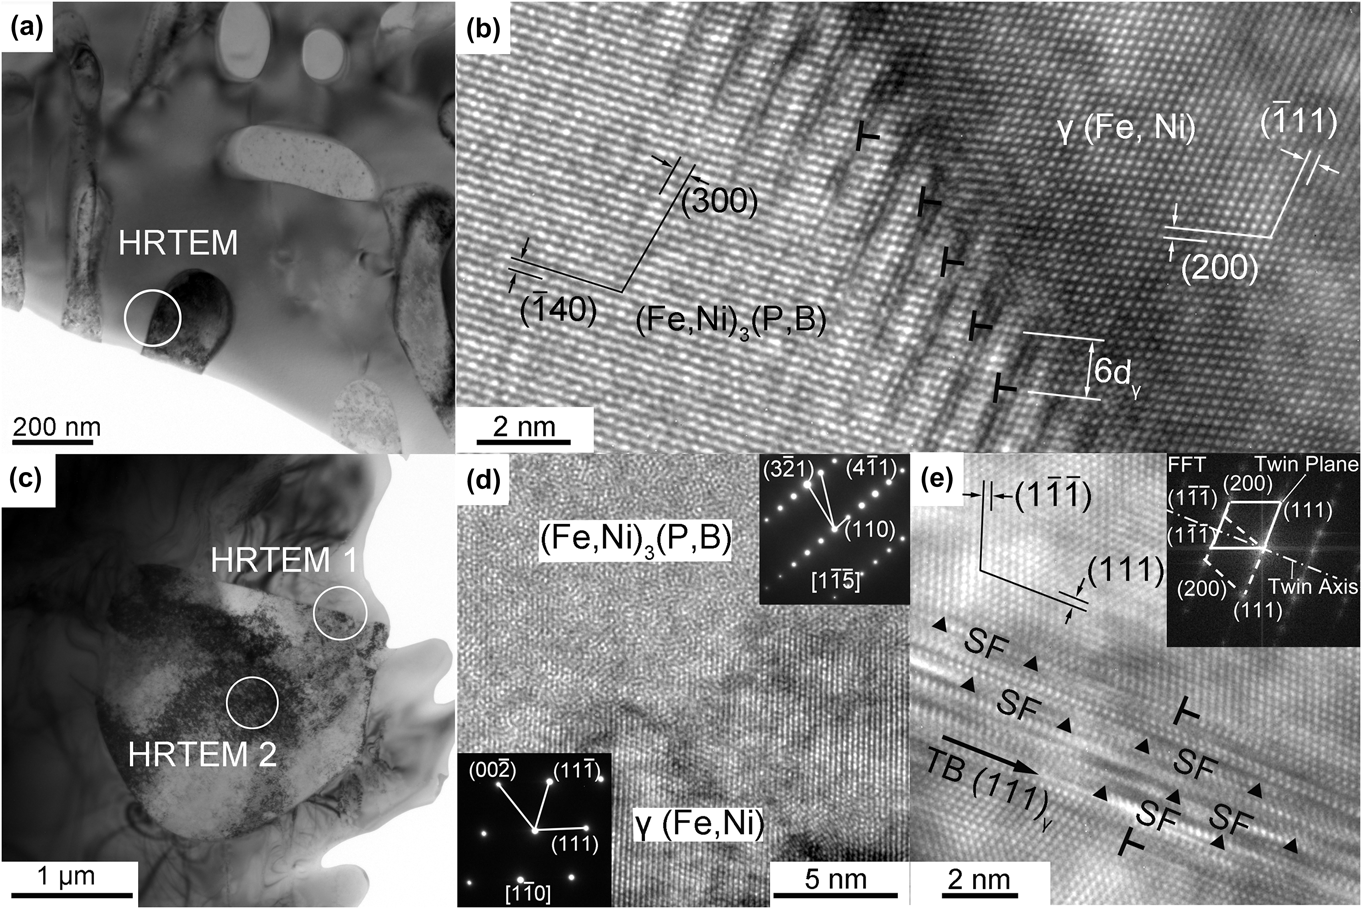
Cooperative growth prevails when the undercooling is less than 120 K, but the regular eutectic morphology can be preserved only when the undercooling is less than 35 K. Figure 6(a) shows the TEM image of a rod-like eutectic microstructure [corresponding to Fig. 1(a)] in which the interface between the two eutectic phases is selected for HRTEM image [Fig. 6(b)], showing the connection of two crystal planes, (140)α and (200)γ at the interface. Because of the slight difference between the interplanar spacing, the atoms in the two phases do not match wholly, thus leading to lattice distortion at the interface. Yet the dislocations could counteract the distortion; see the marks “T” in Fig. 6(b): an edge dislocation emerges every six (200)γ crystal planes at the side of γ(Fe, Ni) phase.
Bright-field TEM image (a) of the rod-like eutectic in which the interface between the two eutectic phases is selected for HRTEM image (b), showing the connection of two crystal planes, (140)α and (200)γ at the interface. The atoms in the two phases do not match wholly, and an edge dislocation emerges every six (200)γ crystal planes at the side of γ(Fe, Ni) phase; bright-field TEM image (c) for anomalous eutectic and HRTEM image (d) for the corresponding interface designated as HRTEM1 in Fig. 5(c), where diffraction patterns indicate the constitution at either side, and the disordered atomic arrangement in the phase interface indicates an incoherent interface; HRTEM image (e) for γ(Fe, Ni) phase designated as HRTEM2 in Fig. 5(c), in which the corresponding FFT image shows two sets of diffraction patterns symmetrical to each other. Besides, there are a large number of parallel and alternately shaded stripes marked SF, indicating the existence of stacking faults.
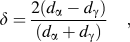
Following the dislocation model of semicoherent interface, the lattice mismatch of two phases, δ could be calculated via
 $${\tf="PSMP10"\char"64} = {{2(d_{\rm{\alpha }} - d_{\rm{\gamma }})} \over {(d_{\rm{\alpha }} + d_{\rm{\gamma }})}}\quad ,$$
with d α and d γ as the interplanar spacing of α and γ planes, respectively. Following the coherent interface theory, δ < 0.05 corresponds to a totally coherent interface, and δ = 0.05−0.25 to a semi-coherent interface, and δ > 0.25 to an incoherent interface. The values of interplanar spacing of (140)α and (200)γ planes are measured to be 0.217 and 0.18 nm. The mismatch δ between the two planes can be calculated to be 0.186 using Eq. (1). Accordingly, this indicates a semicoherent interface. So, it is the semicoherent interface rather than the coherent interface that forms upon cooperative growth; the low-energy interfaces could be realized in cooperative and slow growth processes.
2. Decoupled growth indicated by incoherent interface
A bright-field TEM image for anomalous eutectic (undercooling is 150 K) and HRTEM images for the corresponding interface and γ(Fe, Ni) phase is respectively shown in Figs. 6(c)–6(e). From Fig. 6(d), the diffraction patterns indicate the constitution at either side, and the disordered atomic arrangement in the phase interface indicates a complete mismatch at the interface and in turn, an incoherent interface. As is shown in Sec. IV. B. 1, cooperative growth leads to semicoherent interface for the regular eutectic in Fe40Ni40P14B6 system, whereas for the anomalous eutectic, the loss of relatively low-energy interface indicates a transition from cooperative growth to decoupled growth. As mentioned above, solute trapping favors growth of solid solution γ(Fe, Ni) in collision-limited manner, so that decoupled growth occurs and γ(Fe, Ni) acts as the leading phase. This is supported not only by the fact that γ(Fe, Ni) in anomalous eutectic is supersaturated (see Sec. III. A) but also by the fact that γ(Fe, Ni) phase in anomalous eutectic contains a lot of lattice defects, such as dislocations, stacking faults, and twin crystals; see Fig. 6(e). Clearly, the atomic arrangement at either side of the mark “TB” is symmetrical to each other, with a definite large-angle misorientation and with (111)γ as the mirror plane. In the meantime, the corresponding fast Fourier transform (FFT) image (the upper right inset) shows two sets of diffraction patterns symmetrical to each other, indicating the existence of twin crystals in γ(Fe, Ni) phase. Besides, a large number of parallel and alternately shaded stripes exist in the area marked by “SF,” indicating the existence of stacking faults.
Upon nonequilibrium solidification (ΔT > 120 K), decoupled growth prevails, and the consistent interfacial relation formed at lower undercooling could not sustain any longer, since γ(Fe, Ni) phase grows much faster than (Fe,Ni)3(P,B).
C. Decoupled growth in amorphous crystallization: Disorder trapping
As compared to solidification of undercooled melt, crystallization of amorphous Fe40Ni40P14B6 alloy can be considered as purely kinetic process, with the growth velocity as comparable to the diffusion velocity. Under this circumstance, disorder trapping readily occurs, and supersaturated (Fe,Ni)3(P,B) phase acts as the leading phase, thus giving rise to the decoupled growth. In this section, electron diffraction patterns and HRTEM images of the partially crystallized samples will be reexamined to figure out detailed structural information, thus confirming such a mechanism of decoupled growth.
The diffraction pattern of [1 $\overline 1$0] (Fe,Ni)3(P,B) in Fig. 7(a) shows that besides the sharp diffraction spots, there are streaks in the [110]* reciprocal direction midway between or along these arrays of spots forming continuous lines. The streaks result from planar disorders,Reference Dudzinski, Morniroli and Gantois41 such as twinsReference Watanabe and Scott27 and stacking faults.Reference Wu, Liang and Kuo42 From Fig. 7(b), the HRTEM image corresponding to [1
 $\overline 1$0] (Fe,Ni)3(P,B) of partially crystallized clusters shows no trace of twins but many faulted (110) crystal planes, whose stacking sequence is disturbed in places [see the arrows in Fig. 7(b)]. The loss of periodicity along the perpendicular to the planes generates, in the reciprocal lattice, streaks perpendicular to the faulted planes. The streak direction [110]* in Fig. 7(a) is just perpendicular to the faulted planes (110) in Fig. 7(b). It should be stressed that not only a lateral displacement of a lattice plane but also a changed distribution of atoms in this plane will cause stacking faults; both kinds of planar defects may give rise to similar diffraction effects.Reference Wu, Liang and Kuo42 The former one often occurs in simple crystal structures such as fcc or hcp metals and the latter one occurs in the complex structure. It should be noted that the staking faults considered here correspond to the latter one.
(a) [1 $\overline 1$0] diffraction pattern of (Fe,Ni)3(P,B) phase: besides the sharp diffraction spots, there are also streaks in the [110]* reciprocal direction midway between or along these arrays of spots forming continuous lines. (b) Corresponding HRTEM image of the cluster, many faulted (110) crystal planes, whose stacking sequence is disturbed in places, designated by arrows.
It is concluded in Sec. III. B that disorder trapping leads to the formation of a disordered supersaturated intermetallic (Fe,Ni)3(P,B). Following that, some degree of reordering, which would give rise to the formation of antiphase domains, may take place during the crystallization process.Reference Ahmad, Cochrane and Mullis43 As the domains increase in size and subsequently impinge, the interface between two domains of different ordering will constitute an antiphase boundary (APB),Reference Ahmad, Cochrane and Mullis43 which can be seen as stacking faults due to a change in the distribution of atoms in the faulted plane. Therefore, stacking faults found in the crystallized cluster further confirm that decoupled growth in the amorphous crystallization process is ascribed to disorder trapping of intermetallic growth.
D. Competition between the growths of solid solution and intermetallic
From Sec. III, IV. A–C, it is concluded that, (i) for solidification subjected to small undercooling (less than 120 K), solid solution γ(Fe, Ni) and intermetallic (Fe,Ni)3(P,B) grow in a cooperative manner; (ii) for solidification subjected to sufficiently large undercooling (larger than 120 K), the prevalence of solute trapping leads to decoupled growth and the supersaturated solid solution γ(Fe, Ni) is the leading phase; and (iii) with the undercooling further increasing, disorder trapping prevails, and supersaturated intermetallic (Fe,Ni)3(P,B) becomes the leading phase upon decoupled growth, instead of γ(Fe, Ni). So, the decoupled growth is originated from the competition between the growth of solid solute and intermetallic, which are influenced by solute trapping and disorder trapping, respectively.
1. Phase competition in decoupled growth
In Sec. IV. A, the competition between the coupled growth and decoupled growth is determined by the growth velocities of eutectic and γ(Fe, Ni) dendrite. Similarly, growth velocities of solid solute and intermetallic, which are respectively influenced by solute trapping and disorder trapping, would probably determine the phase competition in the decoupled growth.
Eutectic system Fe40Ni40P14B6, which can be seen as quasi-binary alloy (M80m20, M indicates the metallic element and m indicates the metalloid element), consists of solid solution γ(Fe, Ni) and intermetallic (Fe,Ni)3(P,B). For γ(Fe, Ni), the solute is metalloid elements, P and B; for (Fe,Ni)3(P,B), the solute can be seen as metallic elements, Fe and Ni. For this system, the following two features influence the phase competition in the decoupled growth. On the one hand, the solubility of Fe and Ni in intermetallic (Fe,Ni)3(P,B) is negligible compared to that of P and B in solid solution γ(Fe, Ni). On the other hand, the composition of eutectic point (Fe40Ni40P14B6) is much closer to that of the intermetallic (Fe,Ni)3(P,B) than γ(Fe, Ni). From Appendix, it can be seen that the former feature makes the growth velocity of γ(Fe, Ni) larger than that of (Fe,Ni)3(P,B), whereas the latter feature makes the growth velocity of (Fe,Ni)3(P,B) larger than that of γ(Fe, Ni). Thus, the phase competition is determined by the competition between the effects of the two features on the growth velocity (see Appendix).
2. Coexistence of solute trapping and disorder trapping
Upon nonequilibrium solidification and crystallization of amorphous alloy, only one trapping mechanism, solute trapping or disorder trapping, prevails, and γ(Fe, Ni) or (Fe,Ni)3(P,B) is the leading phase, respectively. However, it could be seen from Appendix, as the leading phase changes from γ(Fe, Ni) to (Fe,Ni)3(P,B), the grow velocities of the two phases could probably become comparable with each other. Then is it possible for the two phases to grow cooperatively again?
So far, the largest undercooling achieved in our free solidification experiments and the smallest undercooling achieved in our amorphous crystallization experiments is 160 and 400 K, respectively. To achieve intermediate undercoolings (160–400 K) and to figure out how the competition between solute trapping and disorder trapping will affect the microstructure of the crystallized phase, rapidly quenched solidification experiments were performed via single roller melt-spinning with the rolling speed range from 15 to 23 m/s. It is considered that the undercooling increases as the rolling speed increases. Figure 8(a) is the x-ray spectrograms of Fe40Ni40P14B6 alloys quenched at different rolling speeds.
(a) X-ray spectrograms of as-quenched Fe40Ni40P14B6 alloys produced in single-roller experiments with different rolling speeds; (b–d) corresponding microstructures of the rapidly quenched samples subjected to the rolling speeds of 15 m/s (b), 19 m/s (c), and 23 m/s (d), respectively.
The ratio (I 43.81/I 41.57), with I 43.81 and I 41.57, respectively, as the intensities of the main diffraction peaks of γ(Fe, Ni) and (Fe,Ni)3(P,B) phases, can character qualitatively the relative contents of the two phases; whose value depends on the rolling speed. When the rolling speed is 15 m/s, I 43.81, designated as γ(Fe, Ni), becomes very large, but I 41.57, designated as (Fe,Ni)3(P,B) phase, becomes negligible. After etched by nital, this sample reveals an equiaxed structure composed of supersaturated solid solution [Fig. 8(b)], corresponding to that observed in free solidification with sufficient undercooling. For the sample subjected to the rolling speed of 19 m/s, the ratio I 43.81/I 41.57 indicates a coexistence of two phases; see the microstructure evolution along the thickness of the sample [Fig. 8(c)]. An equiaxed structure prevails in the portion close to the free surface (corresponding to relatively small undercooling), analogous to that in Fig. 8(b); a regular eutectic structure with lamellar spacing as about 30 nm prevails in the middle portion of the sample, where analogous to the structure observed upon near-equilibrium solidification, the continuous bright phase is intermetallic (Fe,Ni)3(P,B), and the dark phase is solid solution γ(Fe, Ni); a bright-faceted dendritic phase appears in the portion close to the contact surface (corresponding to relatively large undercooling), which can be deduced as intermetallic (Fe,Ni)3(P,B). As the rolling speed is increased up to 23 m/s, amorphous diffusive and crystalline peaks are all present in the spectrogram; subtracting the amorphous diffuse peak from the spectrogram leads to a value of I 43.81/I 41.57 close to that of the pure intermetallic phase. The as-obtained metallographic structure [Fig. 8(d)] is similar to those of the partially crystallized amorphous foils discussed in Sec. III. B. Furthermore, TEM and EDS analysis evidence the existence of the crystallized phase as (Fe,Ni)3(P,B) with the composition close to the average composition of the alloy; this structure corresponds to the extremely large undercooling as that achieved upon amorphous crystallization.
Therefore, some structures analogous to those obtained upon free solidification [Figs. 1(b) and 1(c)] and upon amorphous crystallization (Fig. 3) can be observed in the rapidly quenched solidification experiments. Solute trapping and disorder trapping occur, provided the rolling speed becomes 15 and 23 m/s, corresponding to relatively small and large undercooling, respectively. Whereas, subjected to intermediate undercoolings, the cooperative growth of eutectic phases prevails again.
V. CONCLUSIONS
(1) For solidification subjected to negligible undercooling, solid solution γ(Fe, Ni) and intermetallic (Fe,Ni)3(P,B) grow in a cooperative manner; the phase interface is semicoherent.
(2) For solidification subjected to sufficiently large undercooling (larger than 35 K), anomalous eutectic forms. Both the coupled growth and decoupled growth could lead to anomalous eutectic. When the undercooling is less than 120 K, the anomalous eutectic results from remelting of the regular eutectic phase. When the undercooling is larger than 120 K, the prevalence of solute trapping leads to supersaturated solid solution γ(Fe, Ni), which leads to decoupled growth; the anomalous eutectic results from remelting of γ(Fe, Ni) dendrite; the phase interface is incoherent; there exist a lot of defects in γ(Fe, Ni).
(3) For amorphous crystallization, supersaturated intermetallic (Fe,Ni)3(P,B) becomes the leading phase upon decoupled growth, instead of γ(Fe, Ni); there exist a lot of APB in the supersaturated intermetallic.
(4) Solute trapping and disorder trapping could also occur in the rapidly quenched solidification experiments, provided the rolling speed becomes 15 and 23 m/s, corresponding to relatively small and large undercooling, respectively. Whereas, subjected to intermediate undercoolings, the cooperative growth of eutectic phases prevails again.
ACKNOWLEDGMENTS
The authors are grateful to China National Funds for Distinguished Young Scientists (Grant No. 51125002), National Basic Research Program of China (973 Program, Grant No. 2011CB610403), Free Research Fund of State Key Lab of Solidification Processing (Grant No. 84-TZ-2013), the 111 Project (Grant No. B08040), the Natural Science Foundation of China (Grant Nos. 51071127 and 51134011), and the fundamental Research Fund of Northwestern Polytechnical University (Grant No. JC20120223).
APPENDIX—THEORETICAL ANALYSIS OF PHASE COMPETITION
Crystalline growth of an alloy shows much more complexity than that of a pure material. Besides the advancement of the interface, one also needs to consider the solute redistribution across the interface.Reference Aziz and Boettinger12 When the interface conditions deviate significantly from the local equilibrium, one needs to consider a nonequilibrium partition coefficient, k. Several models have been developed to correlate the nonequilibrium partition coefficient, k, with the interface conditions, and the most widely used model for a dilute binary alloy is of AzizReference Aziz and Boettinger12:
 $$k(v) = {{{X_{\rm{S}}}} \over {{X_{\rm{L}}}}} = {{\left( {{k_{\rm{e}}} + {v \over {{v_{\rm{d}}}}}} \right)} \mathord{\left/ {\vphantom {{\left( {{k_{\rm{e}}} + {v \over {{v_{\rm{d}}}}}} \right)} {\left( {1 + {v \over {{v_{\rm{d}}}}}} \right)}}} \right. \kern-\nulldelimiterspace} {\left( {1 + {v \over {{v_{\rm{d}}}}}} \right)}}\quad ,$$
where k is the ratio of the solute concentration in the growing solid (X S) to that in the liquid (X L) at the interface, k e is the equilibrium value of k, v is the interface velocity, and v d is the diffusive speed discussed above. From this equation, it is evident that when the interface velocity is much larger than the interface diffusion velocity, k approaches unity and “partitionless” solidification can occur.
For metallic alloys, a collision-limited relationship is assumed between velocity and driving force under all circumstances.
 $$v(T,{X_{\rm{S}}},{X_{\rm{L}}}) = {v_{\rm{S}}}[1 - \exp (\Delta {G_{{\rm{eff}}}}(T,{X_{\rm{S}}},{X_{\rm{L}}})/RT)]\quad ,$$
where ΔG eff is the entire free energy dissipated at the interface, R the universal gas constant, T the interfacial temperature and the kinetic prefactor, v s is the rate of the forward flux alone, and corresponds to the hypothetical maximum growth velocity at infinite driving force.
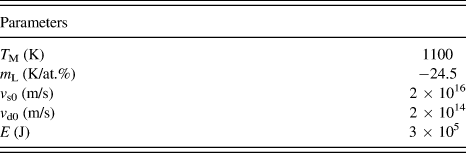
Since the undercooling is relatively small, solute diffusivity in undercooled free solidification is treated to be independent of underccoling for simplicity, and the values of v s and v d are assumed to be constants (in Aziz's model,Reference Aziz and Boettinger12v s is assumed to be the velocity of sound, much larger than v d). So the S–L interface velocity is only thermodynamic-controlled and increases continuously with the undercooling. However, this deviates a lot from Wang's experimentReference Aziz and Kaplan19 about the solidification of Fe–10%Sb system, where the growth velocity of α-Fe dendrite does not always increase with the undercooling but for extremely large undercooling, decreases with the undercooling. So, for large undercooling (that is the case for amorphous crystallization), solute diffusivity is highly dependent on temperature, and v s and v d could not be treated as constants. Here, the Arrhenius relationship is assumed for v s and v d:
 $${v_{\rm{s}}} = {v_{{\rm{s0}}}}\exp ( - E/RT)\quad ,$$
 $${v_{\rm{d}}} = {v_{{\rm{d0}}}}\exp ( - E/RT)\quad ,$$
where v s0 and v d0 are constants and E is the activation energy.
If the liquid and solid phases are sufficiently dilute that Henry's law is valid, an expression for ΔG eff can be obtainedReference Aziz and Boettinger12 as
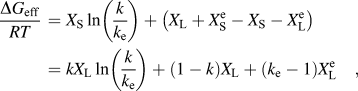 $${{{\rm{\Delta }}{G_{{\rm{eff}}}}} \over {RT}}\, = {X_{\rm{S}}}\ln \left( {{k \over {{k_{\rm{e}}}}}} \right) + \left( {{X_{\rm{L}}} + X_{\rm{S}}^{\rm{e}} - {X_{\rm{S}}} - X_{\rm{L}}^{\rm{e}}} \right) = k{X_{\rm{L}}}\ln \left( {{k \over {{k_{\rm{e}}}}}} \right) + \left( {1 - k} \right){X_{\rm{L}}} + \left( {{k_{\rm{e}}} - 1} \right)X_{\rm{L}}^{\rm{e}}\quad ,$$
where  $X_{\rm{S}}^{\rm{e}}$ and
 $X_{\rm{L}}^{\rm{e}}$ are the equilibrium values of X S and X L, respectively. If the phase diagram liquidus and solidus boundaries are linear for the compositions of interest, they can be described by
 $$T = {T_{\rm{M}}} + m_{\rm{L}}^{\rm{e}}X_{\rm{L}}^{\rm{e}}\quad {\rm{(liquidus)}}\quad ,$$
 $$T = {T_{\rm{M}}} + m_{\rm{S}}^{\rm{e}}X_{\rm{S}}^{\rm{e}}\quad {\rm{(solidus)}}\quad .$$
Eutectic system Fe40Ni40P14B6 consists of solid solution γ(Fe, Ni) and intermetallic (Fe,Ni)3(P,B). On one hand, because the solubility of Fe and Ni in intermetallic (Fe,Ni)3(P,B) is negligible compared to that of P and B in solid solution γ(Fe, Ni), the value of k e ( $X_{\rm{S}}^{\rm{e}}$/
 $X_{\rm{L}}^{\rm{e}}$) is smaller for intermetallic than for the solid solution. On the other hand, because the composition of eutectic point (Fe40Ni40P14B6) is much closer to that of the intermetallic (Fe,Ni)3(P,B) than γ(Fe, Ni), the value of X L is smaller for (Fe,Ni)3(P,B) than for γ(Fe, Ni), assuming that X L does not change during the transformation.
Free energy, ΔG eff has significant impact on interface velocity. Larger absolute value of ΔG eff/RT (ΔG eff/RT is negative) suggests larger interface velocity. Take the derivative of Eq. (A4) with respect to k e and X L, respectively.
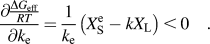 $${{\partial {\textstyle{{\Delta {G_{{\rm{eff}}}}} \over {RT}}}} \over {\partial {k_{\rm{e}}}}} = {1 \over {{k_{\rm{e}}}}}\left( {X_{\rm{S}}^{\rm{e}} - k{X_{\rm{L}}}} \right) \,\lt \,0\quad .$$
 $${{\partial {{\Delta {G_{{\rm{eff}}}}} \over {RT}}} \over {\partial {X_{\rm{L}}}}} = k\ln \left( {{k \over {{k_{\rm{e}}}}}} \right) + \left( {1 - k} \right) > 0\quad .$$
It can be seen for Eq. (A6) that the increase in k e and the decrease in X L make the free energy and the interface velocity increase. Take the derivative of Eqs. (A6a) and (A6b) with respect to k, respectively.
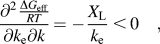 $${{{\partial ^2}{{\Delta {G_{{\rm{eff}}}}} \over {RT}}} \over {\partial {k_{\rm{e}}}\partial k}} = - {{{X_{\rm{L}}}} \over {{k_{\rm{e}}}}}\, \lt\, 0\quad ,$$
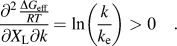 $${{{\partial ^2}{{\Delta {G_{{\rm{eff}}}}} \over {RT}}} \over {\partial {X_{\rm{L}}}\partial k}} = \ln \left( {{k \over {{k_{\rm{e}}}}}} \right) > 0\quad .$$
It can be seen for Eq. (A7) that as k increases (induced by the increase in the growth velocity), the extent of influences of k e and X L on the growth velocity decreases and increases, respectively.
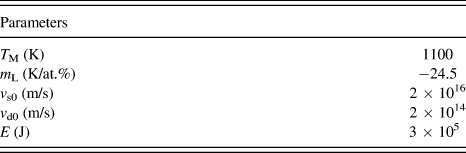
To further illustrate how k e and X L influence the growth velocity, the full numerical solution of the equation set [Eqs. (A1)–(A5)] is plotted in Fig. A1, which is interface temperature versus relative velocity (v/v s) or k for fixed X L. The parameters used in the calculation are listed in Table A1. Curve II and curve I correspond to the same X L value but to different k e values ( $k_{\rm{e}}^{{\rm{II}}}$ >
 $k_{\rm{e}}^{\rm{I}}$), and the growth velocity of curve II is larger than that of curve I at the same temperature (Fig. A1a); curve I and curve III correspond to the same k e value but to different X L values (
 $X_{\rm{L}}^{{\rm{III}}}$ >
 $X_{\rm{L}}^{\rm{I}}$), and the growth velocity of curve I is larger than that of curve III at the same temperature (Fig. A1b); curve I and curve IV correspond to different k e and X L values (
 $k_{\rm{e}}^{{\rm{IV}}}$ >
 $k_{\rm{e}}^{\rm{I}}$,
 $X_{\rm{L}}^{{\rm{IV}}}$ >
 $X_{\rm{L}}^{\rm{I}}$), and the growth velocity of curve IV is larger than that of curve I when k is relatively small, the result is just opposite when k is relatively large (Fig. A1c). For Fe40Ni40P14B6 eutectic system, the intermetallic (Fe,Ni)3(P,B) has smaller values of k e and X L compared to the solid solution γ(Fe, Ni), which is like the case of curve I and curve IV (Fig. A1c). Therefore, as the undercooling increases (k increases), the leading phase in the decoupled growth of Fe40Ni40P14B6 eutectic system is γ(Fe, Ni) at first, and (Fe,Ni)3(P,B) at last. Moreover, as the leading phase changes from γ(Fe, Ni) to (Fe,Ni)3(P,B), the growth velocities of the two phases could probably become comparable with each other.
Interface temperature versus velocity, numerical solution of Eqs. (A1)–(A5) for fixed X L. To demonstrate how k e and X L influence the interface velocity, the different values of k e and X L are adopted: (a)  $k_{\rm{e}}^{{\rm{II}}}$ >
 $k_{\rm{e}}^{\rm{I}}$,
 $X_{\rm{L}}^{{\rm{II}}}$ =
 $X_{\rm{L}}^{\rm{I}}$; (b)
 $k_{\rm{e}}^{{\rm{III}}}$ =
 $k_{\rm{e}}^{\rm{I}}$,
 $X_{\rm{L}}^{{\rm{III}}}$ >
 $X_{\rm{L}}^{\rm{I}}$; (c)
 $k_{\rm{e}}^{{\rm{IV}}}$ >
 $k_{\rm{e}}^{\rm{I}}$,
 $X_{\rm{L}}^{{\rm{IV}}}$ >
 $X_{\rm{L}}^{\rm{I}}$.