




No CrossRef data available.
Article contents
Neural basis for impaired time reproduction in Parkinson's disease: An fMRI study
Published online by Cambridge University Press: 12 February 2004
Abstract
Studies involving brain-lesioned subjects have used the paced finger tapping (PFT) task to investigate the neural systems that govern motor timing. Patients with Parkinson's disease (PD), for example, demonstrate abnormal performance on the PFT, characterized by decreased accuracy and variability changes, suggesting that the basal ganglia may play a critical role in motor timing. Consistent with this hypothesis, an fMRI study of healthy participants demonstrated that the medial frontostriatal circuit (dorsal putamen, ventrolateral thalamus, SMA) correlated with explicit time-dependent components of the PFT task. In the current fMRI study, PD patients and healthy age-matched controls were imaged while performing the PFT. PD patients underwent 2 imaging sessions, 1 on and the other off dopamine supplementation. Relative to controls, PD patients were less accurate and showed greater variability on the PFT task relative to controls. No PFT performance differences were observed between the on and off medication states despite significantly greater motor symptoms on the Unified Parkinson's Disease Rating Scale (UPDRS) in the off medication state. Functional imaging results demonstrated decreased activation within the sensorimotor cortex (SMC), cerebellum, and medial premotor system in the PD patients compared to controls. With dopamine replacement, an increase in the spatial extent of activation was observed within the SMC, SMA, and putamen in the PD patients. These results indicate that impaired timing reproduction in PD patients is associated with reduced brain activation within motor and medial premotor circuits. Despite a lack of improvement in PFT performance, PD patient's brain activation patterns were partially “normalized” with dopamine supplementation. These findings could not be attributed to greater head movement artifacts or basal ganglia atrophy within the PD group. (JINS, 2003, 9, 1088–1098.)
Keywords
Information
- Type
- THEMATIC ARTICLES
- Information
- Journal of the International Neuropsychological Society , Volume 9 , Issue 7 , November 2003 , pp. 1088 - 1098
- Copyright
- © 2003 The International Neuropsychological Society
INTRODUCTION
Skilled actions require precisely timed movements. A novice musician, for instance, will rely on a metronome to maintain a specified rhythm. With practice, the temporal representation is internalized and the metronome is no longer required. Contemporary research posits the existence of an internal timekeeping system that is independent of sensory or motor feedback (Ivry & Keele, 1989; Sergent et al., 1993; Wing & Kristofferson, 1973). Much of this research is based on an examination of interresponse interval (IRI) variability on the paced-finger tapping (PFT) task. In this task, subjects tap their index finger in response to the presentation of a series of tones, separated by a constant interval (synchronization condition), typically in the subsecond range. The auditory pacing stimulus is then discontinued, and the subject continues to tap at the same pace (continuation condition). During this latter condition when the tone is absent, it is possible to assess central timing, because timing competency is dependent on an internal representation of the target interval duration.
The PFT task has been administered to brain-lesioned patients to identify potential neural circuitry critical to internal timekeeping. In a series of experiments primarily involving patients with focal lesions of the cerebellum, Ivry, Keele and colleagues (Ivry et al., 1988; Keele & Ivry, 1989, 1990) have suggested that the lateral cerebellum and its primary output, the dorsal dentate nucleus, are involved in timekeeping operations. Patients with Parkinson's disease also demonstrate abnormal timekeeping variability on the PFT task (Ivry & Keele, 1989; Pastor et al., 1992a), even when receiving dopaminergic replacement therapy (O'Boyle et al., 1996). Pathological changes in Parkinson's disease include a loss of nigral dopaminergic neurons projecting to the dorsal putamen (Brooks et al., 1990). The major output of the dorsal putamen is the ventrolateral thalamus, which in turn projects to the supplementary motor area (SMA) (Alexander et al., 1986). Unmedicated PD patients exhibit faster mean IRIs than control subjects on the PFT (Ivry et al., 1989) and demonstrate greater IRI variability than controls and medicated PD patients (O'Boyle et al., 1996). Other studies indicate that medicated PD patients tap faster and show greater variability than controls at intervals between 167 and 600 ms (Harrington et al., 1998; Konczak et al., 1997).
Functional imaging studies provide an alternative method for isolating the neural components of the internal timekeeping system. In an fMRI study using 300 or 600 ms pacing intervals in healthy individuals, Rao et al. (1997) found that right index finger tapping activated the left sensorimotor cortex and right cerebellum (dorsal dentate nucleus) during both the synchronization and continuation conditions. During the continuation condition, which stresses the internal timekeeping system, the medial premotor system (SMA, left putamen, and left ventrolateral thalamus) was activated. The continuation condition also activated a region within the right inferior frontal gyrus and superior temporal gyrus. These results suggested that timed movements are dependent on three interrelated neural systems, one that is involved in explicit timing (putamen, ventrolateral thalamus, SMA), another that mediates auditory working memory (inferior frontal gyrus, superior temporal gyrus), and a third that involves sensorimotor processing (dorsal dentate nucleus, sensorimotor cortex).
Functional imaging studies using the PFT task have not been reported in PD patients. Two studies have examined reproduction of slowly paced (3 and 15 s intervals), right-sided movements (Haslinger et al., 2001; Playford et al., 1993). Compared with a control group, PD patients both off and on levodopa showed movement-related impaired activation in the preSMA (located rostral to the SMA) and increased activation in the left sensorimotor region and lateral premotor cortex bilaterally. Levodopa led to a relative normalization of the impaired activation in the preSMA and decreased signal levels in the sensorimotor, lateral premotor, and superior parietal cortex. The significance of these studies for understanding movement timing is unclear given the slow and unpredictable pacing intervals and the absence of a continuation condition that stresses internal timekeeping processes.
The goal of the current fMRI study was to identify possible neural correlates that underlie abnormal timing behavior in patients with PD, as reflected by the PFT task. This study had two aims: (1) to compare the brain activation maps generated from PD and demographically matched healthy control subjects during PFT performance, and (2) to compare brain maps generated from PD patients when on and off dopaminergic replacement therapy. The interpretation of functional imaging results can be ambiguous when critical brain regions have demonstrated atrophic changes on structural brain images. In light of the critical role of the basal ganglia in PD pathology and in performance on the PFT task in normal individuals (Rao et al., 1997), we measured the volume of the putamen from structural MR scans. Based on previous volumetric measurements of the putamen in PD patients (Ghaemi et al., 2002), we did not expect to see significant atrophic changes in this structure.
METHODS
Research Participants
Parkinson's disease
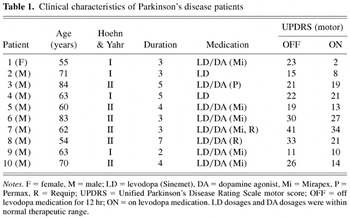
Ten individuals with mild idiopathic PD (9 males; M age = 65.9 years; M education = 15.0 years) participated in the study (Table 1). PD participants were strongly right handed, as determined by the Edinburgh Handedness Inventory (Oldfield, 1971). All patients were 3–7 years post disease onset (M = 3.9 years) and did not exceed stage II of the Hoehn & Yahr (1967) Scale on or off medication. Participants were administered a brief neuropsychological test battery, consisting of the Mini-Mental State Examination (MMSE) (Folstein et al., 1975), the Unified Parkinson's Disease Rating Scale (UPDRS) (Fahn et al., 1987), and a quantitative motor assessment, the Core Assessment Program for Surgical Intervention Therapies in Parkinson's Disease (CAPSIT–PD; Defer et al., 1999). The CAPSIT–PD consisted of two timed tasks: (1) Hand/Arm Movement Between Two Points Test, which requires subjects to tap their index finger between two points placed 20 cm apart horizontally for 10 cycles of tapping; and (2) Finger Dexterity Test, which requires subjects to tap the thumb with the forefinger and then with each finger in rapid succession 10 times. PD symptoms were primarily akinetic-rigid. Mild resting tremor (UPDRS tremor ratings 1–2 in affected limbs) was present in 6 patients (5 left limb affected, 1 bilateral). All patients were on a stable regimen of levodopa/carbidopa (Sinemet) therapy. Eight of the 10 participants were also taking dopamine agonists.
Clinical characteristics of Parkinson's disease patients

PD participants were scanned over two sessions separated by approximately 1 month. During the ON session, participants took their typical dosage of levodopa/carbidopa. In the OFF session, participants were required to stop taking levodopa/carbidopa a minimum of 12 hr prior to and during the scanning session. Participants continued to take dopamine agonist medications during both scanning sessions. The order of the ON and OFF sessions was counterbalanced across participants.
Healthy controls
Thirteen, strongly right-handed, healthy volunteers (8 males; M age = 63.5 years; education = 14.8 years) were recruited primarily from family and friends of PD patients and from newspaper advertisements. Control participants were scanned during a single session.
For both groups, the following exclusion criteria were applied: (1) past history of neurological or psychiatric illness (excluding PD in the patient group); (2) prior exposure to psychoactive agents or drug use; (3) past medical history of hypertension, cardiovascular disease, diabetes mellitus, endocrine disorders, renal disease, glaucoma, or chronic pulmonary disease; and (4) Mini-Mental State Exam (MMSE) score less than 28. Patients with severe ON drug dyskinesias were not included due to the movement artifact that would occur during imaging.
Paced Finger Tapping (PFT) Task
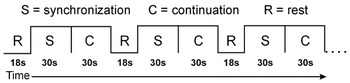
The PFT consisted of two test conditions (see Figure 1): synchronization (S) and continuation (C). In the S condition (30 s), participants made right index finger key presses in synchrony with a series of isochronous tones (interstimulus interval = 600 ms). In the C condition (30 s), the auditory stimulus was discontinued and participants were instructed to continue to tap at the same pace, but without benefit of the auditory metronome. These two consecutive conditions were preceded and followed by a rest (R) period (18 s). The S, C, and R periods were designated using the visual cues, “TAP,” “CONTINUE,” and “REST,” respectively. The visual cues remained on the screen for the duration of each condition. The S–C–R cycle was repeated five times during a single imaging run (total duration = 6.8 min). Participants briefly practiced the task prior to scanning.

Timeline for functional imaging run involving paced finger tapping task.
Sounds were amplified near the scanner using a magnetically shielded transducer system and were delivered to the participants via air conduction through 180 cm paired plastic tubes. The tubes were threaded through tightly occlusive ear inserts that attenuated background scanner noise to approximately 75 dB sound pressure level (SPL). The auditory stimulus (pacing tones) consisted of trains of 50 ms, 380 Hz pure tones presented binaurally with average tone intensity of 100 dB SPL. Background scanner noise consisted of pulses occurring every 205 ms; this pulse was constant throughout the imaging run. Instructional cues were computer-generated and rear-projected onto the center of an opaque screen located at the subject's feet. Participants viewed the screen in a darkened room through prism glasses and corrective lenses, if necessary. IRIs that were 50% higher (900 ms) or lower (300 ms) than the target duration were excluded from further analysis. Such exclusions, which resulted from subjects failing to fully depress the response key, occurred on approximately 5% of trials. No between group (PD vs. controls) or within group (PD ON vs. PD OFF) differences were observed in the mean number of excluded responses.
Two PFT performance measures, mean IRI and response variability, were evaluated. The mean IRI was calculated for each condition (S and C) across all runs for each subject. For illustrative purposes, the mean IRI was subtracted from a constant value, the target intertap interval (600 ms). One-way analyses of variance were performed separately for each task (S, C) examining the main effect of group (controls, PD ON and PD OFF). Pair-wise comparisons for each group type were tested using the Bonferroni correction for multiple comparisons.
Response variability measures the degree to which a subject's response varies between groups or across conditions. The within-subject variability for each group/condition was estimated by using a one-way analysis of variance to control for the individual's mean IRI. Because of the large number of observations within a subject, these estimates will be estimated with good precision (i.e., result in a large number of degrees of freedom). Consequently, the IRI variability for a group is estimated by the pooled within-subjects mean square error (Winer, 1971). The variance estimates for within-subject variation were then used to test response variability between groups/conditions with the usual F test for homogeneity of variance (Winer, 1971) for PFT condition (S, C) and group (C vs. PD ON, C vs. PD OFF, PD ON vs. PD OFF) differences.
Volumetric MRI Measurements
Volumetric measurements of the putamen were outlined on the high-resolution anatomical images by a rater blind to group assignment. The outline of the structure was traced on every other slice using a mouse-controlled cursor, and the boundary line was interpolated using the Gyrus Finder plug-in of AFNI. Tracings were completed in the axial plane and remeasured in the sagittal and coronal planes. The inferior boundary was defined by the anterior commissure, medial boundary by the globus pallidus or genu and posterior limb of the internal capsule, the anteromedial boundary by the anterior limb of internal capsule, and the lateral boundary by the external capsule and claustrum.
fMRI Acquisition
Whole-brain fMRI was performed on a 1.5 Tesla General Electric Signa scanner equipped with a 3-axis local gradient head coil and an elliptical endcapped quadrature radiofrequency coil. Foam padding was used to limit head motion within the coil. Echo-planar images were collected using a single-shot, blipped gradient-echo echo-planar pulse sequence (TE = 40 ms, TR = 3.0 s, 90° flip angle, FOV = 240 mm, matrix = 64 × 64). Twenty-two contiguous sagittal 6 mm thick slices were collected to provide coverage of the entire brain (voxel size 3.75 × 3.75 × 6 mm). Overall, a total of 136 images were collected per run. Prior to functional imaging, high-resolution, three-dimensional, spoiled gradient-recalled at steady-state (GRASS) anatomic images were collected (TE = 5 ms, TR = 24 ms, 40° flip angle, NEX = 1, slice thickness = 1.2 mm, FOV = 24 cm, matrix = 256 × 128) for anatomic localization and co-registration.
fMRI Image Processing and Statistical Analysis
Functional images were generated using the Analysis of Functional NeuroImages (AFNI) software package (Cox, 1996, 1997). Each image time series was spatially registered in three-dimensional space to minimize the effects of head motion using an iterative, linear, least squares method. Output from this analysis was used to evaluate the extent of head motion during scanning in the control and PD patients (see Results). Multiple regression was used to analyze individual time series data for each participant. Multiple regression parameters included baseline rest (R), a linear trend, and boxcar regressors for synchronization and continuation periods delayed 3 s to allow for the rise and fall of the hemodynamic response. These analyses tested the degree to which the stimulus time series predicted neural activation, measured by the hemodynamic response, to the S and C conditions on a voxel-wise basis.
Individual SPGR anatomical scans and functional maps from the multiple regression were linearly interpolated to 1 mm3 voxels and transformed into standard stereotaxic space (Talairach & Tournoux, 1988). Functional images were blurred using a 6 mm Gaussian full-width half-maximum (FWHM) filter to compensate for intersubject variability in anatomic and functional anatomy (Thompson et al., 1996).
Functional images for the Control and PD subjects were generated using t-tests examining differences between each of the two active conditions (S or C) versus the R condition. An activated region was defined by an individual voxel probability of p < .005 for both control subjects (t > 3.43, df = 12) and PD patients (t > 3.58, df = 9). A minimum cluster size threshold (150 μL) was adopted to minimize false positive activation clusters from the maps (Forman et al., 1995).
For purposes of this study, the key variable of interest was the differences in the location and spatial extent of the activation foci in the brain maps of the controls, PD-ON and PD-OFF. This was accomplished by examining the conjoint activation maps comparing Controls and PD-ON, controls and PD-OFF, and PD-ON and PD-OFF.
RESULTS
PFT Task Performance
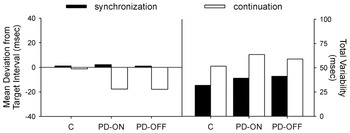
Figure 2 displays the mean deviation from the target interval (left panel) and total variability (right panel) for the S and C conditions for the controls, PD ON, and PD OFF groups. Results for the S condition demonstrate that PD participants both ON and OFF medication were able to synchronize finger tapping in response to the auditory metronome as accurately as controls [F(2,6920) = 1.35, p > .25]. However, during the C condition, there was a significant main effect of group [F(2,8123) = 94.27, p < .0001]. Controls reproduced the target interval more accurately than the PD participants, either OFF [t(4599) = 11.89, p < .001] or ON [t(4513) = 12.30, p < .001] medication. This inaccuracy in the PD participants was due to an IRI “shortening” during the C condition (Figure 2).

Mean deviation from the 600 ms target interval (left panel) and total variability (right panel) as a function of task condition (synchronization, continuation) for the C (controls), PD ON, and PD OFF groups. Total variability = standard deviation of inter-response intervals.
Analyses of response variability (calculated from the standard deviation of the IRIs) indicated that the controls were significantly less variable than the PD patients for the S condition, both OFF [F(2101,2770) = 1.67, p < .001] and ON [F(2019,2770) = 1.50, p < .001] medication. IRI variability for the S condition did not differ as a function of drug state in the PD participants. The same pattern of results was observed during the C condition. PD patients were significantly more variable than controls, both OFF [F(2480,3137) = 1.17, p < .001] and ON [F(2476,3137) = 1.31, p < .001] medication. Variability in the PD patients did not differ as a function of drug state for the C condition.
Anatomical MRI Findings
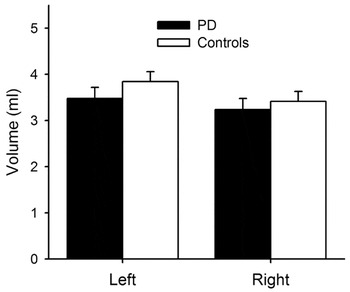
Volumetric measurements of the left and right putamen were slightly smaller in the PD group relative to the control subjects, but these differences were not significant (Figure 3).

Mean volume (ml) of left and right putamen for the PD and control participants. Error bars = standard error of the mean.
Functional MRI Findings
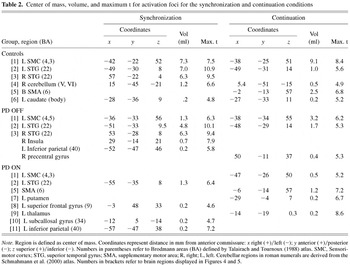
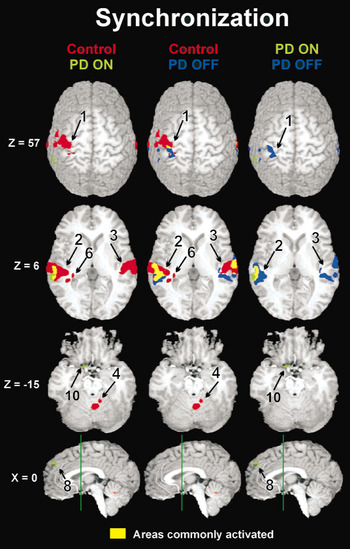
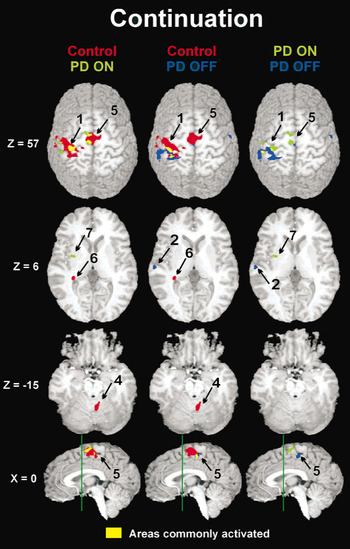
The center of mass, volume, and peak intensity (maximum t) of the activation foci for controls, PD-ON and PD-OFF are presented in Table 2 for both the S and C conditions. Figures 4 and 5 present the activation maps for the S and C conditions, respectively. For both figures, brain areas demonstrating unique activation for controls are shown in red, PD OFF in blue, and PD ON in green. Regions of common activation are displayed in yellow.
Center of mass, volume, and maximum t for activation foci for the synchronization and continuation conditions


Areas of significantly increased MR signal intensity for the synchronization condition. Maps indicate areas activated greater by the S than R condition. Areas shown in red were uniquely activated by controls (red), blue by PD OFF, and green by PD ON. Regions of common activation are displayed in yellow. Z indicates mm above (+) or below (−) the anterior-posterior commissure (AC–PC) line. The green line in the midsagittal images (x = 0) is perpendicular to the AC–PC line and is positioned at the anterior commissure (y = 0). Numbers adjacent to activation foci correspond to numbers in brackets in Table 2.

Areas of significantly increased MR signal intensity for the continuation condition. Maps indicate areas activated greater by the C than R condition. See Figure 4 legend for details.
As expected from our previous fMRI study conducted with young subjects (Rao et al., 1997), robust activation of the left sensorimotor cortex (SMC), bilateral superior temporal gyrus (STG), and right cerebellum was observed during the S condition (Figure 4). The PD patients, either ON or OFF medication, showed a reduced spatial extent of activation relative to the controls, with the only region of overlap occurring in the STG. In the SMC, the area of activation for the PD group (ON and OFF) was located more caudal to that observed in the control subjects. Levodopa had relatively little effect on the S task.
In our previous fMRI study (Rao et al., 1997), the C condition (Figure 5), which taxes the internal timekeeping system (because subjects must tap without benefit of the metronome), resulted in additional activation of the medial premotor circuit (SMA, putamen, and thalamus). The older subjects in this study activated the SMA, but not the putamen or thalamus. Activation of the putamen and thalamus, however, was observed in the PD patients when they were ON, but not OFF, medication (Table 2). The SMA was not activated in the PD patients while OFF medication; however, activation was observed during the ON state, albeit smaller in spatial extent than the controls. In addition, the PD patients ON medication had more rostral activation of the SMC, similar to the maps of the control subjects and unlike that of the patients when OFF medication. Unlike the controls, no activation was observed in the right cerebellum of the PD patients either ON or OFF medication. As expected, reduced activation was observed in the STG in the controls and PD patients due to the absence of the auditory stimulus.
Head Movement Analyses
To examine the hypothesis that the differences in brain maps between the PD ON, PD OFF, and Controls may be due to increased head motion in the PD patients, the mean and standard deviation of six movement parameters (x, y, and z plane in mm; pitch, yaw, and roll in degrees) were derived for each of the imaging runs prior to motion correction. No statistically significant differences (p > .20) were observed between the PD and control subjects and between PD patients ON and OFF medications on any of the 12 variables.
Neuropsychological Test Findings
All PD patients showed improvement (signified by a lower score) on the UPDRS motor scale during the ON (M = 17 ± 9.53) relative to OFF (M = 24 ± 8.86) levodopa sessions (Table 1). This difference was statistically significant [t(9) = 3.28, p < .01]. The UPDRS activities of daily living scale was also significantly improved ON (M = 9 ± 4.2) relative to OFF (M = 13 ± 5.8) levodopa [t(9) = 2.9, p < .02]. This resulted in an overall significant improvement in the total UPDRS score comparing ON (M = 30 ± 10.7) relative to OFF (M = 41 ± 13.6) levodopa [t(9) = 3.85, p < .005]. Measurement of performance parameters on the CAPSIT were not significantly different between ON (M = 36 ± 8.90) and OFF (M = 37 ± 8.94) drug conditions (p > .20). No differences were observed between the PD patients (M = 29 ± 2.4) and healthy controls (M = 29 ± 1.4) on the MMSE.
DISCUSSION
Several conclusions may be drawn from this study. First, PD patients demonstrated impairments on the PFT, characterized by a reduction in the IRI during the continuation condition and an increase in total variability during both the synchronization and continuation conditions. Second, PD patients demonstrated an overall reduction in brain activity relative to controls, most notably in the sensorimotor cortex and cerebellum during both the synchronization and continuation conditions, and in the SMA during the continuation condition. Third, despite improvements in the UPDRS motor scale with levodopa treatment, no differences in PFT accuracy and variability were observed in PD patients between the ON or OFF levodopa states. Fourth, despite the absence of a behavioral improvement on the PFT, PD patients taking levodopa exhibited a partial normalization in their brain activation patterns relative to control subjects, characterized by increased activation of the medial frontostriatal circuit (SMA, thalamus, and putamen) during the continuation condition. Finally, the functional imaging results could not be attributed to potential imaging artifacts associated with increased head movements in the PD group or increased atrophy associated with PD pathology (i.e., reduced size of the putamen).
PFT Task and Normal Aging
Consistent with our previous fMRI study of motor timing conducted on young healthy subjects (Rao et al., 1997), our elderly control participants demonstrated a significant increase in activity within the SMA during the continuation condition, emphasizing this structure's role in the explicit timing of repetitive movements. As in our previous study, both the sensorimotor cortex and the cerebellum were activated to a similar extent during both the synchronization and continuation conditions, indicating that these structures are more closely tied to sensorimotor processing than explicit timing. Unlike our previous study, activation within the contralateral putamen and thalamus during the continuation condition was not observed in our elderly subjects. These findings may reflect a pattern of reduced activation resulting from the effects of normal aging. Postmortem and functional imaging studies in humans have demonstrated age-dependent decline of brain dopamine levels (Kaasinen & Rinne, 2002).
An alternative explanation is that the young subjects in our previous study (Rao et al., 1997) performed the PFT task differently than the older healthy subjects in the present study. Mean accuracy and variability for the young subjects on the synchronization (M deviation from target IRI = −1.95 ms; SD = 40.07) and continuation (M deviation = 4.16 ms; SD = 47.28) conditions were comparable to those of the older subjects (Figure 2) on the synchronization (M deviation = 1.12 ms; SD = 31.95) and continuation (M deviation = −1.22 ms; SD = 51.67) conditions. Thus, these slight and nonsignificant performance differences are unlikely to explain the age-related differences in functional brain imaging findings.
It is also conceivable that activation within the putamen and thalamus may not have survived our individual voxel probability and minimum cluster size thresholds. Reducing the voxel probability level and eliminating the cluster size thresholds, however, did not result in activation within these structures. The differences could not be attributed to unequal sample sizes (n = 13 for both studies), but could be related to the higher noise levels in activated voxels of elderly subjects, resulting in lower signal-to-noise ratios (Huettel et al., 2001). Further work with larger sample sizes stratified over age decades is needed to examine possible aging effects on the neural systems that govern motor timing.
PFT Task Performance, Functional Imaging, and PD
PD patients both on and off medication exhibited abnormal PFT performance, characterized by reduced IRI and increased variability during the continuation condition. These results are consistent with previous reports of PD patients underestimating time intervals, suggesting an alteration in the internal clock (Pastor et al., 1992b). It has been suggested that the basal ganglia functions as a clock-counter system, wherein dopaminergic neurons of the substantia nigra terminating on D2 receptors operate as pacemaker units, with pulses accumulated in the dorsal striatum (Meck, 1996).
The abnormal motor timing performance is associated with reduced activation of the medial frontostriatal circuitry in PD patients. In particular, we did not observe activation within the SMA, putamen, and thalamus in the PD OFF state during the continuation condition. The absence of SMA activation during the C condition is particularly noteworthy, since activation in this region was observed in our elderly controls. The absence of activation in the putamen and thalamus is also consistent with our hypothesis of reduced activity within this circuit in Parkinson's disease, leading to impaired performance on measures of motor timing. This conclusion must be tempered by the fact that activation of the contralateral putamen and thalamus has been observed in young but not older healthy subjects.
We also observed a generalized reduction in activation of the sensorimotor and cerebellar regions in the PD patients (both ON and OFF medication), although this pattern was present in both the synchronization and continuation conditions. Consequently, reduced activation in these structures may not adequately explain the abnormal explicit timing deficits in PD patients. Nonetheless, reduced activation within these regions may affect sensorimotor functions that bear on the performance of tasks that require explicit timing. For instance, activation in the sensorimotor cortex during the PD OFF state was located more posteriorly than that of the controls. This may suggest that motor execution involves greater compensatory engagement of the somatosensory cortex in PD patients, who rely on sensory information from keypresses as feedback to guide upcoming finger movements. Activation within the right cerebellum corresponds to the anterior portions of areas IV and V (Schmahmann et al., 2000). This cerebellar region has been theorized to play a role in sensorimotor integration (Penhune et al., 1998) through supervision and regulation of relevant sensory and/or cognitive input from the cortex (Bower, 1997; Desmond et al., 1997), detection and correction of errors online (Doyon et al., 2002; Jueptner et al., 1996; Thach, 1998b), and interpretation and coordination of temporal parameters of incoming sensory stimuli with motor output (Thach et al., 1992; Thach, 1998a).
As expected, increased activation was observed within the STG during the synchronization task when pacing tones were presented. As in our previous study (Rao et al., 1997), we also observed increased activity within the STG during the continuation condition when no auditory stimuli were presented. This finding would suggest that activation within the auditory cortex is critical for maintaining and rehearsing the pacing interval in working memory. Comparable levels of activation were observed in PD patients and controls.
Effects of Dopamine Replacement
As noted above, PD patients in the OFF state did not activate the SMA during the continuation condition. Activation of the SMA was partially restored with dopamine replacement (Figure 5). These data complement previous functional imaging studies in PD (Haslinger et al., 2001; Playford et al., 1993) that have also observed selective increases in task activation in the medial prefrontal region with levodopa replacement. These studies, however, used a task that requires subjects to generate nonrepetitive joystick movements in response to a pacing tone with randomized interstimulus intervals ranging from 3 to 15 s. Their findings are not entirely comparable with the current study, since this task emphasizes response selection over motor timing. Not surprisingly, these studies resulted in increased activation within the preSMA rather than the SMA, consistent with the hypothesis that the pre-SMA is involved in response selection and the SMA in motor timing (Picard & Strick, 1996; Rao et al., 1997).
We observed activation in the contralateral putamen and thalamus during the continuation condition in the PD patients during the ON, but not OFF, medication session. As noted previously, we have observed putamen and thalamus activation in our young but not older healthy subjects. It is conceivable that the acute increase in dopamine levels associated with levodopa treatment temporarily overcome age-dependent and PD-related reductions in basal ganglia dopamine levels, resulting in heightened activity within these subcortical structures during the continuation condition of the PFT task. Additionally, dopamine replacement resulted in a shift of activation from the somatosensory cortex to the motor cortex in the continuation condition, with the more anterior focus of activation similar to that observed in the control subjects. Dopamine replacement may enhance the functioning of circuits involved in motor execution, diminishing the need for compensatory engagement of the somatosensory cortex.
The effects of dopamine replacement were more pronounced on functional imaging than on behavioral testing, although we did observe an improvement in motor functioning on the UPDRS as a result of dopamine replacement. The absence of a PFT drug response may be due to the decision not to withdraw our patients from dopamine agonists. In addition, we selected patients with early and mild PD and tested them primarily with their unaffected right hand. Despite these caveats, the PD patients exhibited an abnormal shortening of the IRI during the continuation condition and increased variability. A previous study also demonstrated continued deficits on the PFT in PD patients despite receiving dopaminergic replacement therapy (O'Boyle et al., 1996).
Despite the absence of a behavioral improvement on the PFT task with dopamine supplementation, the observation of increased activation within medial frontostriatal circuitry is intriguing. There is precedence in the functional imaging literature for alterations in brain circuitry to occur despite an absence of change in behavioral performance. For example, Bookheimer et al. (2000) determined that patterns of brain activation differed depending on the genetic risk of Alzheimer's disease, despite the fact that memory performance was comparable in the high and low risk groups. One may speculate that alterations in functional connectivity can occur in the absence of changes on behavioral testing. Functional brain imaging, therefore, may be more sensitive to changes in brain plasticity that are not perceptible by behavioral testing.
A concern when performing functional imaging in patients with movement disorders is the possibility that head movements could introduce artifacts contributing to artificial reductions in global activation patterns. We addressed this problem in two ways. First, we determined that the amount of head movement during scanning was equivalent for the controls and PD patients and there were no differences between the PD patients on or off medication. Second, all images were corrected for motion using a 3-D least squares algorithm. Another concern is the reduction in brain activity that is associated with the loss of brain tissue. Our morphometric analysis demonstrated that our early and less severely affected PD patients did not exhibit abnormal atrophy, at least in the putamen.
Summary
Results of this fMRI study provide a neural explanation for the timing abnormalities observed in patients with Parkinson's disease. Our findings reinforce results from our previous fMRI study in healthy subjects in suggesting that the medial frontostriatal circuit is an essential component underlying performance of motor tasks that require explicit timing. Augmentation of this circuit through dopamine replacement therapy is capable of partially normalizing brain activation patterns observed during explicit timing in PD individuals, despite the absence of an improvement in task performance. In light of its greater sensitivity in detecting compensatory changes in brain activity than behavioral testing, fMRI technology, in conjunction with the PFT activation task, may potentially serve as an outcome measure for evaluating existing and future treatments for Parkinson's disease.
ACKNOWLEDGMENTS
This research was supported by grants from the Charles A. Dana Foundation, Milwaukee Foundation's Parsons Fund, and the National Institutes of Health (P01 MH51358; R01 MH57836) to S.M.R., the Medical College of Wisconsin General Clinical Research Center (M01 RR00058), and the W.M. Keck Foundation. We thank S. Durgerian and M. Verber for their technical assistance, and the comments of the anonymous reviewers.
References
REFERENCES
Alexander, G.E.,
DeLong, M.R., &
Strick, P.L.
(1986).
Parallel organization of functionally segregated circuits linking
basal ganglia and cortex.
Annual Review of Neuroscience,
9,
357–381.Google Scholar
Bookheimer, S.Y.,
Strojwas, M.H.,
Cohen, M.S.,
Saunders, A.M.,
Pericak-Vance, M.A.,
Mazziotta, J.C., &
Small, G.W.
(2000).
Patterns of brain activation in people at risk for Alzheimer's
disease.
New England Journal of Medicine,
343,
450–456.Google Scholar
Bower, J.M.
(1997).
Control of sensory data acquisition. In
J.D. Schmahmann (Ed.),
The cerebellum and cognition (pp.
489–513).
San Diego, CA:
Academic Press.
Brooks, D.J.,
Ibanez, V.,
Sawle, G.V.,
Quinn, N.,
Lees, A.J.,
Mathias, C.J.,
Bannister, R.,
Marsden, C.D., &
Frackowiak, R.S.
(1990).
Differing patterns of striatal 18F-dopa uptake in Parkinson's
disease, multiple system atrophy and progressive supranuclear
palsy.
Annals of Neurology,
28,
547–555.Google Scholar
Cox, R.W.
(1996).
AFNI: Software for analysis and visualization of functional
magnetic resonance neuroimages.
Computers and Biomedical Research,
29,
162–173.Google Scholar
Cox, R.W. &
Hyde, J.S.
(1997).
Software tools for analysis and visualization of fMRI data.
NMR Biomedical,
10,
171–178.Google Scholar
Defer, G.L.,
Widner, H.,
Marie, R.M.,
Remy, P., &
Levivier, M.
(1999).
Core assessment program for surgical interventional therapies in
Parkinson's disease (CAPSIT-PD).
Movement Disorders,
14,
572–584.Google Scholar
Desmond, J.E.,
Gabrieli, J.D.E.,
Wagner, A.D.,
Ginier, B.L., &
Glover, G.H.
(1997).
Lobular patterns of cerebellar activation in verbal working-memory
and finger-tapping tasks as revealed by functional MRI.
Journal of Neuroscience,
17,
9675–9685.Google Scholar
Doyon, J.,
Song, A.W.,
Karni, A.,
Lalonde, F.,
Adams, M.M., &
Ungerleider, L.G.
(2002).
Experience-dependent changes in cerebellar contributions to motor
sequence learning.
Proceedings of the National Academy of Sciences, U.S.A,
99,
1017–1022.CrossRefGoogle Scholar
Fahn, S.,
Elton, R.L., &
Members of the UPDRS Development Committee.
(1987).
The United Parkinson's Disease Rating Scale. In
S. Fahn,
C.D. Marsden,
D.B. Calne, &
M. Goldstein (Eds.),
Recent developments in Parkinson's disease (pp.
153–164).
Florham, NJ:
Macmillan Health Care Information.
Folstein, M.F.,
Folstein, S.E., &
McHugh, P.R.
(1975).
Mini-Mental State.
Journal of Psychiatric Research,
12,
189–198.Google Scholar
Forman, S.D.,
Cohen, J.D.,
Fitzgerald, M.,
Eddy, W.F.,
Mintun, M.A., &
Knoll, D.C.
(1995).
Improved assessment of significant activation in functional
magnetic resonance imaging (fMRI): Use of cluster-size threshold.
Magnetic Resonance Imaging,
33,
639–647.Google Scholar
Ghaemi, M.,
Hilker, R.,
Rudolf, J.,
Sobesky, J., &
Heiss, W.D.
(2002).
Differentiating multiple system atrophy from Parkinson's
disease: Contribution of striatal and midbrain MRI volumetry and
multi-tracer PET imaging.
Journal of Neurology, Neurosurgery and Psychiatry,
73,
517–523.Google Scholar
Harrington, D.L.,
Haaland, K.Y., &
Hermanowicz, N.
(1998).
Temporal processing in the basal ganglia.
Neuropsychology,
12,
3–12.Google Scholar
Haslinger, B.,
Erhard, P.,
Kampfe, N.,
Boecker, H.,
Rummeny, E.,
Schwaiger, M.,
Conrad, B., &
Ceballos-Baumann, A.O.
(2001).
Event-related functional magnetic resonance imaging in
Parkinson's disease before and after levodopa.
Brain,
124,
558–570.Google Scholar
Hoehn, M.M. &
Yahr, M.D.
(1967).
Parkinsonism: Onset, progression, and mortality.
Neurology,
17,
427–442.Google Scholar
Huettel, S.A.,
Singerman, J.D., &
McCarthy, G.
(2001).
The effects of aging upon the hemodynamic response measured by
functional MRI.
Neuroimage,
13,
161–175.Google Scholar
Ivry, R.B. &
Keele, S.W.
(1989).
Timing functions of the cerebellum.
Journal of Cognitive Neuroscience,
1,
136–152.Google Scholar
Ivry, R.B.,
Keele, S.W., &
Diener, H.C.
(1988).
Dissociation of the lateral and medial cerebellum in movement
timing and movement execution.
Experimental Brain Research,
73,
167–180.Google Scholar
Jueptner, I.H.,
Flerich, L.,
Weiller, C.,
Mueller, S.P., &
Diener, H.C.
(1996).
The human cerebellum and temporal information
processing—Results from a PET experiment.
NeuroReport,
7,
2761–2765.Google Scholar
Kaasinen, V. &
Rinne, J.O.
(2002).
Functional imaging studies of dopamine system and cognition in
normal aging and Parkinson's disease.
Neuroscience and Biobehavioral Reviews,
26,
785–793.Google Scholar
Keele, S.W. &
Ivry, R.
(1990).
Does the cerebellum provide a common computation for diverse tasks?
A timing hypothesis.
Annals of the New York Academy of Sciences,
608,
179–207.Google Scholar
Konczak, J.,
Ackermann, H.,
Hertrich, I.,
Speiker, S., &
Dichgans, J.
(1997).
Control of repetitive lip and finger movements in Parkinson's
disease: Influence of external timing signals and simultaneous
execution on motor performance.
Movement Disorders,
12,
665–676.Google Scholar
Meck, W.H.
(1996).
Neuropharmacology of timing and time perception.
Cognitive Brain Research,
3,
227–242.Google Scholar
O'Boyle, D.J.,
Freeman, J.S., &
Cody, F.W.J.
(1996).
The accuracy and precision of timing of self-paced, repetitive
movements in subjects with Parkinson's disease.
Brain,
119,
51–70.Google Scholar
Oldfield, R.C.
(1971).
The assessment and analysis of handedness: The Edinburgh Inventory.
Neuropsychologia,
9,
97–113.Google Scholar
Pastor, M.A.,
Artieda, J.,
Jahanshahi, M., &
Obeso, J.A.
(1992a).
Performance of repetitive wrist movements in Parkinson's
disease.
Brain,
115,
875–891.Google Scholar
Pastor, M.A.,
Artieda, J.,
Jahanshahi, M., &
Obeso, J.A.
(1992b).
Time estimation and reproduction is abnormal in Parkinson's
disease.
Brain,
115,
211–225.Google Scholar
Penhune, V.B.,
Zatorre, R.J., &
Evans, A.
(1998).
Cerebellar contributions to motor timing: A PET study of auditory
and visual rhythm reproduction.
Journal of Cognitive Neuroscience,
10,
752–765.Google Scholar
Picard, N. &
Strick, P.L.
(1996).
Motor areas of the medial wall: A review of their location and
functional activation.
Cerebral Cortex,
6,
342–353.Google Scholar
Playford, E.D.,
Jenkins, I.H.,
Passingham, R.E.,
Frackowiak, R.S., &
Brooks, D.J.
(1993).
Impaired activation of frontal areas during movement in
Parkinson's disease: A PET study.
Advances in Neurology,
60,
506–510.Google Scholar
Rao, S.M.,
Harrington, D.L.,
Haaland, K.Y.,
Bobholz, J.A.,
Cox, R.W., &
Binder, J.R.
(1997).
Distributed neural systems underlying the timing of movements.
Journal of Neuroscience,
17,
5528–5535.Google Scholar
Schmahmann, J.D.,
Doyon, J.,
Toga, A.W.,
Petrides, M., &
Evans, A.C.
(2000).
MRI atlas of the human cerebellum.
New York:
Academic Press.
Sergent, V.,
Hellige, J.B., &
Cherry, B.
(1993).
Effects of responding hand and concurrent verbal processing on
time-keeping and motor-implementation processes.
Brain and Cognition,
23,
243–262.Google Scholar
Talairach, J. &
Tournoux, P.
(1988).
Co-planar stereotaxic atlas of the human brain.
New York:
Thieme.
Thach, W.T.
(1998a).
A role for the cerebellum in learning movement coordination.
Neurobiology of Learning and Memory,
70,
177–188.Google Scholar
Thach, W.T.
(1998b).
Combination, complementarity and automatic control: A role for the
cerebellum in learning movement coordination.
Novartis Foundation Symposium,
218,
219–228.Google Scholar
Thach, W.T.,
Goodkin, H.P., &
Keating, J.G.
(1992).
The cerebellum and the adaptive coordination of movement.
Annual Review of Neuroscience,
15,
403–442.Google Scholar
Thompson, P.M.,
Schwartz, C.,
Lin, R.T.,
Khan, A.A., &
Toga, A.W.
(1996).
Three-dimensional statistical analysis of sucal variability in the
human brain.
Journal of Neuroscience,
16,
4261–4274.Google Scholar
Winer, B.J.
(1971).
Statistical principles in experimental design
(2nd ed.).
New York:
McGraw-Hill.
Wing, A.M. &
Kristofferson, A.B.
(1973).
Response delays and the timing of discrete motor responses.
Perception and Psychophysics,
14,
5–12.Google Scholar
Clinical characteristics of Parkinson's disease patients
Timeline for functional imaging run involving paced finger tapping task.
Mean deviation from the 600 ms target interval (left panel) and total variability (right panel) as a function of task condition (synchronization, continuation) for the C (controls), PD ON, and PD OFF groups. Total variability = standard deviation of inter-response intervals.
Mean volume (ml) of left and right putamen for the PD and control participants. Error bars = standard error of the mean.
Center of mass, volume, and maximum t for activation foci for the synchronization and continuation conditions
Areas of significantly increased MR signal intensity for the synchronization condition. Maps indicate areas activated greater by the S than R condition. Areas shown in red were uniquely activated by controls (red), blue by PD OFF, and green by PD ON. Regions of common activation are displayed in yellow. Z indicates mm above (+) or below (−) the anterior-posterior commissure (AC–PC) line. The green line in the midsagittal images (x = 0) is perpendicular to the AC–PC line and is positioned at the anterior commissure (y = 0). Numbers adjacent to activation foci correspond to numbers in brackets in Table 2.
Areas of significantly increased MR signal intensity for the continuation condition. Maps indicate areas activated greater by the C than R condition. See Figure 4 legend for details.
 You have
Access
- 83
- Cited by