

Introduction
Would you like to know the number of calories in the decadent Tasty Burger that you consume during one of your escapist restaurant visits? Well, regardless of how you feel, in May 2018, the US Food and Drug Administration (FDA) implemented a policy that requires restaurants and food outlets with 20 or more locations to post calorie counts (FDA, 2018). This policy affects a significant number of Americans, given that they spend more than half of their food budgets on eating out. Hence, it is important for policy-makers to assess the desirability of this policy. Traditionally, the merits of a policy are based on its benefits and costs and whether, after balancing these, there is an increase in net welfare. Assessment of benefits for a public good, like calorie labels, is challenging. One approach is to specify outcomes in terms of economic savings or health benefits (Sunstein, Reference Sunstein, Gersen and Steckel2017). However, this approach relies on making projections on little information, and it will often leave out losses and gains experienced by individuals as a direct result of the policy itself. A preferable measure is to identify consumers’ willingness to pay (WTP). This approach, in theory, captures all relevant losses and gains to the consumer. This paper aims to estimate the net benefit from the policy mandating calorie labels in restaurant menus. To determine this, we: (1) survey people regarding what they are willing to pay annually for such a policy; (2) provide additional information on calorie labels and test the robustness of their WTP estimates; and (3) measure self-reported well-being as a result of the policy. This study will focus on net benefits to the individuals and will not explore production costs or producer surpluses. Similarly, discussions of other costs (e.g., costs to restaurants) and benefits (e.g., savings in health costs), while relevant, are outside the scope of the study.
Background
Estimating consumer demand for calorie labels using WTP
If a market existed for calorie labels in restaurant menus, one could estimate the demand for these labels by observing trading volumes and prices (revealed preferences). However, for public goods, markets often do not exist – non-excludability and non-rivalry lead to free-rider and collective action problems. In theory, the overall benefit of a public good is obtained by summing up the individual benefit (positive or negative) that each person receives for a given quantity of the public good. In practice, cost–benefit analysts have relied on surveys in which they ask individuals a hypothetical question about their WTP for a public good (stated preferences).
Once a measure of WTP is obtained, one could apply the Kaldor–Hicks optimality criterion to evaluate net benefit.Footnote 1 A Kaldor–Hicks improvement occurs when those that are made better off from the policy could hypothetically compensate those that are made worse off. Thus, a Kaldor–Hicks improvement occurs as long as individuals who benefit from the calorie labels (e.g., by helping them to eat healthily) benefit more than those individuals who are harmed by the labels are harmed (e.g., by feeling guilty or judged when eating a calorie-laden meal). This study aims to estimates the WTP for both sets of individuals – winners and losers – in order to determine the desirability of this policy in terms of increasing net welfare.
However, the process of determining unbiased and informed WTP through surveys is challenging. Relying on stated preferences (surveys) rather than revealed preferences (observations) can give rise to hypothetical bias. Since subjects are asked to speculate about how much they are willing to pay without actually having to pay anything, the accuracy of their answers could be unreliable. We provide compensation for taking the survey in order to ensure motivation. Another set of concerns regarding the WTP method are the so-called wealth effects (Bronsteen et al., Reference Bronsteen, Buccafusco and Masur2013). A wealthy person with a large dispensable income might be willing to pay more for calorie information than a person with less income. Thus, the WTP studies can have large variance and are biased toward certain demographics. To address this limitation, we include income as a control variable in our regression in order to separate out these wealth effects. Finally, for WTP estimates to be accurate, the individuals should be well informed about the benefits conferred from the public good. However, consumers often lack the relevant information to fully assess their WTP. In the next section, we will discuss the impact of providing additional information on individuals’ WTP.
Impact of information on valuation
Consumers often chose products under imperfect information. Given that almost unlimited information is available about the goods consumers purchase, it is quite burdensome for an individual to obtain all of the relevant information before making a decision. Unsurprisingly, consumers often rely on heuristics and past experiences to help simplify their decisions (Hirschman et al., Reference Hirschman, Kahneman, Slovic and Tversky1983). For instance, when evaluating the benefits of caloric information in restaurant menus, consumers may draw upon previous experiences in which they found information disclosure useful. They might ask themselves, “How often do I pay attention to information disclosures? Do I use the calorie labels on prepackaged foods? Would I be willing to pay more for foods with calorie information on them?” Drawing inferences from these experiences saves us the cognitive tax of perfectly optimizing our decisions every time we chose to buy something. However, these heuristics are not perfect. Consumers can make systematic mistakes when evaluating outcomes (Barber et al., Reference Barber, Odean and Zheng2005; Abaluck & Gruber, Reference Abaluck and Gruber2011). For instance, they might overestimate the benefit of caloric information in menus if they had recently found an information disclosure to be useful (availability bias), or they might underestimate the benefit if they only think of a specific subset (e.g., prepackaged food labels) of information disclosures rather than all relevant instances (representativeness bias).
In private markets, the negative consequences of relying on heuristics are mitigated by arbitrageurs and regulators who help correct beliefs through advertisements and disclosures. Unfortunately, for public goods that do not trade in a market setting, heuristics and biases can play an important role in influencing the perceived benefits and thus the valuation of these goods. For instance, when asked to value calorie labels, one might first have to determine one's experiences with similar informational labels. Were they useful to them? Did having that information change their behavior? How different is their past experience from the current context? In particular, public goods can suffer from two kinds of informational gaps: (1) information about the intrinsic benefits of the goods for the individual themself; and (2) information about the social value of the goods. In this study, we provide information on the intrinsic benefit by providing a visual of the potential calorie labels and estimated effectiveness of the labels on one's consumption of calories (Conditions 2 and 3). We also provide information on the public value by describing the estimated impact of the policy on obesity and overall economic savings (Condition 4). We also ask consumers about their WTP for a private service that provides them with caloric information regarding their consumption (Condition 5). This condition serves as a comparison baseline for Condition 3, in which information is provided on the intrinsic benefits of the labels. However, in this case, the provider is a private company rather than the government. In the next section, we will discuss the literature on the private and public benefits of providing information on calorie consumption.
Evidence on the benefits and effectiveness of calorie labels
While the intent of mandating calorie labels is clear, their effectiveness is not. For calorie labels to have an impact on health outcomes, consumers must read and understand them, and then change their behavior accordingly. A systematic review by Swartz et al. (Reference Swartz, Braxton and Viera2011) shows that the studies on the effectiveness of calorie labels have had mixed findings. Their conclusion is that calorie labels have only a modest effect on calorie ordering and consumption. However, some studies claim that calorie information can have a significant impact on consumption behavior. Bleich and Pollack (Reference Sara N and Keshia M2010) shows that about 90% of participants underestimated the calorie content in their entrées by more than 600 calories. When provided with the calorie information, the same participants chose the higher-calorie option about a third less frequently. Similarly, a quasi-experimental study by Chu et al. (Reference Chu, Frongillo, Jones and Kaye2009) shows that calorie labels in Ohio State University dining halls decreased the number of calories consumed. Bollinger et al. (Reference Bollinger, Leslie and Sorensen2011) found that calorie labeling in Starbucks cafés resulted in fewer calories being consumed per transaction, although the effect was very modest and was concentrated on women and high-calorie purchasers. On the other hand, some studies have found little to no impact of calorie labels on consumption. Harnack et al. (Reference Harnack and French2008) found that participants did not significantly reduce the number of calories they ordered and consumed after calorie labels were introduced at a fast-food restaurant. Similarly, Finkelstein et al. (Reference Finkelstein, Chan and Krieger2011) did not find significant differences in the sales volume or the rate of ordering of unhealthy menu items after the introduction of calorie information. The same result is replicated by Elbel et al. (Reference Elbel, Kersh, Brescoll and Dixon2009), who compared restaurants before and after the implementation of calorie labels and found that these labels had no impact on consumption.
The lack of consensus on calorie label effectiveness can be attributed to the methodological limitations of most of these studies. Most studies in this area are either non-random observational studies that fail to establish a causal connection or are experimental studies that lack external validity for comparison with a broader policy question. In future, policy-makers should consider rolling out large-scale randomized controlled trials in order to measure the effectiveness of these labels. One way to achieve this would be to gradually scale this policy at the state or county level. Moreover, in many studies, participants were unaware of the existence of calorie labels, which can prevent individuals from fully utilizing the benefits of the labels (Elbel et al., Reference Elbel, Kersh, Brescoll and Dixon2009). Future research should examine whether increasing the noticeability of labels improves their efficacy. Relatedly, the design of the calorie labels can also have a significant impact on their effectiveness. A field study by Ellison et al. (Reference Ellison, Lusk and Davis2014) shows that numeric labels did not influence consumption, but ‘traffic light’ labels caused diners to increase their consumption of lower-calorie menu items. Finally, it is also important to recognize that this policy can have targeted benefits for certain populations. Deb and Vargas (Reference Deb and Vargas2016) estimate that the effects of calorie labels are largely concentrated among overweight individuals. Another study by Variyam and Cawley (Reference Variyam and Cawley2006) shows that these impacts are only significant for non-Hispanic white women. Thus, when estimating WTP, it is important to recognize the heterogeneous impacts of the policy among different populations.
Well-being analysis versus WTP
Embedded in the WTP approach is the idea that a person's WTP for a good serves as a proxy for how much that good increases his or her welfare. However, some scholars argue that WTP is a poor measure of welfare. For example, individuals are making guesses about how much the good would contribute to their welfare. However, individuals could be mistaken in their predictions. Bronsteen et al. (Reference Bronsteen, Buccafusco and Masur2013) argue that a measure of how individuals are feeling at a particular moment through self-report could be a more reliable predictor of welfare than WTP. They argue that ‘experienced utility’ might be a more accurate, albeit crass, indicator of well-being than ‘expected utility’. To that end, they propose well-being analysis as an alternative to WTP. They are not the first to propose some other form of welfare measure. Economists and psychologists have developed measures of subjective well-being that attempt to capture utility or happiness without relying too heavily on dollar valuations and predictions. If both serve the purpose of measuring welfare, we believe that the WTP approach should result in directionally similar findings to those of a well-being analysis. Therefore, in this study, in addition to measuring WTP, we obtain an estimate of well-being by measuring the happiness and unhappiness resulting from this policy on a 0–10 scale.
Experimental design
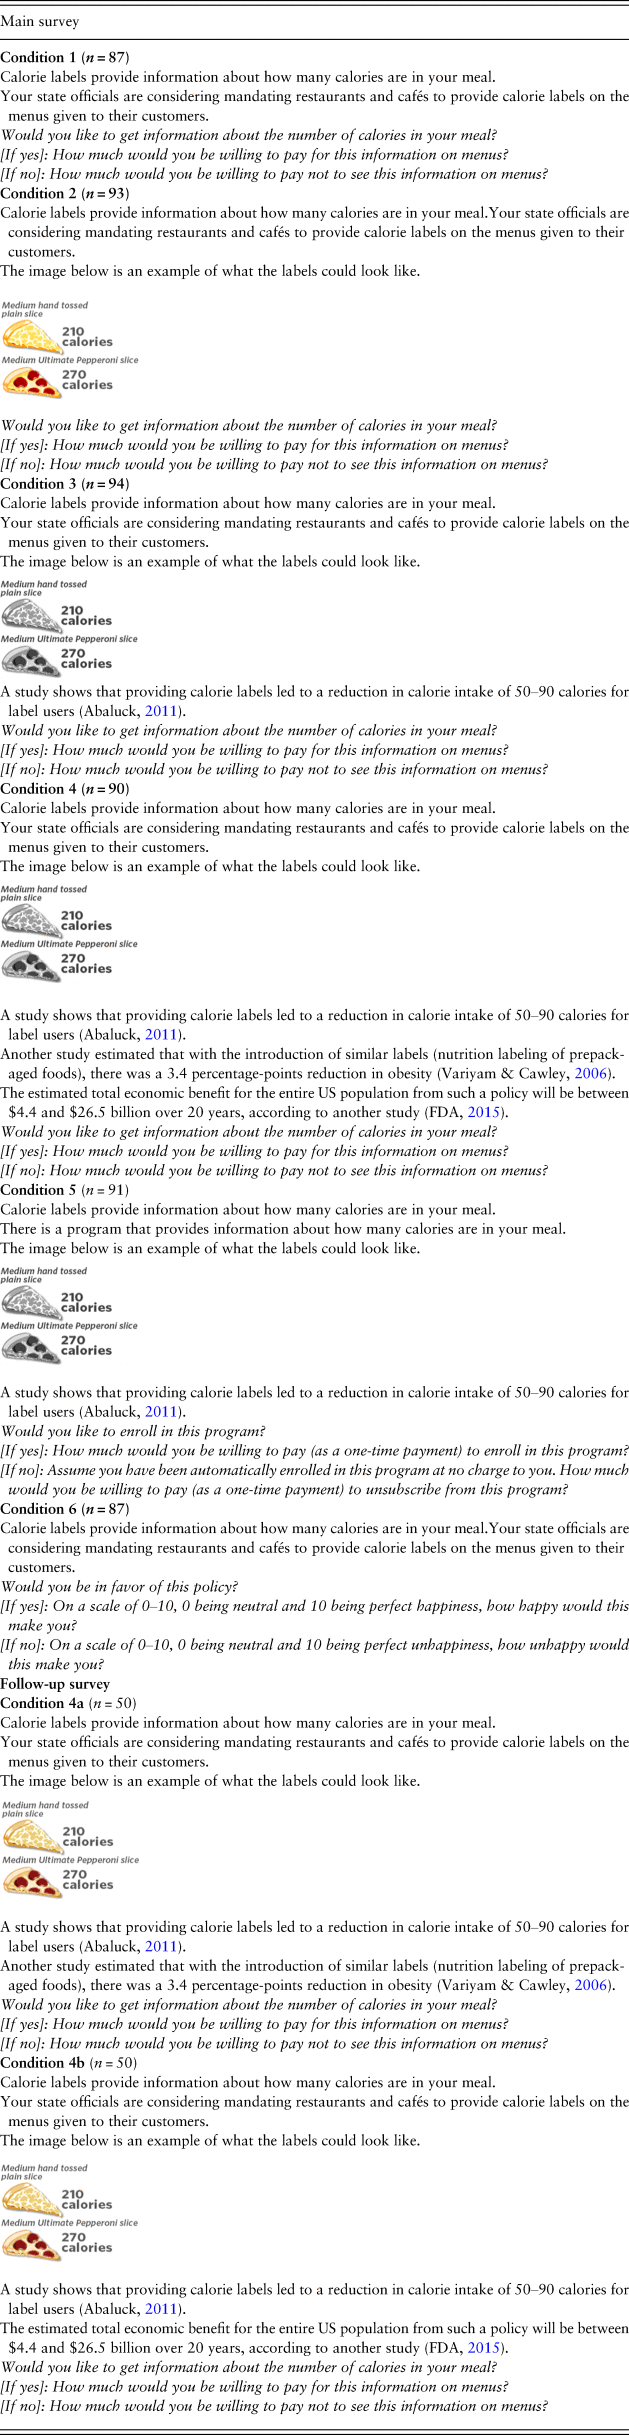
The data used in this study come from three separate surveys. In the first survey, we recruited 542 participants using Amazon's Mechanical Turk in exchange for a modest payment. We randomly assigned participants to one of six conditions. Table 1 provides a summary of this process. Conditions 1–4 were staggered such that an additional piece of information was provided in ascending order of condition. Condition 1 included a standard text about the policy. Condition 2 included that standard text and a visual of a potential calorie label. Condition 3 included all of the content of Condition 2 and additional text on the efficacy of the labels. Condition 4 included all of the prior information and additional information on the labels’ public and economic value (i.e., reduction in obesity and savings in health costs). Condition 5 was the same as Condition 3, but reframed as a private program. Once assigned to a condition, participants were all presented with the question: “Would you like to get information about the number of calories in your meal?” For Conditions 1–5, if they answered yes, they were asked how much they would be willing to pay annually for this information. If they answered no, they were asked how much they would be willing to pay not to see this information. For Condition 6, they were asked to rank how happy or unhappy the policy made them on a scale of 0–10, with 0 being neutral and 10 being perfect happiness/unhappiness. Finally, we obtained demographic information, before terminating the survey.
Summary of experimental design.

A follow-up survey was conducted with 100 respondents in which Condition 4 from the first survey was separated out into two questions. In the questionnaire, some participants were only given information about the impact of the labels on obesity and not their impact on economic savings, and the other participants were given information on economic savings and not obesity. This survey was conducted as a follow-up to the first survey in order to separate out the effect of information on obesity from that of economic savings on WTP.
Findings
Summary
This section provides an overview and descriptive summary of the main findings. More detailed findings and potential explanations are provided in the ‘Regression analysis’ section.
Overall desirability of calorie information
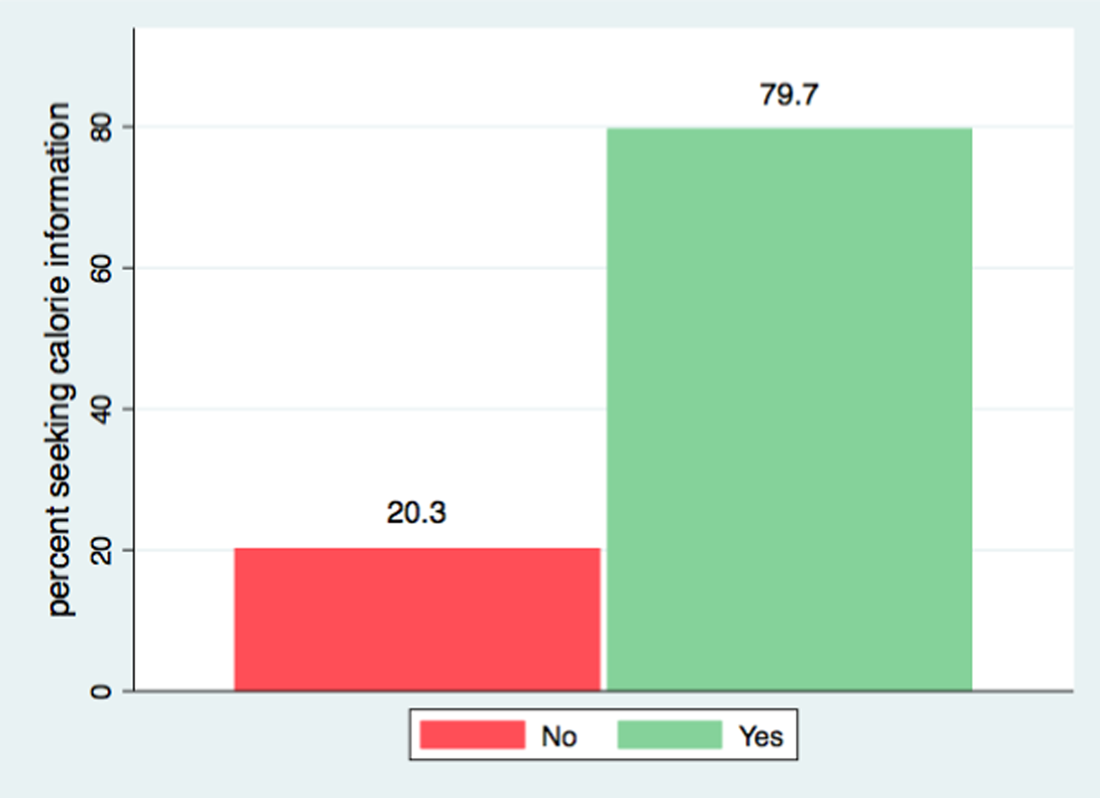
A total of 80% of individuals want to receive calorie information, compared to 20% who did not, when told that state officials are considering mandating calorie labels (Figure 1). This difference is statistically significant at 5%.
Percentages of individuals seeking calorie information when told the state is considering mandating them.
Note: Statistically significant at 5% (n = 542).

Desirability by condition
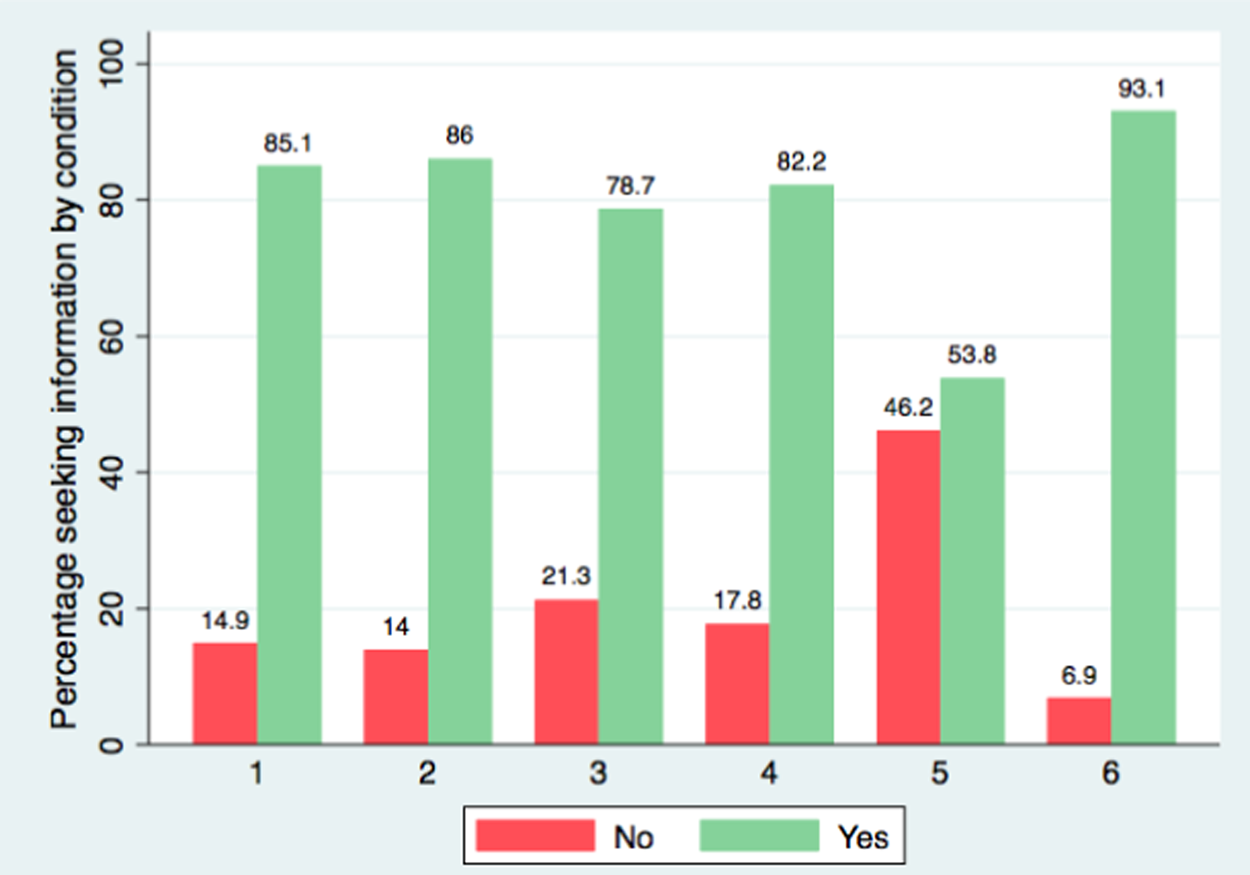
Desirability to obtain information on calories stays relatively high and statistically significant across all conditions (between ~79% and 93%), except for in Condition 5, in which it is reframed as a private good (Figure 2). In this condition, the percentage of individuals wanting calorie information drops to ~54%. However, the difference between people seeking information and not seeking information is not statistically significant. In other words, people are not more (or less) likely to enroll in a private program that provides calorie information.
Percentages of individuals seeking calorie information by each condition.
Note: The differences in desirability are statistically significant at 5% for Conditions 1 and 2 and at 1% for Conditions 3, 5 and 6. The difference in Condition 4 is not statistically significant.

Welfare implications
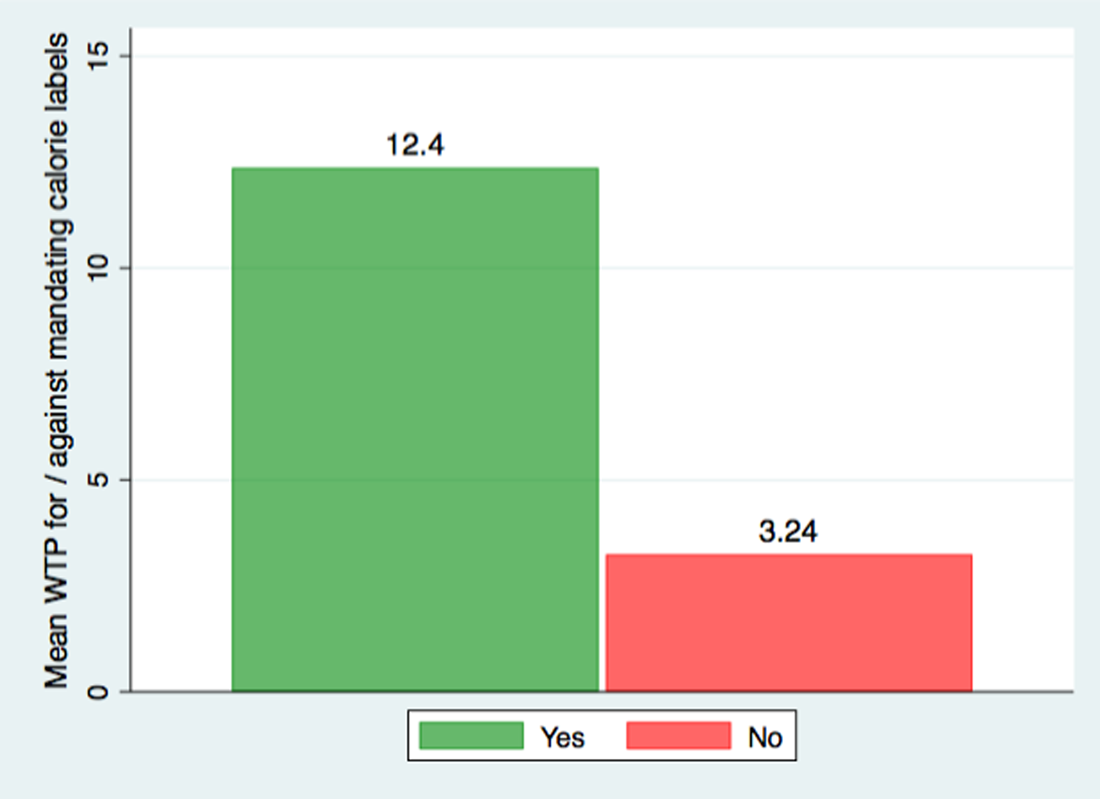
Across all of the conditions, the mean WTP for mandating the policy is $12.40 (significant at 1%) (Figure 3). The mean WTP for not mandating the policy is $3.24, but this is not statistically significant. Thus, we cannot reject the hypothesis that they are willing to pay more than $0 for not mandating the policy. Given that the percentage of people supporting the policy is greater than the percentage opposing it in every condition and that, on average, the WTP is higher for the supporters compared to the opponents, this policy satisfies the Kaldor–Hicks criterion.
Mean willingness to pay (WTP) for calorie labels across all conditions.
Note: Left: statistically significant at 1% (n = 354). Right: not statistically significant (n = 92).

Informational impact
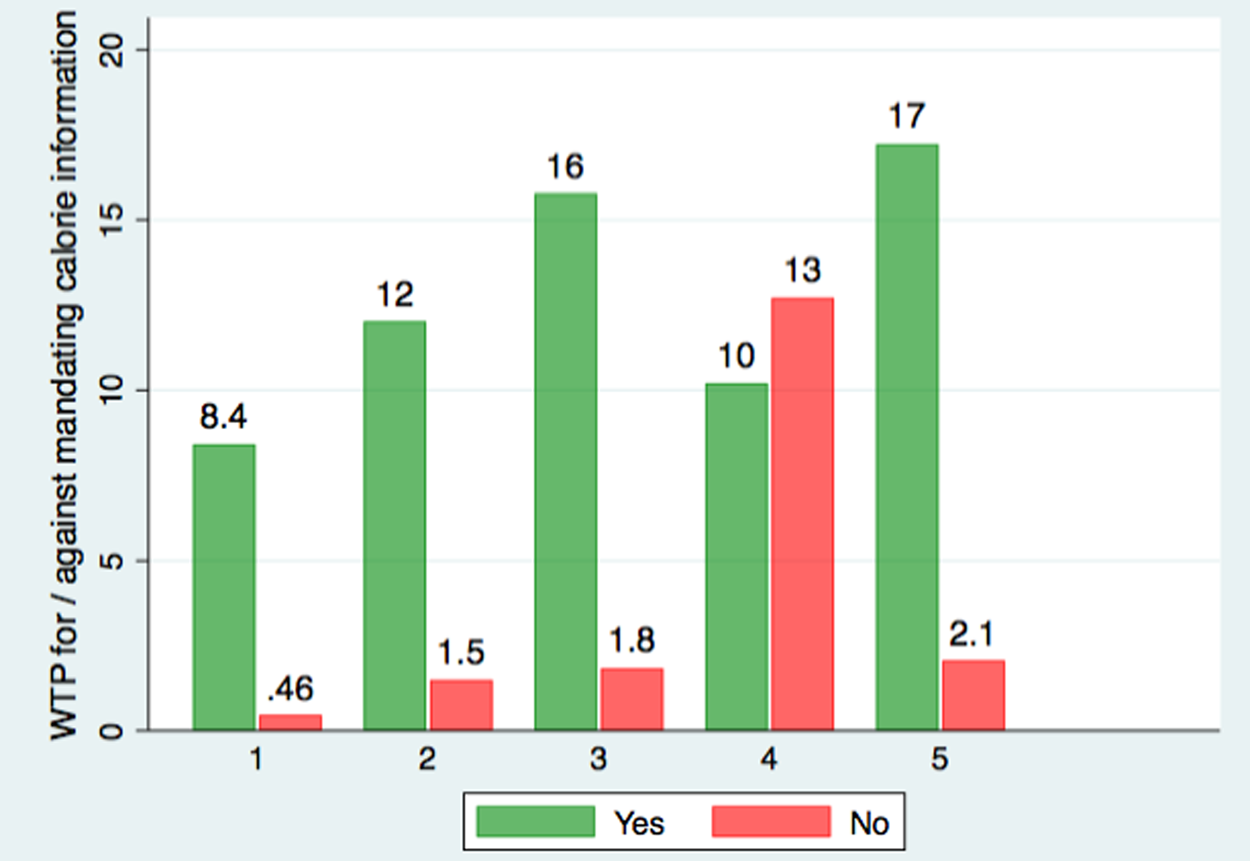
For the supporters, providing an image of the calorie label (Condition 2) does not increase the WTP over baseline (Condition 1) in a statistically significant way (Figure 4). Providing information on the effectiveness of the label at reducing caloric consumption (Condition 3) increases WTP in a statistically significant way. However, the increase in WTP in Condition 3 vanishes when information about public benefits (obesity and economic savings) is provided.
Willingness to pay (WTP) for/against calorie labels by condition.
Note: Left-hand bars: Condition 1 is statistically significant at 1%. Conditions 3 and 5 are statistically significant at 5%. Conditions 2 and 4 are not significant. Right-hand bars: Conditions 1, 2, 3 and 5 are not significant. Condition 4 is significant at 5%.

For opponents, additional information has no statistically significant impact on WTP except in the Condition 4, in which they were provided with information on public benefits. These individuals were willing to pay ~$13 (compared to $0 under all other conditions) to oppose the mandate.
More detail on the informational impact is determined by performing a regression analysis, which is discussed in the ‘Regression analysis’ section.
Parsing public benefits information
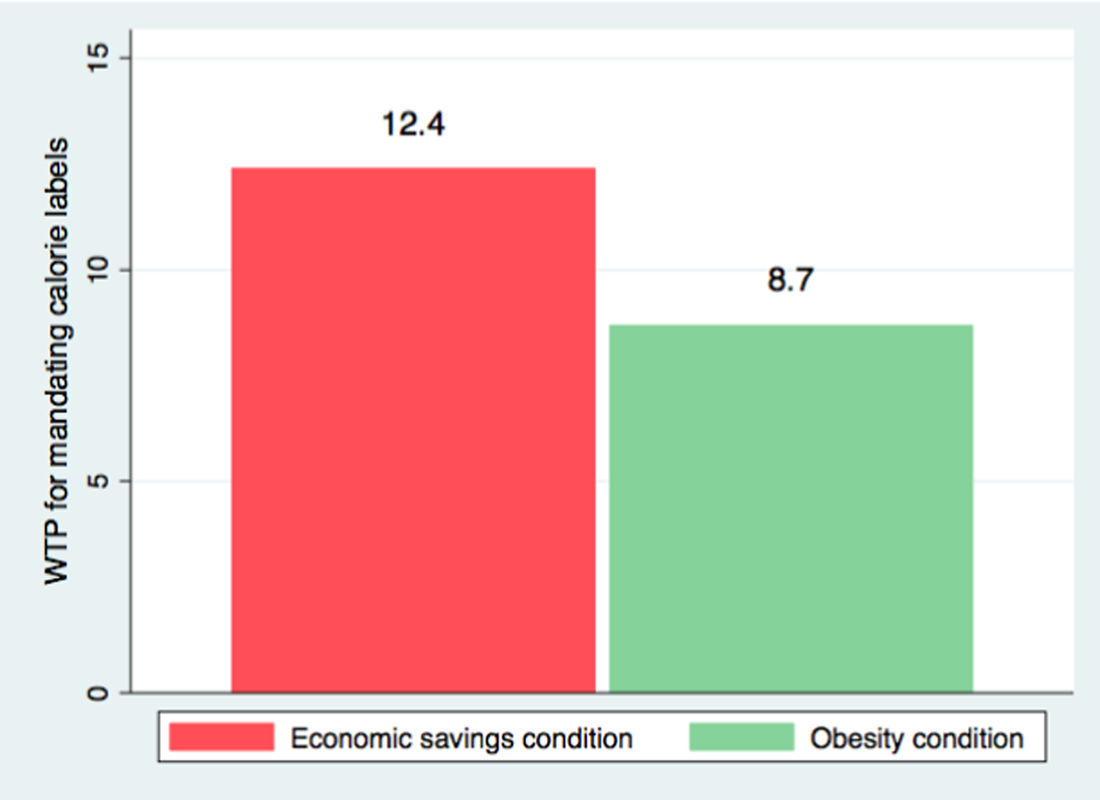
As observed earlier, WTP decreases in Condition 4 (compared to Condition 3) when information on public benefits – economic savings and obesity – is provided (Figure 5). The follow-up survey was conducted to parse out whether it was the information on economic savings or obesity that was driving down the WTP. When information on economic savings is provided, people are willing to pay $12.4 for this information. However, people decrease their WTP, on average, to $8.70 when additional information is provided on the impact of labels on obesity.
Willingness to pay (WTP) parsed out by information on economic savings and obesity (Condition 5).
Note: Left: statistically significant at 10% (n = 54). Right: statistically significant at 10% (n = 50).

Well-being assessment
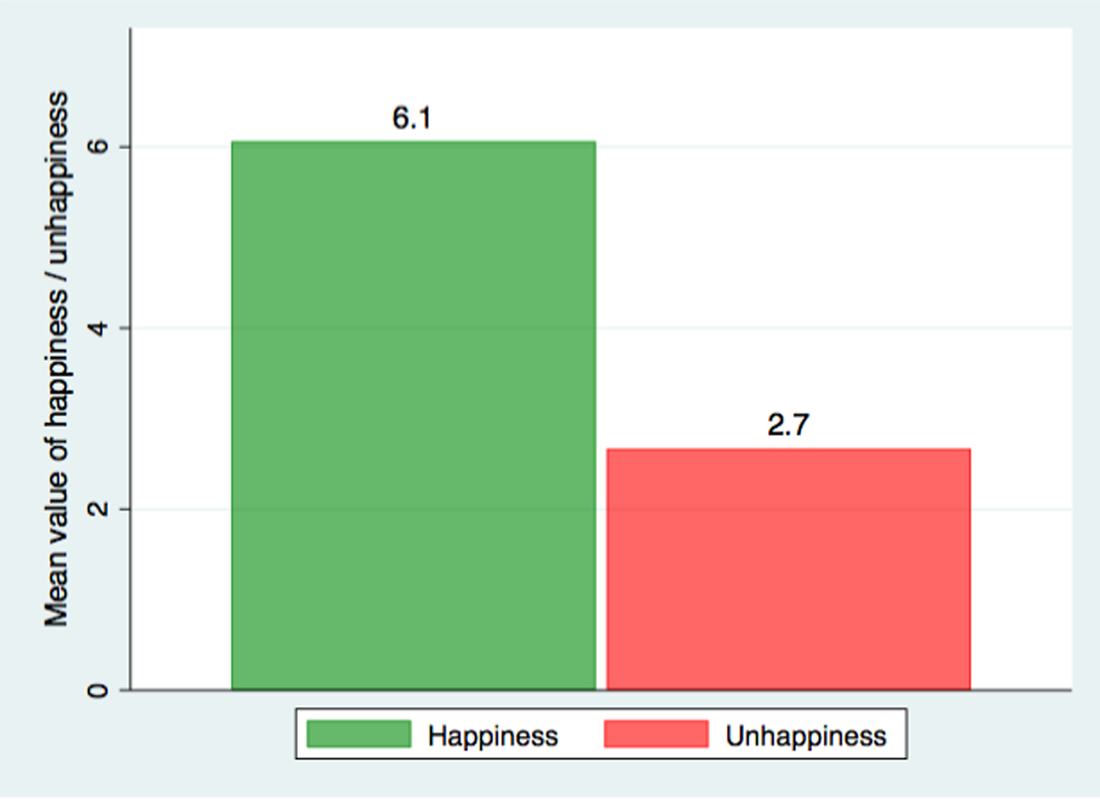
The well-being analysis complements the WTP findings. The average happiness of those in favor of the mandate exceeds the average unhappiness of those against it (Figure 6). With 93% seeking information and stating higher average levels of happiness than those who are unhappy, on a societal level, this policy is welfare enhancing.
Mean value of happiness/unhappiness.
Note: Left: statistically significant at 1%. Right: statistically non-significant.

Regression analysis
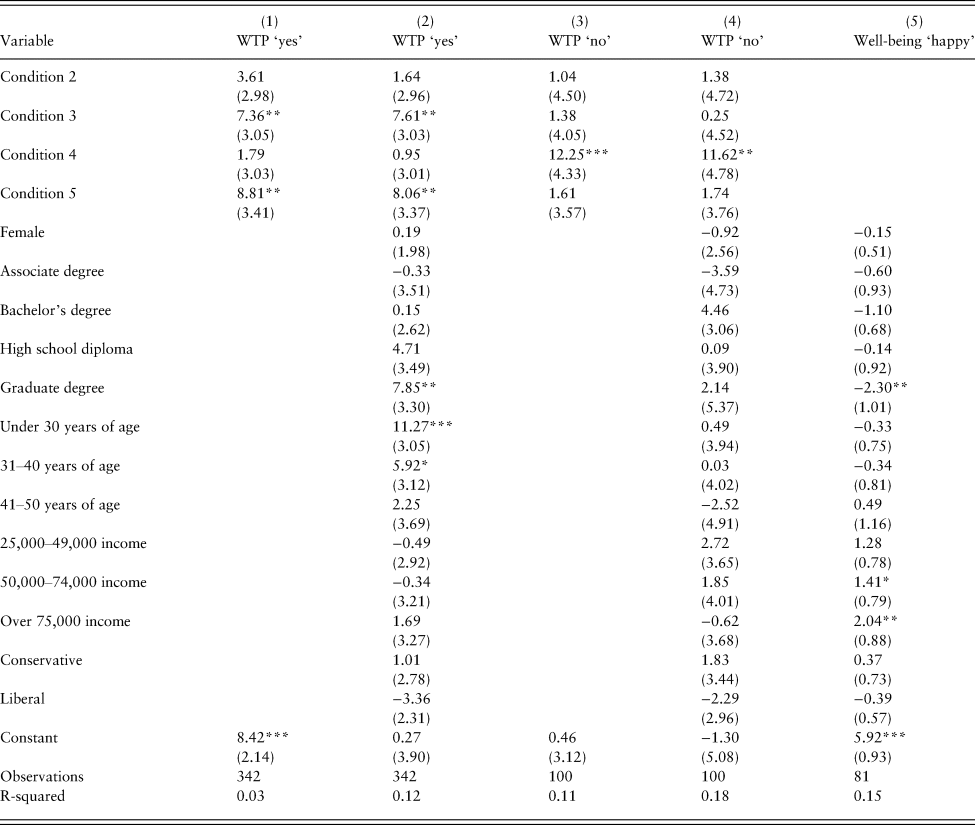
We ran five regressions in order to determine whether the differences in WTP were statistically significant among conditions, controlling for demographic factors such as age, gender, education, income and political ideology. The regression specifications were as follows:
 $$Y_i = {\rm} {\beta} _0 + {\beta} _iX_i + {\varepsilon} _i$$
 $$Y_i = {\rm} {\beta} _0 + {\beta} _iX_i + \gamma _1Y_1 + \delta _iZ_i + \lambda _iA_i + \sigma _iC_i + \psi _iD_i + \varepsilon _i$$
 $$Y_j = {\rm} {\beta} _0 + {\beta} _jX_i + \varepsilon _i$$
 $$Y_j = {\rm} {\beta} _0 + {\beta} _iX_i + \gamma _1Y_1 + \delta _iZ_i + \lambda _iA_i + \sigma _iC_i + \psi _iD_i + \varepsilon _i$$
 $$Y_k = {\rm} {\beta} _0 + \gamma _1Y_1 + \delta _iZ_i + \lambda _iA_i + \sigma _iC_i + \psi _iD_i + \varepsilon _i$$
where:
• Y i is the value of the response variable, WTP, if respondents said yes.
• Y j is the value of the response variable, WTP, if respondents said no.
• Y k is the value of the response variable, happiness, ranging from 0 to 10.
• X i is a vector of dummy variables for Conditions 2, 3, 4 and 5.
• Y 1 is a dummy variable for gender (female = 1).
• Z i, A i, C i and D i are the vectors of dummy variables for educational level, age, income and political ideology, respectively.
• β i, γ i, δ i, λ i, σ i and ψ i are the vectors of parameters associated with the X i, Y 1, Z i, A i, C i and D i vectors.
• ε i is the error vector.
The regression output is summarized in Table 2.
Regression of willingness to pay (WTP) by condition.

Note: Well-being ‘unhappy’ was not included as the sample size was small and not statistically significant. Standard errors in parentheses.
*p < 0.1, **p < 0.05, ***p < 0.01.
Magnitude of WTP
In the absence of any additional information (Condition 1), individuals were willing to pay, on average, $8.42 (significant at 1% level) annually to obtain information about the number of calories in their meals in restaurants. Given an average American household spends $3,008 annually on restaurant meals, an individual is willing to pay about 1.1% of their expenditure on restaurant meals to obtain calorie information (Bureau of Labor Statistics, 2015). Those who did not want to obtain calorie information were willing to pay, on average, $3.24 not to see this information. However, this is not statistically significant. Thus, effectively, we cannot reject the hypothesis that they were willing to pay more than $0.
Impact of visual information
Providing an image of the calorie label did not increase WTP in a statistically significant manner. One reason for this could be that the image did not convey additional information beyond that of the expectation of an ordinary consumer on what a calorie label would look like. Had we used a ‘traffic light’-inspired design for the calorie labels, the results might have been different. This is because individuals may value a label that lowers the cognitive cost of understanding the information.
Significance of information on efficacy
For supporters of the policy, providing information on the effectiveness of the calorie label at reducing caloric consumption increases WTP by $7.36 (significant at 5% level). This is further confirmed by the increase of $8.81 in WTP under Condition 5, in which the same effectiveness information is presented but for a private program that provides calorie information for meals. The highest WTP of $17.23 is obtained under this condition. For the policy's opponents, providing information on the efficacy of the labels did not change their WTP.
Effect of information on public benefits
For those who preferred not to obtain information on calories in the meals, their WTP is statistically identical across all conditions in which information is provided on private benefits. However, when presented with information about public benefits, these individuals are willing to pay $12.25 (significant at 1% level) more to oppose the mandate. Similarly, for the policy's supporters, information on obesity and total economic benefit reduced their WTP from $15.78 to $8.42. Thus, providing information on public benefits reduces the valuation of the calorie labels for both groups.
WTP by demographics
People under the age of 30 were willing to pay $11.27 (significant at 1% level) more than people between the aged of 30 and 50, controlling for all other factors. Similarly, individuals with graduate degrees were willing to pay $7.85 more than high school dropouts. Neither of these findings is surprising; younger people with many years yet to live have a greater incentive to eat healthily. Similarly, people with graduate degrees might be more health conscious than those who have dropped out of high school, controlling for other factors including income. Interestingly, income, gender and political ideology had no statistically significant impacts on the WTP for either supporters or opponents of the policy.
Well-being assessment
WTP results align with the well-being outcomes. Individuals who wanted to obtain information on calorie labels ranked their well-being, on average, at 5.9 (significant at 1% level). The opponents of the policy stated an average unhappiness of 2.7, but this was not statistically significant. Therefore, we cannot reject the hypothesis that these individuals’ unhappiness was different from 0. Regardless, under both measures, the utility of those in favor of the policy compensates for the disutility of those against it. The difference in the magnitude is greater for WTP than well-being. However, this could be an outcome of the arbitrariness of the 0–10 scale rather than representing a meaningful difference.
Discussion
Explanations
A greater number of individuals are interested in obtaining calorie information when it is presented as a public good (in a policy context) rather than a private good (absent of policy language). There could be three potential explanations for this. The first explanation is that people anticipate that a public good will be provided to them free of any direct costs, whereas for a private good, they will have to pay out of pocket. If the benefit of the calorie labels is infinitesimally small and individuals anticipate that the good will be provided at zero cost to them, they will opt for obtaining calorie information. Similarly, if they anticipate costs associated with the private good, they will only opt in if the benefits of the calorie labels exceed the costs. While the survey was conducted in two steps to separate out individuals’ willingness to obtain information from their WTP for it, it is possible that the respondents had prior beliefs about the costs associated with public and private goods. One data point in favor of this explanation is that only 16% of individuals answered with $0 regarding their WTP in the private good condition compared to 24% who stated $0 for their WTP under the public good scenario. Moreover, the mean WTP is lower in the public good condition, further supporting this hypothesis.
A second, behavioral explanation for this finding could be the ‘better than average’ effect. When presented as a private good, individuals are confident in their ability to estimate the numbers of calories in their meals, thereby reducing the perceived usefulness of the calorie labels. This naive optimism encourages them not to obtain information about calories when it is only for their own benefit. However, when presented as a public good, individuals recognize that others might not be as sophisticated at estimating this calorie information and so might benefit from the labels in order to reduce their caloric intake.
Finally, a third explanation for this finding is that people attach a ‘signaling’ value to a policy (e.g., “If the policy experts mandated it, there must have been some evidence supporting it”). Thus, there could be a propensity to associate policy recommendations in general with them having some societal or individual benefit.
Unsurprisingly, information about the effectiveness of the labels on caloric intake increased WTP. This information makes salient the private, direct benefit of the labels to the individual. Surprisingly, however, when presented with additional information about the public value of the labels, the impact of effectiveness information was wiped out. For both opponents and supporters of the policy, providing information on obesity and economic savings had a negative impact on WTP. There are four potential explanations for this.
First, absent any information on economic benefits or obesity, respondents viewed the intention of the state mandate as to provide individuals with more information in order to enable them to make healthier decisions. When provided with information about economic benefits, the perceived intention of promoting a norm of eating healthier vanished. Instead, people viewed the policy as a way for the state to save money on health costs. Thus, the policy was no longer viewed as a benefit for making healthier choices but a fine for costing the health care system money. This monetization changed the perception of the labels from a good with public value to an economic commodity that taxes unhealthy behavior. As a result, supporters reduce their WTP for this policy and opponents increase their WTP against it. A study by Gneezy and Rustichini (Reference Gneezy and Rustichini2000) provides support for this hypothesis by showing that monetization of a behavior can erode the social norms around it.
A second, related hypothesis is that by making salient the connection between obesity reduction, cost savings and calorie labels, one makes salient the paternalistic aspects of this policy. It paints a picture of ‘the nanny state’ that wants to save money and is implementing calorie labels to shame individuals into eating less. If prevention against harm and preservation of autonomy are important values for the respondents, they might not support policies that are seen as infringing upon their autonomy (Graham et al., Reference Graham, Haidt, Nosek and Carver2009). Thus, a policy that was initially perceived as a ‘nudge’ would now be viewed as a ‘shove’. The opponents’ 12-fold increase in their WTP against the implementation of this policy could be a signal of their discontent regarding the paternalism of this policy.
A third explanation could be that by making salient its public benefits, individuals are less motivated to pay out of pocket for a good that has positive externalities. By drawing attention away from the private benefits – the effectiveness of labels on an individual's caloric intake decisions – we are highlighting benefits that are conferred on others (e.g., reduction in obesity in general). If individuals perceive the public benefits to be greater than the private benefits, then they might reduce their WTP if they only care about the direct benefits of the label to them. Thus, by making the obesity and economic value information salient, we put respondents in a ‘public good’ mindset, in which they are willing to pay less for a good with positive externalities. There is some support for this hypothesis, given that respondents gave a high desirability rating for obtaining information on calorie labels under this condition (82.2% of the respondents said yes to wanting the information). The high desirability and low WTP represent elements of the free-rider problem facing public goods. However, this explanation alone cannot describe the whole effect, since the opponents increased their WTP against the policy when presented with information on obesity and economic value.
Finally, a fourth explanation could be that the evidence provided on the social and economic benefits was underwhelming and below individuals’ expectations. As a result, they are less convinced of the aggregate benefits of this policy. While this is plausible, it is unlikely to be the case. An average individual is unlikely to have a benchmark for the social costs associated with unhealthy eating. Moreover, regardless of how high one's benchmark is, $4.4–$26.5 billion in savings is objectively a high number. Finally, while the obesity reduction number may seem small, it is a modest effect when compared to the size of the intervention. Thus, we are given to believe that it is not the content but rather the nature of the information that is driving this effect.
To parse out whether it was the information on obesity or on the economic value that was driving the results, we ran a follow-up study (Survey 2) in which we asked respondents the same questions, but they were randomized as to whether they received the ‘economic savings’ or the ‘obesity’ information. Once separated, the economic savings information had little negative impact on WTP – a reduction of $3.37 compared to Condition 3. However, under the obesity condition, the mean WTP decreased by $7.10. These findings provide support for the ‘monetization of norms’ and ‘nanny state’ hypotheses.
Policy implications
The perceived utility of the supporters – measured both in terms of WTP and well-being – exceeds the perceived disutility of the opponents. Additionally, the percentage supporting the policy is greater than that opposing it. Given these two factors, we can conclude that the net societal benefit of this policy is positive, leading to a Kaldor–Hicks improvement. Therefore, the implementation of this policy increases aggregate welfare. A back-of-the-envelope calculation shows that the net welfare gain from this policy, under the most conservative estimate, is $1.6 billion annually. This assumes a baseline WTP of $8.42 and a supporter base of 79% of the adult US population. These welfare estimates should be viewed as a lower bound. Since people have the highest WTP when the labels are presented as a private program ($17.23), the direct benefits accrued to an individual are higher than our baseline estimate ($8.42). Another reason as to why these estimates are likely to understate aggregate welfare is that preferences are malleable and people can change their tastes after the introduction of the labels, thereby potentially reducing the hedonic costs associated with eating unhealthily (Sunstein, Reference Sunstein, Gersen and Steckel2017). Despite net welfare gains, there is still scope for policy-makers to increase the policy's effectiveness. First, they should pay close attention to the framing of its public benefits and the policy motivation behind it. Counterintuitively, the public narrative should be focused on emphasizing the effectiveness of the labels at reducing calorie consumption at the individual level rather than on the reduction of obesity and the economic savings at the societal level. Framing the calorie labels as providing additional information to the consumer so that they can make healthier choices is likely to make individuals happier than framing them as reducing an existing social harm (e.g., obesity). Second, to establish the desirable health outcome – making people eat healthier – policy-makers should ensure that people take notice of and understand the labels. In our study, showing simple graphics of the label did not increase WTP compared to the baseline. However, studies have shown that ‘traffic light’ labels that reduce the cognitive tax of understanding the labels can be more effective at reducing caloric consumption (Beard et al., Reference Beard, Nowson and Riley2007).
Finally, this policy will have a differential impact on various segments of the population. Our study indicates that younger and more educated individuals are willing to pay more for calorie labels. However, these individuals might not be the ones most impacted by the policy. Previous studies have shown that the impact of calorie labels on reducing caloric intake is highest among individuals with high body mass indices. Given this, there could be misalignment between those who are willing to pay most for the information and those who are most likely to benefit from it. As a result, public health outcomes may improve under this policy, but this may come at the price of hedonic losses to a particular segment of the population.
Conclusion
In this paper, we analyzed whether a policy to implement calorie information in restaurant menus would lead to a Kaldor–Hicks improvement. We recruited 642 subjects from Amazon's Mechanical Turk to measure WTP for and against this policy. To ensure robustness, we provided additional information on the private and public benefits of the labels. Information on private benefits, particularly on the effectiveness of the labels at reducing calorie consumption for an individual, doubled the WTP for the supporters of the policy. Providing information on the benefits of the labels to the society – in terms of a reduction in obesity and economic savings – had a negative impact on WTP. However, despite this, our findings suggest a net welfare gain from this policy. People were willing to pay between 1.0% and 2.2% of their annual restaurant budgets for calorie labels. These findings are confirmed by the well-being measure: the average happiness of those in favor of the policy was significantly greater than the average unhappiness of those against it. A back-of-the-envelope calculation shows that the net welfare gain from this policy is at least $1.6 billion.
However, to maximize the success of the policy and consumer welfare, adequate attention should be paid to the framing of the messaging and the design of the labels. Messaging around public benefits – in terms of a reduction in obesity and economic savings – is perceived less favorably and as reducing consumer welfare. Instead, policy-makers should focus on the intent behind the policy in providing additional information to the consumer so that they can make healthier, more informed choices. Finally, it is important to recognize that the policy will have a differential impact on different segments of the population. While net welfare will increase and public health outcomes could improve, this may come at the cost of hedonic losses to the particular segments of the population most affected by the policy.
Acknowledgments
I would like to thank Cass Sunstein for the valuable feedback and funding for this study. I am also grateful to the students in the Behavioral Economics, Law, and Public Policy Seminar at Harvard Law School for an invigorating discussion on the topic.