I. INTRODUCTION
The Ti–6Al–4V alloy is a (α + β) dual-phase titanium alloy and has been widely used in the aerospace, energy, and automotive industry due to its high specific strength, high corrosion resistance, and excellent mechanical properties.Reference Luo, Su, Guo and Fu1–Reference Zhao, Ding, Zhong and Lee6 Due to the poor cold formability, Ti–6Al–4V alloys are commonly processed at high temperature to manufacture structural components.Reference Wang, Wang, Luo, Liu, Tang, Li, Chen, Su, Guo and Fu2,Reference Zhang, Ding, Cai, Yang and Li7 In the cast condition or after intermediate β processing, the Ti–6Al–4V alloy is usually characterized by coarse prior β grains, within which it comprises secondary lath-shaped α phase and intergranular β phase (β transformed microstructure).Reference Roy and Suwas8,Reference Cai, Gao, Teng, Li, Pan, Song, Yan, Wei and Shi9 However, stress concentration can be easily generated in this type of microstructure, which leads to difficult coordination deformation during plastic deformation. Thus, the Ti–6Al–4V alloy with lamellar structure is usually processed to semiproducts via hot upsetting pressing, cogging, or extrusion in the α + β regime,Reference Seshacharyulu, Medeiros, Frazier and Prasad10,Reference Seshacharyulu, Medeiros, Frazier and Prasad11 by which the lamellar microstructure can be optimized to desired equiaxed morphology. Hence, investigation on the hot deformation behavior of the Ti–6Al–4V alloy with starting lamellar microstructure in the α + β regime is of significance.
The hot deformation behavior of the Ti–6Al–4V alloy with starting fully lamellar microstructure has been widely studied in the past, and much attention has been focused on the flow behavior and microstructural evolution.Reference Zhang, Qu, Feng, Shen and Chen3,Reference Roy and Suwas8,Reference Seshacharyulu, Medeiros, Frazier and Prasad11–Reference Kim, Semiatin and Lee14 For instance, Seshacharyulu et al.Reference Seshacharyulu, Medeiros, Frazier and Prasad11 studied the softening behavior of the Ti–6Al–4V alloy with starting lamellar structure during hot working and observed that the alloy exhibited wide regime of flow instability dominated by adiabatic shear bands and lamellae kinking at strain rates higher than 0.1 s−1 in the α + β phase field. As the strain rates increased above 1 s−1, intense flow localization occurred, which caused cracking along the bands. Shibayan et al.Reference Roy and Suwas8 investigated the influence of temperature and strain rate on the deformation response and microstructural evolution during hot compression of the Ti–6Al–4V alloy with lamellar microstructure. They found that steady state flow was observed to take place below 900 °C due to dynamic recovery (DRV) by self-diffusion, and substantial flow softening occurred at higher temperatures between 950 and 1000 °C due to globularization and dynamic recrystallization (DRX) of α lamellae. Kim et al.Reference Kim, Semiatin and Lee14 investigated the high-temperature deformation mechanisms of Ti–6Al–4V alloy with lamellar microstructure containing different alpha-platelet thicknesses during hot deformation and demonstrated that the dislocation glide and climb was dominated for all the microstructures. However, dislocation glide and climb as well as grain-boundary sliding were evident for heavily predeformed specimens. Although the Ti–6Al–4V alloy with starting lamellar microstructure has been widely studied in the aspects of flow behavior and microstructural evolution, there is still little research on the dependence of dynamic softening behavior on the power dissipation efficiency (η) and the construction of processing maps. Moreover, the research on the influence of α → β phase transformation temperature on the deformation activation energy is also limited.
The objective of the present study is to study the hot deformation behavior and microstructural evolution of the Ti–6Al–4V alloy with starting fully lamellar structure via a wide temperature and strain rate range. Based on the flow stress data, the true stress–strain curves, kinetics, power dissipation efficiency, and processing maps were investigated, in conjunction with the microstructural evolution during hot deformation.
II. EXPERIMENTAL PROCEDURES
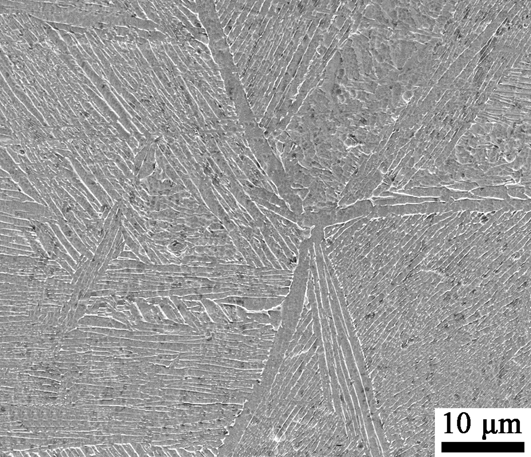
The material used in the present work was a commercial grade Ti–6Al–4V alloy in forged bar with a diameter of 80 mm. The α → β and α + β → β phase transformation temperatures were calculated to be 890 and 1000 °C, respectively, by using FORMASTOR-F II (Fuji Electronic Industrial Co., Ltd., Tokyo, Japan) full-automated phase transition instrument. To obtain full lamellar microstructure, the as-received forged material was subjected to a heat treatment at 1010 °C for 1 h and cooled in air, followed by further annealing at 550 °C for 3 h and subsequent air cooling to room temperature. The microstructure of the heat-treated Ti–6Al–4V alloy is shown in Fig. 1.
Lamellar microstructure of the heat-treated Ti–6Al–4V alloy.

Cylindrical specimens with a diameter of 8 mm and a height of 15 mm were machined from the heat-treated bar. Isothermal hot compression tests were conducted on a Gleeble-2000 simulator (Dynamic Systems Inc., New York, New York) in the temperature range from 700 to 1000 °C (the interval of 50 °C) with the strain rates of 0.001, 0.01, 0.1, 1, and 10 s−1 with the height reduction of 50%. The specimens were first heated to the designed temperatures, then held for 5 min, and finally compressed with a maximum height reduction of 50%. The tested specimens were quenched in water immediately after deformation to preserve the microstructural characteristics at deformed temperature.
The microstructural features of the deformed specimens were characterized by optical microscopy (OM), scanning electron microscopy (SEM), and transmission electron microscopy (TEM). The samples for OM and SEM were ground with SiC papers to 3000 grit, and then electropolished in an electrolyte solution of 5% perchloric acid and 95% acetic acid, followed by etching in a 5 mL HF + 15 mL HNO3 + 75 mL water solution. TEM films were prepared through mechanical grounding, punching, and then twin-jet chemical polishing in electrolyte solution of 5% HCLO4, 35% C4H9OH, and 60% CH3OH at a voltage of 20 V at −25 °C.
III. RESULTS AND DISCUSSION
A. Flow stress–strain curves
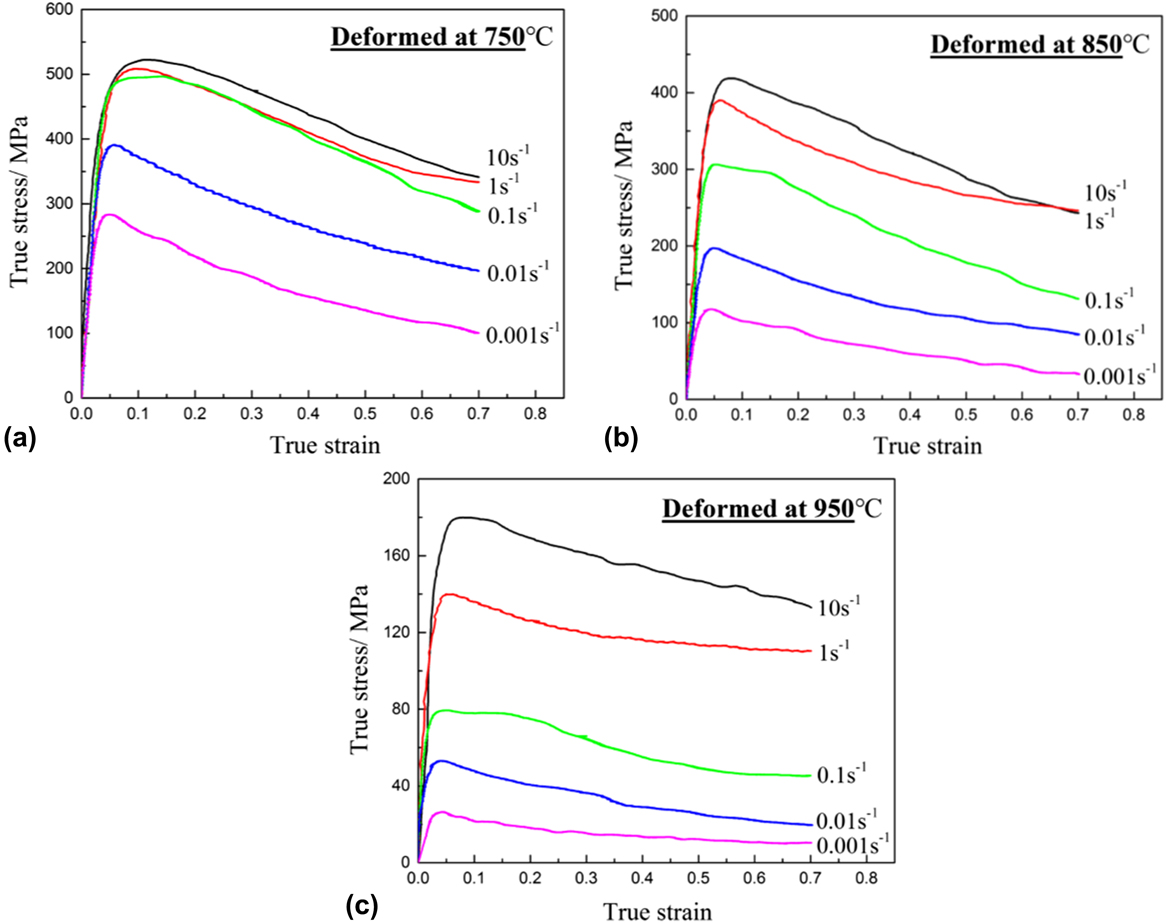
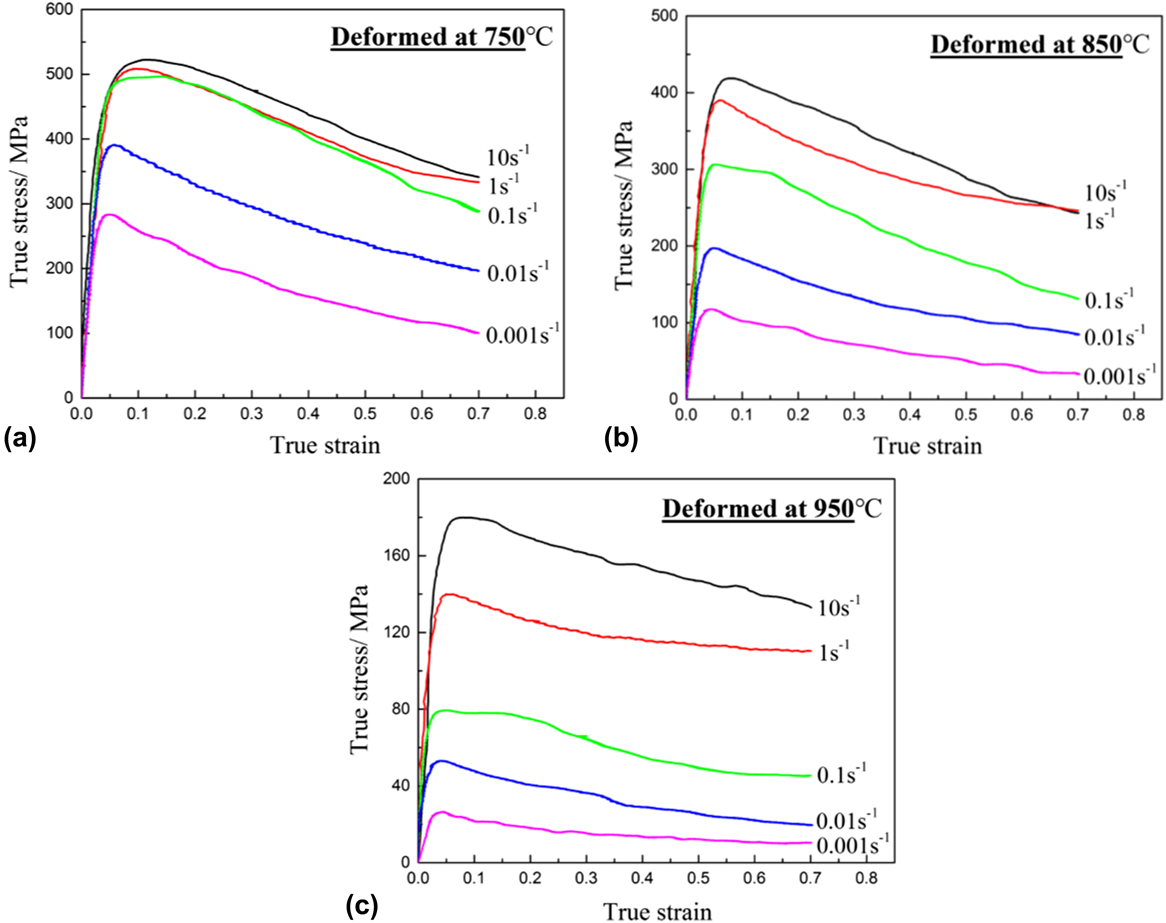
The true flow stress–strain curves of the specimens deformed at the strain rates of 0.001, 0.01, 0.1, 1, and 10 s−1 and the temperatures of 750, 850, and 950 °C are plotted in Fig. 2. It can be found that the flow stress decreases with the increase of temperature and decrease of strain rate. High temperature facilitates dislocation motion and annihilation as well as the occurrence of DRV and DRX, and the low strain rate provides sufficient time for energy accumulation.Reference Du, Jiang and Zhang15 Also, all the flow curves exhibit similar configuration under all the deformation conditions. At the initial deformation state, the flow stress increases drastically and reaches the peak point rapidly due to work hardening induced by dislocation generation, motion, and tangle formation. Afterward, the flow stress decreases gradually with the increasing strain, which is mainly owing to the dynamic softening behavior including DRV and DRX.Reference Wang, Wang, Luo, Liu, Tang, Li, Chen, Su, Guo and Fu2,Reference Du, Jiang and Zhang15,Reference Zhao, Ding, Jiang, Wei and Linghu16 Therefore, the flow behavior is affected by the combination of work hardening and dynamic softening.Reference Du, Jiang and Zhang15
True flow stress–strain curves of the Ti–6Al–4V alloy deformed at different temperatures: (a) 750 °C, (b) 850 °C, and (c) 950 °C.
B. Kinetics analysis
The effect of deformation temperature and strain rate on flow behavior can be expressed by the Zener–Hollomon (Z) parameter in an exponent-type equation asReference Peng, Guo, Shi, Qin and Zhao17
 $$Z = \dot{\varepsilon }\exp \left( {{Q \over {RT}}} \right)\quad ,$$
where  $\dot{\varepsilon }$ is the strain rate, Q is the activation energy of hot deformation, R is the gas constant, and T is the deformation temperature.
The Arrhenius-type equations are widely utilized to describe the relationship among strain rate ( $\dot{\varepsilon }$, s−1), flow stress (σ, MPa), and deformation temperature (T, °C), and there are three types of Arrhenius equations,Reference Peng, Guo, Shi, Qin and Zhao17–Reference Zhao, Ding, Zhao, Huang, Wei and Jiang19 as follows:
 $$\dot{\varepsilon } = {\rm{\ }}C{\sigma ^m}\exp \left( { - {Q \over {RT}}} \right)\quad \alpha \sigma \lt 0.8\quad ,$$
 $$\dot{\varepsilon } = B\exp \left( {\beta \sigma } \right)\exp \left( { - {Q \over {RT}}} \right)\quad \alpha \sigma > 1.2\quad ,$$
 $$\dot{\varepsilon } = A{\left[ {\sinh \left( {\alpha \sigma } \right)} \right]^n}\exp \left( { - {Q \over {RT}}} \right)\quad {\rm{for}}\;{\rm{all}}\;\sigma \quad ,$$
where Q is the deformation activation energy (kJ/mol), R is the gas constant (R = 8.314 J/mol K), T is the deformation temperature, A, B, C are the material constants, n is the stress exponent, and α = β/n. Either Eqs. (2) or (3) is just the special expression of Eq. (4).
Taking natural logarithm on both sides of Eqs. (2) and (3), the values of n and β can be calculated as follows:
 $$n = {1 \over m} = {{\partial \ln \dot{\varepsilon }} \over {\partial \ln \sigma }}\quad ,$$
 $$\beta = {{\partial \ln \dot{\varepsilon }} \over {\partial \sigma }}\quad .$$
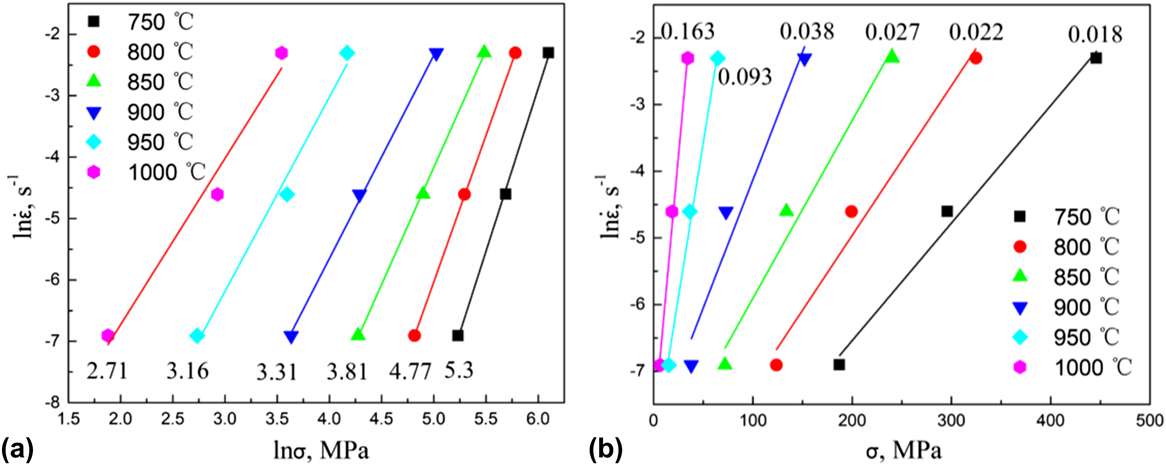
The slopes of linear fitting for  $\ln \sigma - \ln \dot{\varepsilon }$ and
 $\sigma - \ln \dot{\varepsilon }$ at the condition of ε = 0.3 are shown in Figs. 3(a) and 3(b), respectively, and the values of n and β for 750–850 °C are 4.63 and 0.022, for 900–1000 °C are 3.06 and 0.098, respectively. So the α values of 0.005 for 750–850 °C and 0.032 for 900–1000 °C are calculated, respectively. Since the values of ασ in the present work are from 0.21 to 4.87 and some values are included in 0.8–1.2, so the Eq. (4) is utilized in the present study.
Relationship between (a)  $\ln \dot{\varepsilon } - \ln \sigma$; (b)
 $\ln \dot{\varepsilon } - \sigma$.
Taking natural logarithm on both sides of Eq. (4) and then the value of Q can be obtained from Eq. (7) as follows:
 $$Q = R\left[ {{{\partial \ln \sinh \left( {\alpha \sigma } \right)} \over {\partial \left( {{1 / T}} \right)}}} \right]\left[ {{{\partial \ln \dot{\varepsilon }} \over {\partial \ln \sinh \left( {\alpha \sigma } \right)}}} \right]\quad .$$
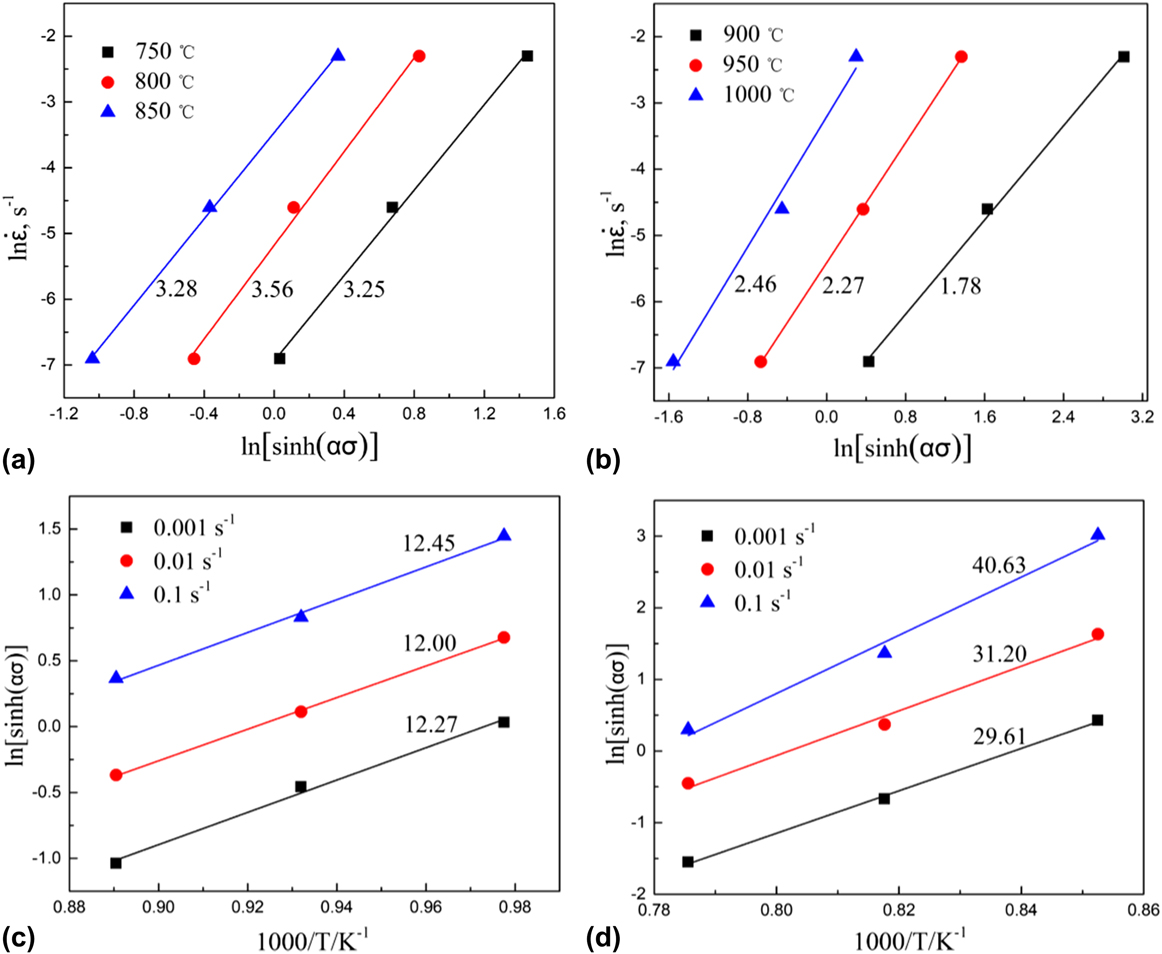
The slopes of linear fitting of  $\ln \sinh \left( {\alpha \sigma } \right) - \ln \dot{\varepsilon }$ and ln[sinh(ασ)] − 1000/T for 750–850 °C and 900–1000 °C are exhibited in Figs. 4(a)–4(d), respectively, and then the
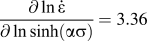 ${{\partial \ln \dot{\varepsilon }} \over {\partial \ln \sinh \left( {\alpha \sigma } \right)}} = 3.36$ and
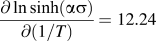 ${{\partial \ln \sinh \left( {\alpha \sigma } \right)} \over {\partial \left( {{1 / T}} \right)}} = 12.24$ for 750–850 °C, and
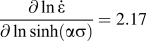 ${{\partial \ln \dot{\varepsilon }} \over {\partial \ln \sinh \left( {\alpha \sigma } \right)}} = 2.17$ and
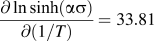 ${{\partial \ln \sinh \left( {\alpha \sigma } \right)} \over {\partial \left( {{1 / T}} \right)}} = 33.81$ for 900–1000 °C are obtained. Thus, the apparent activation energy (Q app) is determined to be 342 kJ/mol for 750–850 °C and 610 kJ/mol for 900–1000 °C.
Relationship between  $\ln \dot{\varepsilon } - \ln \left[ {\sinh \left( {\alpha \sigma } \right)} \right]$ for (a) 750–850 °C and (b) 900–1000 °C, as well as the relationship between ln [sinh(ασ)] − 1000/T for (c) 750–850 °C and (d) 900–1000 °C.
The hot deformation of alloys involves a thermally activating process, and the indicator of deformation difficulty is usually characterized by deformation activation energy, which represents the barrier for elements and vacancies migration with strong sensitivity to material contents and temperature.Reference Shi, Mao and Chen20,Reference Ning, Xie, Liang, Li, Yang and Guo21 Moreover, it is well known that the self-diffusion activation energy (Q self) of 150 kJ/mol for α-titaniumReference Roy and Suwas8,Reference Seshacharyulu, Medeiros, Frazier and Prasad10 is different from the Q self of 97 kJ/mol for β-titanium.Reference Ning, Xie, Liang, Li, Yang and Guo21 In the present work, as the Ti–6Al–4V alloy utilized has a α → β phase transformation temperature of about 890 °C, the volume fraction of the β phase would not change too much as the deformation temperature is below 890 °C. The volume fraction of the β phase would increase drastically when the deformation temperature is elevated over the α → β phase transformation temperature,Reference Seshacharyulu, Medeiros, Frazier and Prasad10 which influences the deformation activation energy. Thus, the deformation temperatures are divided into two ranges, i.e., 750–850 °C and 900–1000 °C, to eliminate the effect of the volume fraction β phase on the deformation activation energy.
The dynamic softening mechanism during hot compression can be understood by comparing the apparent activation energy Q app with the self-diffusion activation energy Q self.Reference Shi, Mao and Chen20,Reference Ning, Xie, Liang, Li, Yang and Guo21 DRV is controlled by diffusion with the activation energy Q app ≈ Q self. DRV is related to the dislocation slipping and climbing and can result in the dislocation rearrangement and elimination. Differently, DRX is characterized by subgrain nucleation and growth, as well as the migration of high angle boundaries with high energy, during which, the apparent activation energy is greater than the self-diffusion activation energy, i.e., Q app > Q self.Reference Ning, Xie, Liang, Li, Yang and Guo21
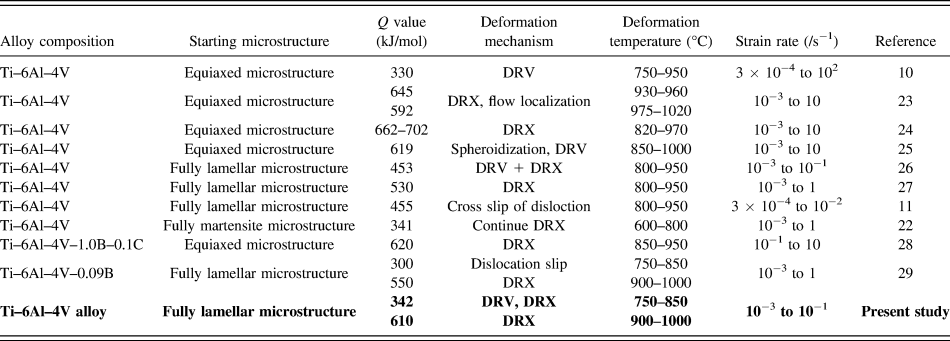
In the present study, the values of apparent activation energy calculated at 750–850 °C and 900–1000 °C are 342 kJ/mol and 610 kJ/mol, respectively, which are both significantly higher than the Q self values of α-titaniumReference Roy and Suwas8,Reference Seshacharyulu, Medeiros, Frazier and Prasad10 or β-titanium,Reference Ning, Xie, Liang, Li, Yang and Guo21 indicating that the softening mechanism during hot compression is mainly DRX. The Q app values computed by a number of previous researchers are summarized in Table I. It can be seen that the deformation activation energy for Ti–6Al–4V alloys is within the range of 330–702 kJ/mol. This wide range can be ascribed by the initial microstructure and hot deformation conditions including the deformation temperature and strain rate, which result in different deformation mechanisms.Reference Chao, Hodgson and Beladi22 From Table I, it can be concluded that the low- and high-end values of Q app corresponding to DRX are in the range of 341–702 kJ/mol. DRV is characterized by Q app in the range of 300–455 kJ/mol. It is obvious that the Q app of 610 kJ/mol at 900–1000 °C in the present work is within the range of DRX, demonstrating that the hot deformation process is controlled by DRX at the temperature of 900–1000 °C. While in the temperature range of 750–850 °C, the Q app of 342 kJ/mol is within the range of DRX and DRV, as an indicator that the deformation mechanism is dominated by DRX together with DRV.
The apparent deformation energy (Q) of the Ti–6Al–4V alloy during the hot compression test.

In addition, the Q app of 610 kJ/mol at 900–1000 °C is higher than 342 kJ/mol at 750–850 °C. At a low temperature regime of 750–850 °C, DRV may still take place though the main dynamic softening behavior is DRX, whereas at a high temperature regime of 900–1000 °C, the dynamic softening behavior is dominated by DRX. Thus, in the present study, the Q app at high temperature regime is higher than that at low temperature, which is consistent with the result reported by Ning et al.Reference Ning, Xie, Liang, Li, Yang and Guo21
C. Power dissipation efficiency and processing maps
1. Power dissipation efficiency and dynamic softening behavior
According to the principle of the dynamic material model,Reference Raj and Pharr30 the work-piece during hot deformation is treated as a power dissipator with the assumption that the deformed material is regarded as a closed adiabatic system.Reference Ning, Xie, Liang, Li, Yang and Guo21 The power dissipation (P) consists of two complementary functions, G content and J co-content. The first part G is dissipated by plastic deformation, leading to the temperature rising of the work-piece, while the other part J is absorbed by the deformation material, resulting in DRV, DRX, cavity formation, superplastic flow, phase transformation, etc.Reference Wen, Lin, Li, Chen, Deng and Li31 The power dissipation can be represented as a function of flow stress, strain, and strain rate:
 $$P = \sigma \dot{\varepsilon } = G + J = \int_0^{\dot{\varepsilon }} {\sigma {\rm{d}}\dot{\varepsilon }} + \int_0^{\sigma }} {\dot{\varepsilon }{\rm{d}}\sigma } \quad .$$
The flow stress can be expressed as follows:
 $$\sigma = K{\dot{\varepsilon }^m}\quad ,$$
where K is the material constant and m is the strain rate sensitivity coefficient.
 $$m = {{{\rm{d}}J} \over {{\rm{d}}G}} = {{{\rm{d}}\left( {\ln \sigma } \right)} \over {{\rm{d}}\left( {\ln \dot{\varepsilon }} \right)}}\quad .$$
The J co-content can be represented by
 $$J = \int_0^\sigma {\dot{\varepsilon }{\rm{d}}\sigma } = {m \over {m + 1}}\sigma \dot{\varepsilon }\quad .$$
Then the power dissipation efficiency η can be represented by
 $$\eta = {J \over {{J_{\max }}}} = {{2m} \over {m + 1}}\quad .$$
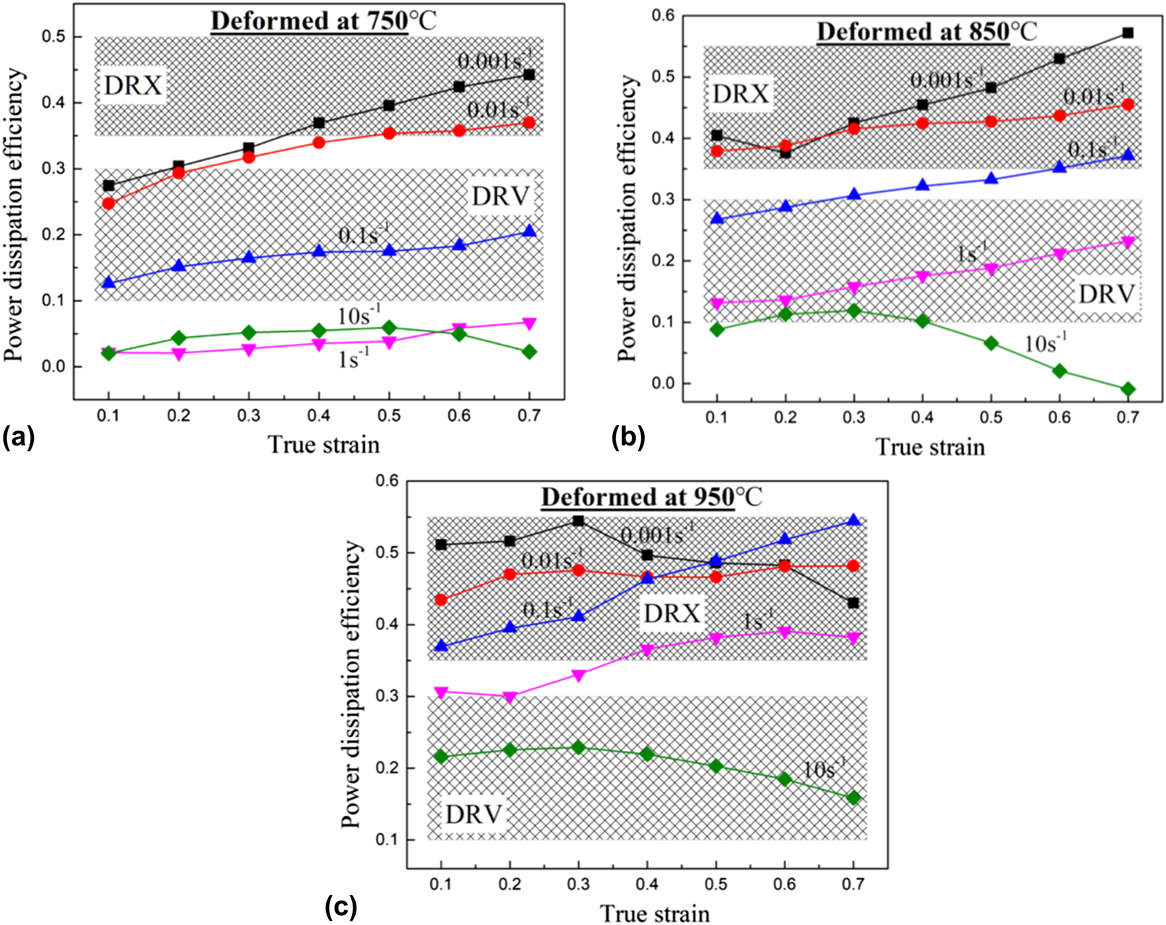
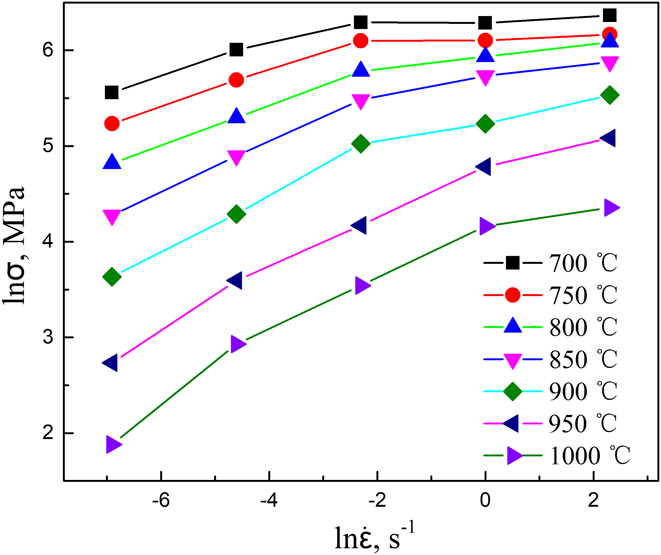
The plots of ln(σ) versus  $\ln \left( {\dot{\varepsilon }} \right)$ of the Ti–6Al–4V alloy at different temperatures are shown in Fig. 5. Taking differential coefficient of every value of ln(σ) at different strain rates and deformation temperatures, m values at different strain rates and deformation temperatures are obtained. Finally, the power dissipation efficiency η is calculated according to Eq. (12). The power dissipation efficiency η is relevant to the material dynamic softening that operated in a given regime of temperature and strain rate.Reference Peng, Guo, Shi, Qin, Zhao and Yao23 DRV occurs when the value of η is within 0.1–0.3, whereas DRX takes place when the value of η is within 0.35–0.55.Reference Du, Jiang and Zhang15,Reference Ning, Xie, Liang, Li, Yang and Guo21,Reference Wen, Lin, Li, Chen, Deng and Li31,Reference Liu, Ning, Yao and Guo32
Variation of ln (σ) versus  $\ln \left( {\dot{\varepsilon }} \right)$ at different temperatures for the Ti–6Al–4V alloy.
The variations of power dissipation efficiency η as a function of true strain at different strain rates and temperatures are plotted in Fig. 6, in which the DRV and DRX regimes are also indicated. It can be found that η is sensitive to strain, strain rate, and deformation temperature. Generally, the values of η increase with increasing the strain and decreasing the strain rate at relatively low temperatures of 750 and 850 °C, except those under conditions of 10 s−1 and 850 °C. It is attributed to the fact that the low strain rate and increasing strain provide sufficient time and energy for dynamic softening. At the deformation temperature of 950 °C, there exists a similar increasing trend of η with the decrease of strain rate, but the effects of strain on power dissipation efficiency are not significant, especially at the strain rates of 0.001 and 0.01 s−1. The main reason for this phenomenon is due to the sufficient energy that has been absorbed for DRX at the early deformation stage at a temperature of 950 °C. In addition, it can be observed from Figs. 6(a)–6(c) that η increases with increasing the deformation temperature owing to that high temperature is beneficial to dynamic softening.
Variations of power dissipation efficiency and true strain at different strain rates: (a) 750 °C, (b) 850 °C, and (c) 950 °C.

At low strain rates of 0.001 and 0.01 s−1, the dynamic softening mechanism is DRX with the strain over 0.4 at 750 °C. However, when the deformation temperature increases up to 850 °C, DRX occurs for all the strains at the strain rates of 0.001 and 0.01 s−1. At 950 °C, as shown in Fig. 6(c), η maintains a high level distributing in the DRX region at the strain rates of 0.001, 0.01, and 0.1 s−1. Even at a high strain rate of 1 s−1, η is also located in the DRX region as the strain is elevated to 0.4. Thus, an increase in temperature and strain, or a decrease in strain rate facilitates the occurrence of DRX.
2. Processing maps
The flow instability can be identified by Prasad instability criterion asReference Wen, Lin, Li, Chen, Deng and Li31,Reference Chen, Liu, Liu, Tang, Luo, Feng, Li and Fu33
 $$\xi \left( {\dot{\varepsilon }} \right) = {{\partial \ln \left( {{m \over {m + 1}}} \right)} \over {\partial \ln \dot{\varepsilon }}} + m \le 0\quad .$$
The instability map is constituted by the variation of  $\xi \left( {\dot{\varepsilon }} \right)$ at different temperatures and strain rates, and the flow instability is predicted to occur when the
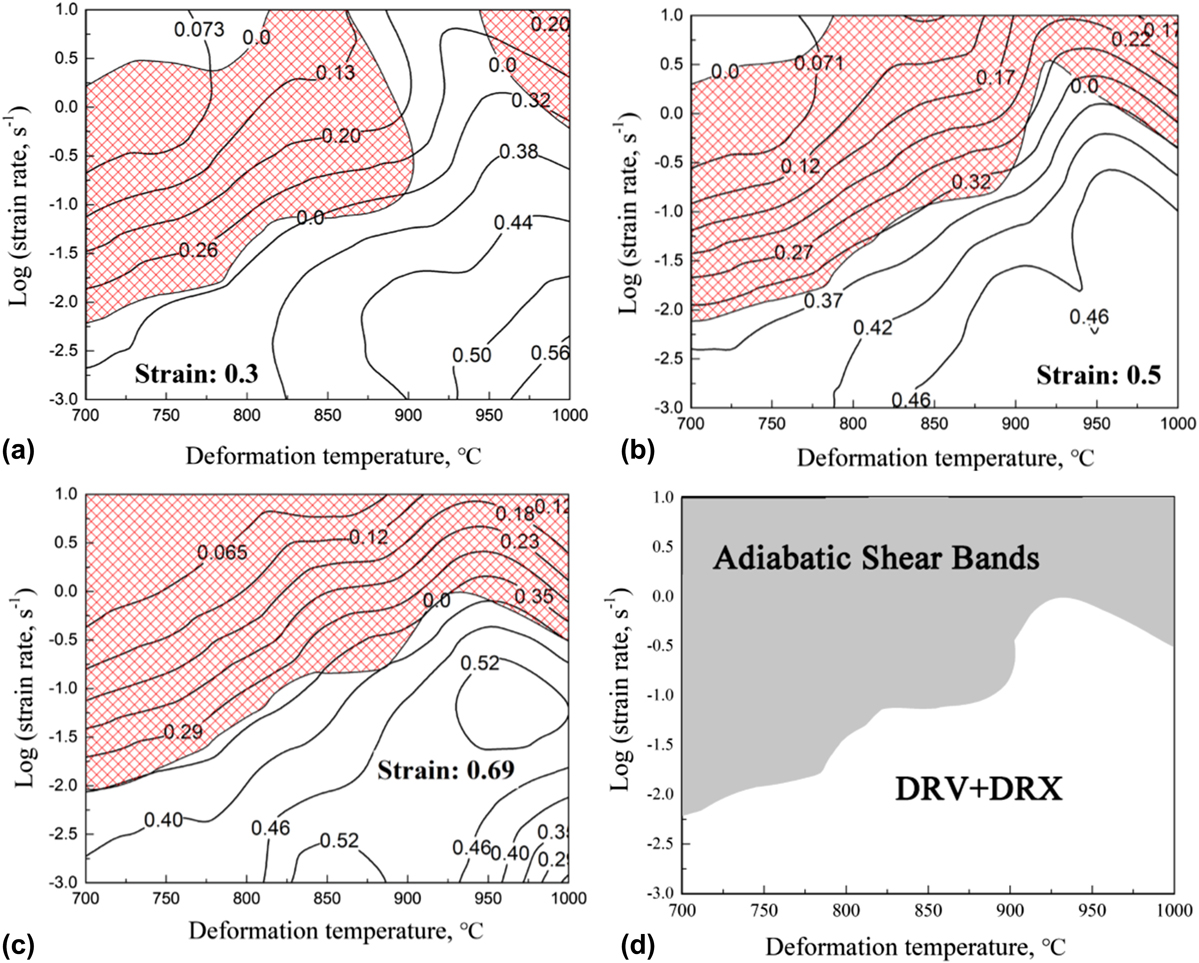
 $\xi \left( {\dot{\varepsilon }} \right) \lt 0$. Afterward, superposing the instability map to the power efficiency distribution, the processing maps of the Ti–6Al–4V alloy with starting lamellar microstructure in the temperature range of 700–1000 °C and strain rate range of 0.001–10 s−1 at the strains of 0.3, 0.5, and 0.69 and all the strain are displayed in Fig. 7. In Figs. 7(a)–7(c), the safe domain and unsafe domain (the red shadows) are indicated. The curves are the contours of the efficiency of power dissipation η.
Processing maps of the Ti–6Al–4V alloy at the strains of (a) 0.3, (b) 0.5, (c) 0.69, and (d) all the strains.

It can be found from the processing maps that high values of η appear at the bottom of the maps (safe domain) with relatively low strain rate at all the temperatures. It demonstrates that low strain rate and high temperature are in favor of occurrence of high value of η and further promote stable flow during hot deformation. Moreover, it is noticed that a distinct change in the curvature of the iso-efficiency curves appears in the temperature range of 925–950 °C for all the tested strain rates, indicating that phase transformation from α + β → β has occurred.Reference Peng, Guo, Shi, Qin, Zhao and Yao23 As the phase transformation temperatures of 925–950 °C during hot deformation are much lower than that of ∼1000 °C under static conditions, the strain-induced phase transformation should have happened during the hot deformation process.Reference Peng, Guo, Shi, Qin, Zhao and Yao23,Reference Koike, Shimoyama, Ohnuma, Okamura, Kainuma, Ishida and Maruyama34,Reference Zhang, Ding, Pereira, Huang and Langdon35
From Figs. 7(a)–7(c), it can be found that the strain has a significant effect on the shapes of instability regimes. The instability domain in the processing map expands with the increase of strain and mainly appears in the region with low value of η, whereas the stable region becomes narrower as the strain is increased. It means that defects may not exist at a certain strain, but it may evolve into defects with the strain increasing.Reference Li, Lu, Wang, Fu and Cao36 Similar result has also been obtained in the research on the Ti–47.5Al–Cr–V alloy.Reference Du, Jiang and Zhang15 In practice, the strain distribution in the deformation specimen is not homogeneous. To ensure a stable and homogeneous material flow during hot deformation, a processing map being appropriate for all the strains are developed by superposing the processing maps with the strains of 0.3, 0.5, and 0.69, as shown in Fig. 7(d). It shows a large instability region for the entire testing temperatures. Moreover, the domain and shape of the instability are similar to that in Fig. 7(c) at the strain of 0.69. Therefore, the instability domain is mainly depended on high strain. Based on Fig. 7(d), the preferable processing regime should be located at high temperatures and low strain rates, which can avoid the occurrence of instability during the hot deformation of the Ti–6Al–4V alloy with initial lamellar microstructure.
3. Microstructural evolution
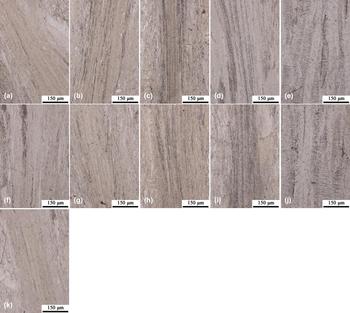
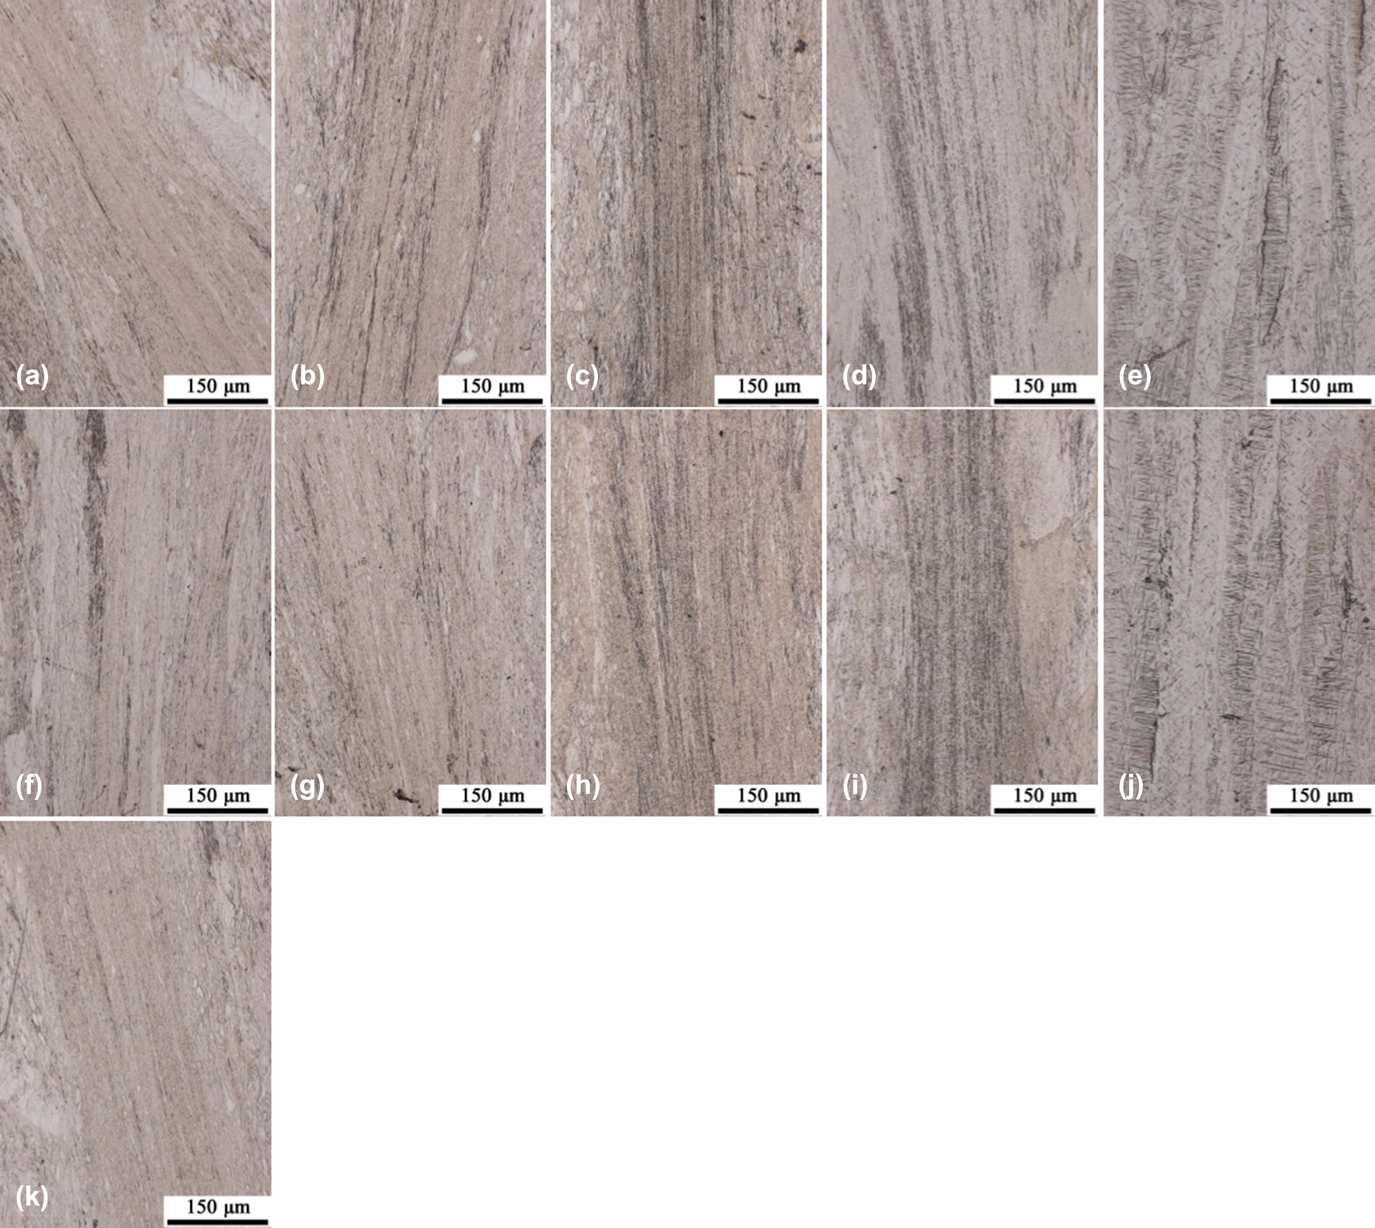
The predicted instability regime is validated by microstructural observations. A typical microstructure of the specimens deformed at the strain rates of 1–10 s−1 and temperatures of 750–1000 °C is shown in Figs. 8(a)–8(k). All the deformed specimens exhibit flow localization shear bands, and the intensity of them decreases with the increase of temperature and the decrease of strain rate. The formation of shear bands is thought to be owing to the adiabatic conditions created during hot deformation and the low conductivity of the Ti–6Al–4V alloy.Reference Seshacharyulu, Medeiros, Frazier and Prasad10,Reference Seshacharyulu, Medeiros, Frazier and Prasad11 During hot deformation, local plastic deformation induces much heat but cannot be carried away due to insufficient time at high strain rates, which decrease local flow stress and cause flow localization.Reference Seshacharyulu, Medeiros, Frazier and Prasad11 These results are similar to that reported in the Ti–6Al–4V alloy with initial lamellar microstructure by Seshacharyulu et al.Reference Seshacharyulu, Medeiros, Frazier and Prasad11 Seshacharyulu et al.Reference Seshacharyulu, Medeiros, Frazier and Prasad11 observed cracks in the specimens deformed at temperatures below 800 °C and strain rates above 1 s−1. Differently, no cracks are observed in the specimens deformed under the same processing conditions in the present study.
OM microstructure of the specimens deformed in the temperature range of 750–1000 °C at the strain rate of 0.1–10 s−1: (a) 750 °C and 10 s−1, (b) 850 °C and 10 s−1, (c) 900 °C and 10 s−1, (d) 950 °C and 10 s−1, (e) 1000 °C and 10 s−1, (f) 750 °C and 1 s−1, (g) 850 °C and 1 s−1, (h) 900 °C and 1 s−1, (i) 950 °C and 1 s−1, (j) 1000 °C and 1 s−1, and (k) 750 °C and 0.1 s−1.
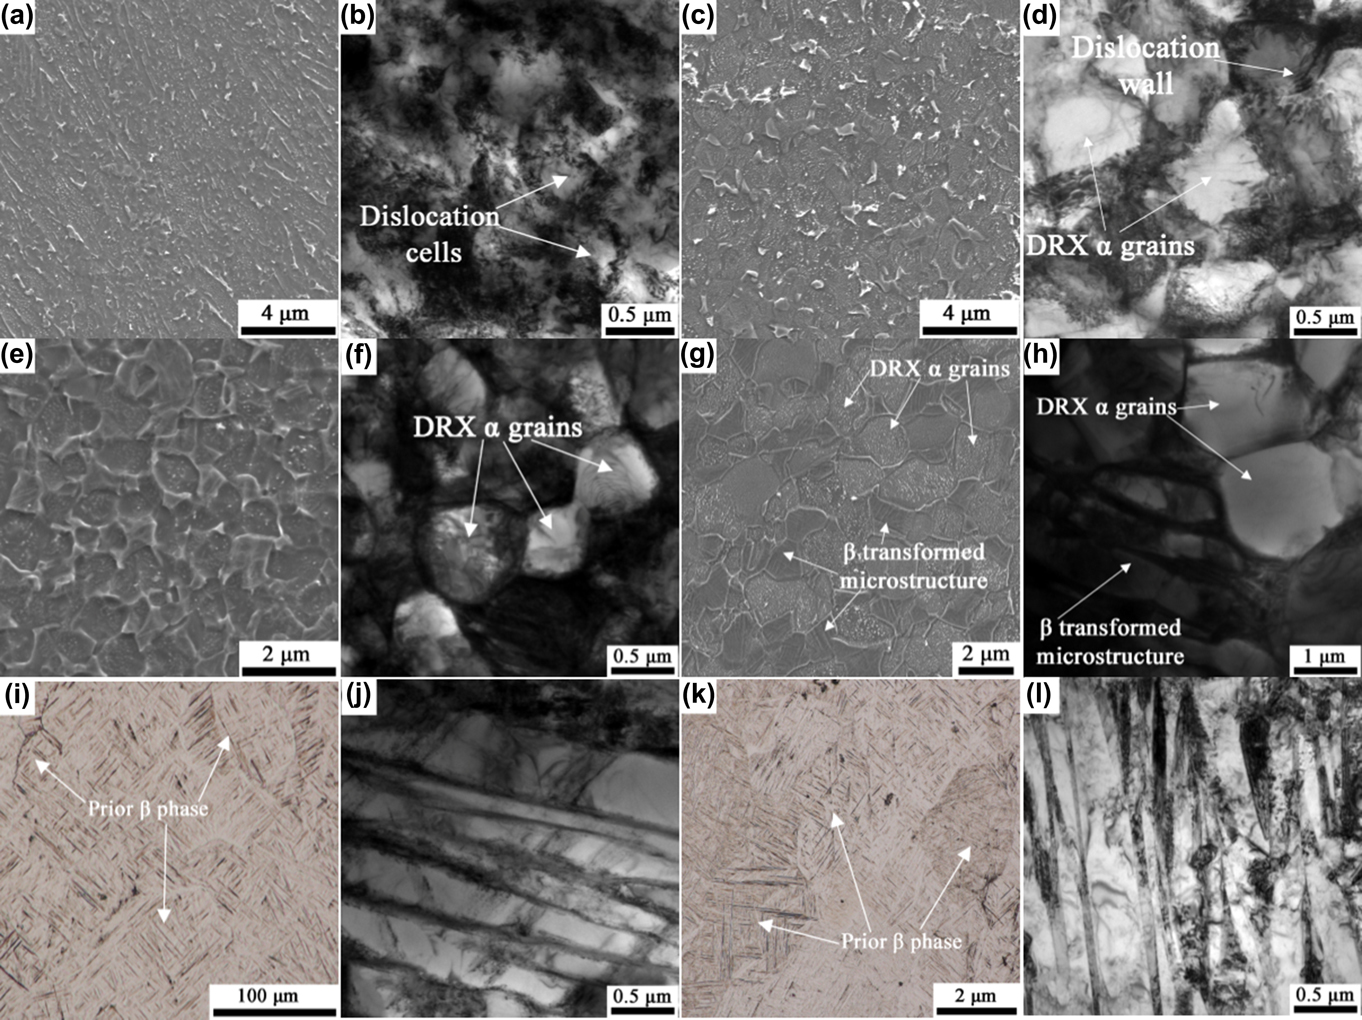
The deformed specimens at the true strain of 0.69 are characterized using OM, SEM, and TEM to reveal the microstructural evolution and dynamic softening mechanism of the Ti–6A–4V alloy with initial lamellar structure, as shown in Fig. 9. Figure 9(a) shows the microstructure of the as-compressed Ti–6Al–4V alloy at the strain rate of 0.1 s−1 and 750 °C. It can be seen that the microstructure exhibits mainly residual lamellar morphology, which may be attributed to that there was no sufficient time for DRX nucleation and growth. Based on Fig. 9(b), dislocation cells, which are an indicator of occurrence of DRV, exist in the specimen deformed. As the strain rate is decreased to 0.001 s−1, more time is provided for facilitating the occurrence of DRX. The initial lamellar structure is nearly fully transformed to equiaxed grains, as shown in Figs. 9(c) and 9(d). Even so, DRV still exists which are evidenced by dislocation walls, as shown in Fig. 9(d). According to the microstructural characteristics of the deformed specimens at 750 °C, it can be concluded that the hot deformation undergoes dynamic softening of DRV at high strain rate and DRX at low strain rate, which is consistent with the results shown in Fig. 6(a).
OM, SEM, and TEM images for the deformed specimens with the strain of 0.69 at the temperature and strain rate of 0.1 s−1 and 750 °C for (a) and (b), 0.001 s−1 and 750 °C for (c) and (d), 0.1 s−1 and 850 °C for (e) and (f), 0.001 s−1 and 850 °C for (g) and (h), 0.1 s−1 and 950 °C for (i) and (j), and 0.001 s−1 and 950 °C for (k) and (l). Here, the TEM image corresponded to SEM or OM image on its left side.
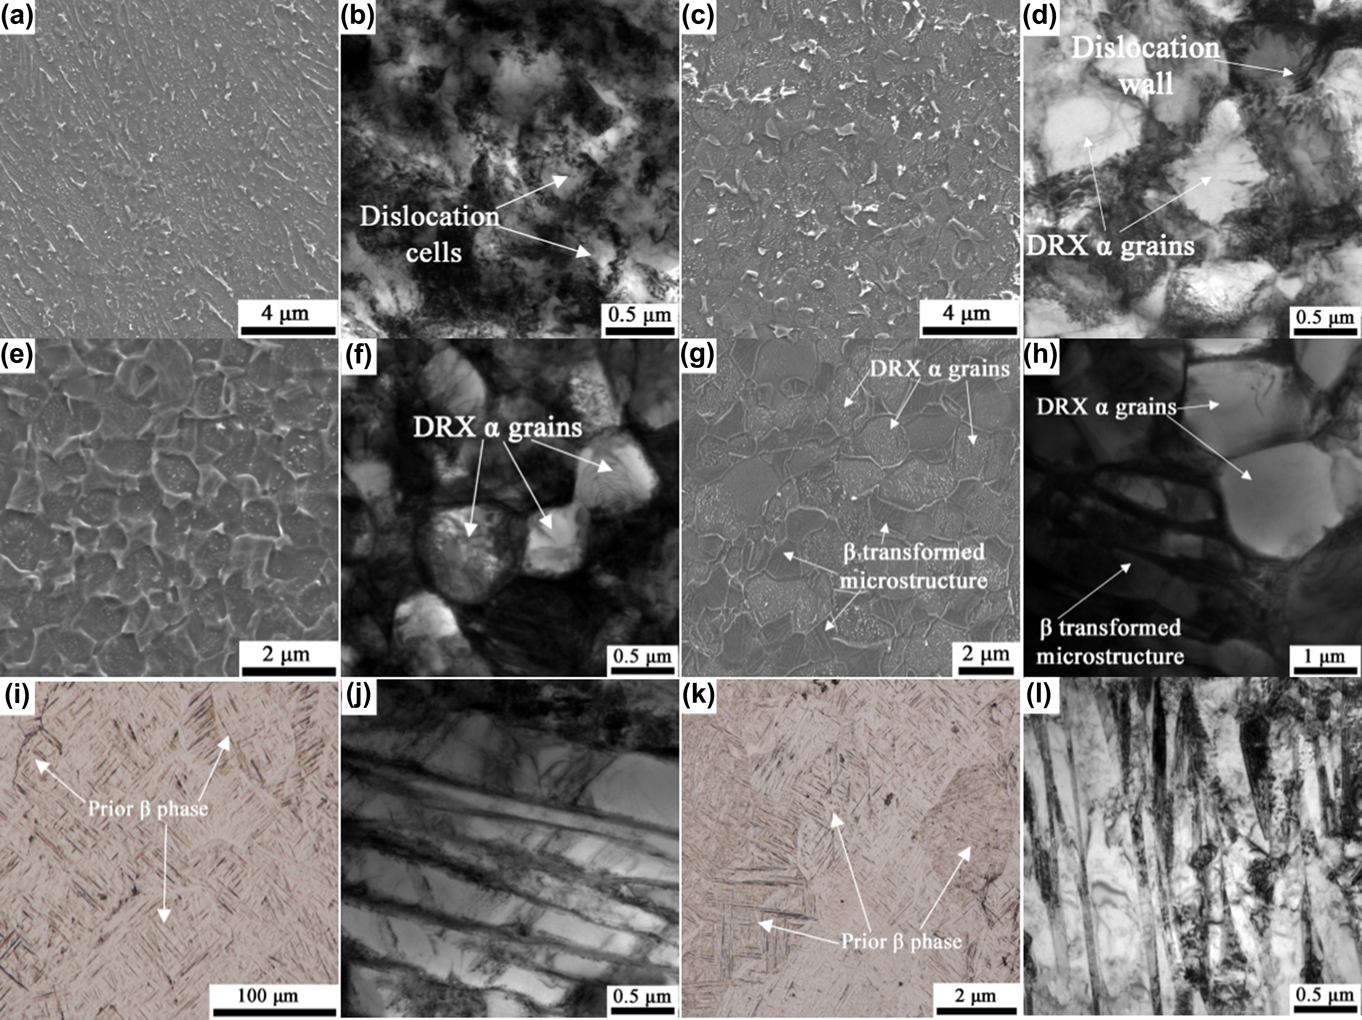
Figure 9(e) shows the SEM image of the specimen deformed at 0.1 s−1 and 850 °C. Compared with the specimen deformed at 750 °C with the same strain rate of 0.1 s−1, the residual lamellar structure disappears and fully transforms to equiaxed grains. The newly formed uniform and equiaxed α grains with little dislocations are demonstrated in Fig. 9(f). The occurrence of equiaxed grains are a result of DRX, which is attributed to the sufficient activation energy generated as the deformation temperature is elevated to 850 °C. The microstructure of the specimen deformed at a strain rate of 0.001 s−1 and a temperature of 850 °C is demonstrated in Figs. 9(g) and 9(h). It exhibits a duplex microstructure which consists of recrystallized α grains and β transformed microstructure (accounting for about 40%), as demonstrated by the light and dark color regions in Fig. 9(g), respectively. Figure 9(h) shows the TEM microstructure of the deformed specimen at 0.001 s−1 and 850 °C, a fine lamellar structure can be observed. This lamellar microstructure is thought to be formed during cooling to room temperature in the prior β phase after deformation.Reference Koike, Shimoyama, Ohnuma, Okamura, Kainuma, Ishida and Maruyama34 Therefore, the β-transformed microstructure is considered as the β phase during hot deformation at testing temperature. Moreover, it can be noticed that the prior β phase is characterized as exquiaxed morphology during the deformation process at testing temperature. Thus, both α phase and β phase undergo dynamic softening of DRX during the hot compression process. In addition, the volume fraction of β transformed microstructure is about 40%, which is greater than that at room temperature (about 10%). Since the temperature of phase transformation from α to β is about 890 °C, which is higher than the deformation temperature of 850 °C, strain-induced phase transformation should have occurred. Meanwhile, strain has lowered the temperature of phase transformation from α to β 40 °C approximately.
When the deformation temperature is elevated to 950 °C, the microstructure is transformed to lamellar structure at the strain rates of both 0.1 and 0.001 s−1, as shown in Figs. 9(i)–9(l). This indicates that the deformation takes place in the β phase field. Therefore, the deformation temperature of 950 °C was much lower than the β-transus temperature of ∼1000 °C in the present Ti–6Al–4V alloy, which further confirmed the presence of strain-induced phase transformation and β-transus temperature lowered about 50 °C by strain. In addition, equiaxed prior β grains are observed at 950 °C, as shown in Figs. 9(i) and 9(k), which confirms the occurrence of DRX in the β-phase field during hot deformation.
IV. CONCLUSIONS
Hot deformation behavior of the Ti–6Al–4V alloy with starting fully lamellar microstructure was investigated by isothermal compression tests in the temperature range of 700–1000 °C and strain rate range from 0.001 to 10 s−1. The flow stress–strain curves, kinetics, and processing maps were studied, in conjunction with microstructural observation. The following conclusions have been obtained:
(1) The flow stress of the present Ti–6Al–4V alloy had a negative dependence on temperature and a positive dependence on strain rate. Work hardening at initial deformation state and subsequent flow softening appeared for all the flow true stress–strain curves.
(2) Using Arrhenius equation, the apparent activation energy was computed to be 342 kJ/mol for 750–850 °C, which was below the temperature (∼890 °C) of phase transformation from α to β phase. However, a higher apparent activation energy of 610 kJ/mol in the high temperature regime of 900–1000 °C above 890 °C was obtained. The deformation mechanism in the temperature of 900–1000 °C was DRX, whereas in relatively low temperature of 750–850 °C, the hot deformation behavior was dominated by DRX together with DRV.
(3) The relationship between the dynamic softening behavior of DRV/DRX and deformation parameters including deformation temperature, strain rate, and strain was analyzed by power dissipation efficiency η, which increased as the deformation temperature increased and strain rate decreased. In addition, the DRX tended to occur in the conditions of high temperature and low strain rate.
(4) According to the processing map, the instability domain increased with the strain increasing and it mainly located in the low temperature and high strain rate range. The appropriate processing parameters with low strain rates and high temperatures should be utilized.
(5) Instability flow was mainly ascribed to the presence of adiabatic shear bands, and the main dynamic softening mechanism has been confirmed as DRX together with DRV. In addition, the strain-induced phase transformation was observed.
ACKNOWLEDGMENT
The present work is financially supported by the National Natural Science Foundation of China under Grant No. 51334006.