Introduction
Seabirds are among the most threatened bird groups globally, with nearly half of all species in decline due to human activities (Croxall et al. Reference Croxall, Butchart, Lascalles, Stattersfield, Sullivan, Symes and Taylor2012). One of the most pervasive threats is incidental bycatch in fisheries, particularly gillnets and set nets, which are estimated to kill over 400,000 diving seabirds annually across 81 species (Žydelis et al. Reference Žydelis, Small and French2013). While much attention has focused on high-seas trawl fisheries, inshore set-net fisheries, often small-scale and poorly monitored, pose a serious but under-recognised threat to coastal species (Cleasby et al. Reference Cleasby, Wilson, Crawford, Owen, Rouxel and Bolton2022; Pavés et al. Reference Pavés, Sepúlveda, Goyeneche, Espinoza and Oliva2025; Pereira et al. Reference Pereira, Ramos, Almeida, Marçalo, Carvalho and Fagundes2025).
Set nets deployed in coastal waters near breeding colonies and core foraging areas pose a risk to pursuit-diving birds such as cormorants and shags (Phalacrocoracidae), which frequently forage in turbid waters with low-visibility (Martin et al. Reference Martin, White and Butler2008; Peck-Richardson et al. Reference Peck-Richardson, Lyons, Roby, Cushing and Lerczak2018). These birds are disproportionately represented in global bycatch records (Žydelis et al. Reference Žydelis, Small and French2013), yet fine-scale data on where and when they encounter fishing gear remain limited, particularly in countries with poorly monitored inshore fisheries (Dietrich et al. Reference Dietrich, Kuletz and Moon2025).
Recent advances in biologging, especially GPS and time-depth recorders (TDRs), are transforming our understanding of seabird foraging ecology (Yoda Reference Yoda2019). These tools allow detailed mapping of movement and diving behaviour of cormorants, revealing patterns in habitat use, site fidelity, sex-specific foraging, and responses to environmental change (Cook et al. Reference Cook, Hamann, Pichegru, Bonadonna, Grémillet and Ryan2012; Lorentsen et al. Reference S.-H, Christensen-Dalsgaard and Mattisson2019; Peck-Richardson et al. Reference Peck-Richardson, Lyons, Roby, Cushing and Lerczak2018). Such data have also been instrumental in identifying spatial overlap with human activities and informing marine conservation planning (Christensen-Dalsgaard et al. Reference Christensen-Dalsgaard, Mattisson, Bekkby, Gundersen and May2017; Grémillet et al. Reference Grémillet, Gallien, El Ksabi and Courbin2020). Beyond advances in sensors, the ability to track individuals for multiple months rather than days or single foraging trips is a key advancement needed to understand seasonal shifts in distributions and behaviour (e.g. Muzaffar et al. Reference Muzaffar, Clarke, Whelan, Gubiani and Cook2017; Cansse et al. Reference Cansse, Lens, Orben, Sutton, Botha and Arnould2024) and to characterise impacts of human activities across the annual cycle.
New Zealand is a global hotspot of cormorant diversity, supporting 13 breeding species, eight of which are endemic. Most are inshore foraging specialists that require coastal habitats for resting and breeding, making them highly susceptible to habitat loss and disturbance, introduced predators, and to bycatch from inshore net fisheries. Six endemic species are currently listed as threatened or at risk under the Aotearoa New Zealand Threat Classification System (Robertson et al. Reference Robertson, Baird, Elliott, Hitchmough, McArthur and Makan2021), and 11 species documented in fisheries bycatch records from inshore net fisheries (Edwards et al. Reference Edwards, Peatman, Goad and Webber2023).
The kawau tikitiki (Spotted Shag Phalacrocorax punctatus, hereafter kawau tikitiki) is an endemic Aotearoa New Zealand shag with a fragmented distribution across the length of the country (Marchant and Higgins Reference Marchant and Higgins1990; Taylor Reference Taylor2000). In recognition of population declines across multiple regions, the species was recently elevated from “At Risk – Declining” to “Threatened – Nationally Vulnerable” under the New Zealand Threat Classification System (Robertson et al. Reference Robertson, Baird, Elliott, Hitchmough, McArthur and Makan2021). In the 1980s, the national population was estimated at 50,000–100,000 breeding pairs (Robertson and Bell Reference Robertson and Bell1984), with the South Island holding the largest colonies at Banks and Otago Peninsulas and also in the Marlborough Sounds. Banks Peninsula alone supported over 22,000 breeding pairs in 1996 (Doherty and Brager Reference Doherty and Brager1997), but this fell by 61% to just 8,573 pairs by 2020 (Christchurch City Council 2026). The national estimate has since been revised downward to <30,000 pairs (Taylor Reference Taylor2000). The Otago population remains stable at 1,000–2,000 pairs (Lalas Reference Lalas1983), while there are 1,254 breeding pairs across 193 colonies in the Marlborough Sounds (Bell Reference Bell2012), and 61 breeding pairs in Abel Tasman National Park (Chilvers Reference Chilvers2014). North Island populations are small and, in Auckland region, declining (Falla Reference Falla1932; Rawlence et al. Reference Rawlence, Rayner, Lovegrove, Stoddart, Vermeulen and Easton2019; Turbott Reference Turbott1956).
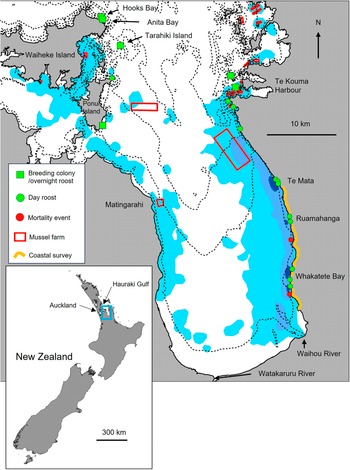
Kawau tikitiki historically bred widely across the Auckland region but experienced major population declines in the early 20th century due to unrestricted shooting of birds (Buddle Reference Buddle1951; Falla Reference Falla1932; Turbott Reference Turbott1956). Although shooting was banned in the 1930s and numbers rebounded to at least 2,000 breeding pairs in the Firth of Thames area of the Hauraki Gulf by the 1960s, the ensuing decades have seen a steep decline (Rawlence et al. Reference Rawlence, Rayner, Lovegrove, Stoddart, Vermeulen and Easton2019). The breeding population is now confined to one nesting stronghold on Tarahiki Island in the Firth of Thames and two small sub-colonies (Anita Bay and Hooks Bay) nearby on Waiheke Island (Rawlence et al. Reference Rawlence, Rayner, Lovegrove, Stoddart, Vermeulen and Easton2019) (Figure 1). Recent genetic analyses have confirmed this small northern population as a genetically distinct conservation management unit, separate from populations in the southern North Island and South Island (Rawlence et al. Reference Rawlence, Rayner, Lovegrove, Stoddart, Vermeulen and Easton2019). Due to its restricted range and small size this population was listed as endangered under regional conservation threat assessments (Woolly et al. Reference Woolly, Lovegrove, Robertson, Dell’Ariccia and Melzer2024). A monitoring programme to assess the status of the breeding population began in 2015.
Foraging distribution of GPS-tracked kawau tikitiki within the Firth of Thames, Hauraki Gulf from utilisation distributions (UD) showing overall foraging range (light blue shaded area; 95% UD), high-use foraging areas (blue shaded area; 50% UD) and core foraging areas (10% UD, dark blue shaded area). Also shown are breeding colony and/or overnight roost sites, daytime roost sites, and mortality event locations for two tracked birds. Mussel farm locations are outlined in red, and the route of the recreational set-net coastal survey is shown in yellow. Bathymetric contours (black lines) are shown at 5 m depth intervals. The location of the Firth of Thames relative to Aotearoa New Zealand is shown in the inset.
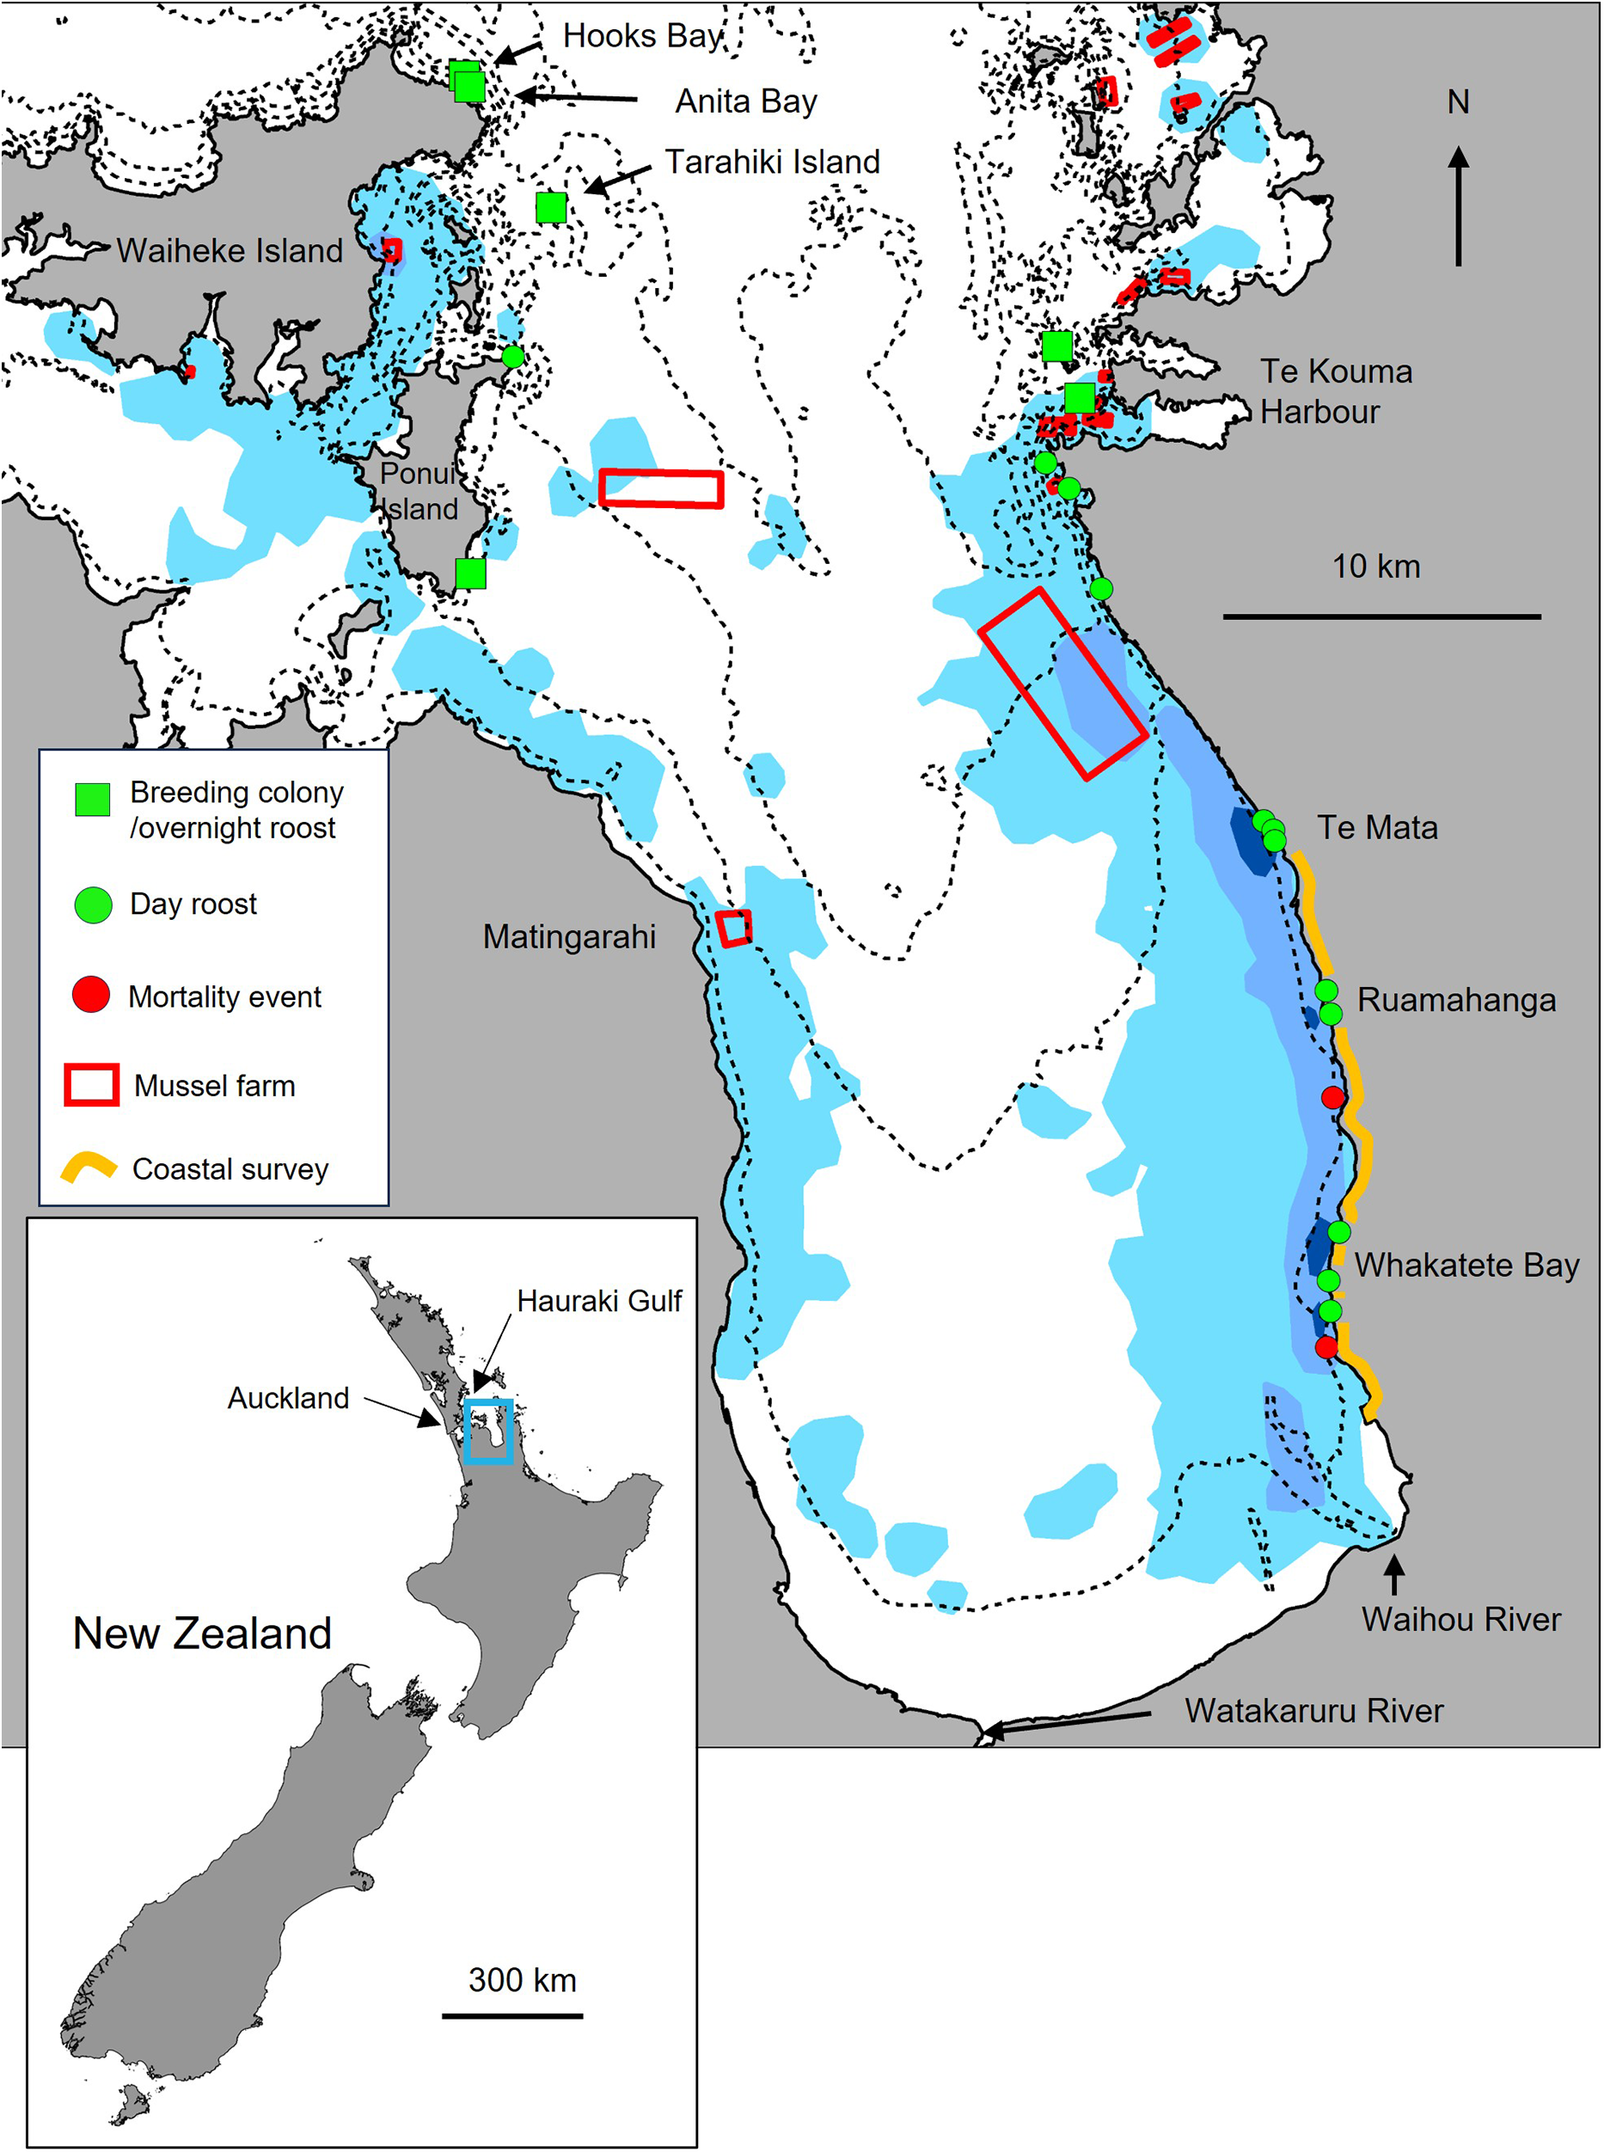
Figure 1. Long description
A multi-panel map set.
Bottom-left inset: A map of New Zealand with a 300 km scale bar. A blue box highlights the Hauraki Gulf near Auckland on the North Island.
Main map: A detailed view of the Hauraki Gulf with a 10 km scale bar and North arrow.
Geographical features from North to South:
* Northwest: Waiheke Island and Ponui Island. Hooks Bay and Anita Bay are marked with green squares.
* North: Tarahiki Island marked with a green square.
* Northeast: Te Kouma Harbour area with several red mortality event dots and green roosting markers.
* East Coast: A yellow line indicates a coastal survey from Te Mata, through Ruamahanga, to Whakatete Bay. This stretch contains green day roost circles and red mortality event dots.
* South: The Waihou River and Watakaruru River enter the gulf at the southern base.
* West: Matingarahi is labeled on the western coastline.
Data layers:
* Light blue shaded areas represent foraging or habitat zones across the gulf.
* Red rectangles indicate mussel farms, with two large ones in the central gulf and several smaller ones in the Northeast.
* Green squares: Breeding colony or overnight roosts.
* Green circles: Day roosts.
* Red circles: Mortality events.
* Yellow curved line: Coastal survey area.
* Dashed lines: Bathymetric contours within the gulf.
The Firth of Thames, encompassing Tarahiki and forming the southern boundary of the Hauraki Gulf Marine Park, is a shallow, highly productive embayment influenced by freshwater inputs from the Waihou and Piako Rivers and tidal exchange with the Hauraki Gulf. Extensive intertidal mudflats, seagrass beds, and reefs support diverse invertebrate and fish communities (Thompson et al. Reference Thompson, Lundquist, Nelson, Nodder, Francis and Hupman2019). This region also hosts a concentration of marine farms, particularly of green-lipped mussel Perna canaliculus; hereafter mussel farms, which contribute to the regional economy (Auckland Council 2008). These farms provide shelter and food for a range of invertebrate and fish species (Theuerkauf et al. Reference Theuerkauf, Barrett, Alleway, Costa-Pierce, St. Gelais and Jones2022; Underwood and Jeffs Reference Underwood and Jeffs2023; Underwood et al. Reference Underwood, van der Reis and Jeffs2023), that potentially benefit kawau tikitiki, which we have observed foraging there (Authors’ pers. obs.). At the same time, the wider area is subject to human pressures from shallow water commercial and recreational set-net fishing for species such as grey mullet Mugil cephalus, flounder Rhombosolea spp. and small sharks Galeorhinuss spp., Mustelus spp. creating the potential for seasonal overlap with kawau tikitiki foraging habitats. As kawau tikitiki typically forage within 16 km of the shore and feed within bays, inlets and estuaries (Marchant and Higgins Reference Marchant and Higgins1990), this places them at risk of bycatch which is typically lethal and may be contributing to the observed population declines. Accordingly, understanding the spatial ecology of kawau tikitiki, and how their foraging movements intersect with these human activities, is essential for informing effective conservation management.
In this study, we report on the results of ten years of monitoring the kawau tikitiki breeding population and use long-term biologging devices equipped with GPS and dive logging to investigate the foraging ecology and at-sea threats facing the species in the Hauraki Gulf. Specifically, we aimed to:
-
1. Describe temporal trends in breeding population size
-
2. Describe seasonal variation in foraging distribution
-
3. Quantify diving behaviour and the use of mussel farms as foraging habitat, and
-
4. Assess spatial and temporal overlap between nearshore foraging by kawau tikitiki and commercial and recreational set-net fisheries along the Thames Coast during spring and early summer, using commercial fishing records, field surveys of recreational set-net distribution, and GPS tracking data.
By integrating tracking and survey data with fisheries information, we provide the first detailed assessment of at-sea risk for northern kawau tikitiki and propose evidence-based measures for their protection.
Methods
Study Area
Tarahiki Island (36.790°S, 175.227°E) is situated 3 kms east of Waiheke Island and approximately 40 km from Auckland City. The 6 ha island rises to 68 m asl, and comprises of sheer, eroding rock faces of Jurassic-age marine sandstones and mudstones (argillites) (Grant-Mackie Reference Grant-Mackie1959). The island’s summit vegetation is dominated by salt tolerant natives such as pohutukawa Metrosideros excelsa, karo Pittosporum crassifolium, and houpara Pseudopanax lessonii. Coastal and cliff vegetation is mostly limited to prostrate salt and guano-tolerant species (Cameron et al. Reference Cameron, de Lange, McCallum, Taylor and Bellingham2007).
Tarahiki Island and adjacent waters now lie within the Pakatoa and Tarahiki/Shag Island High Protection Area (HPA), established under the Hauraki Gulf / Tīkapa Moana Marine Protection Act 2025 (New Zealand Government 2025). The HPA encompasses waters surrounding Tarahiki and Pakatoa Islands and prohibits most commercial and recreational fishing and other extractive activities. The HPA was established after the GPS tracking undertaken in this study (2023–2024).
On Tarahiki, kawau tikitiki nest colonially on narrow cliff ledges, rocky slopes, and stacks, primarily along the northern and eastern coastline of the island. Birds begin attending colonies in mid to late winter, with courtship displays and nest building beginning in July and egg laying in August (Turbott Reference Turbott1956, MJR pers obs). Elsewhere in the species’ range, secondary laying peaks have been reported in December and March (Marchant and Higgins Reference Marchant and Higgins1990). In Auckland, historical observations (Turbott Reference Turbott1956), noted a smaller autumn breeding pulse in March–April. Recent observations from January–March at the Tarahiki colony confirmed only small numbers of breeding birds (<5 nests), indicating that nesting in this population is now primarily confined to a single, winter-spring cycle.
The nesting cycle for kawau tikitiki follows a typical cormorant pattern: clutches of 2–4 eggs are laid at two-day intervals in August, with both sexes sharing incubation duties. Eggs are incubated for 28–32 days, with hatching occurring asynchronously in September. Chicks are brooded and guarded by parents for up to three weeks and then fed by both parents till approximately nine weeks of age. Fledglings gather in groups below colonies in October and November before dispersing into nearby waters (Marchant and Higgins Reference Marchant and Higgins1990).
Population monitoring
We surveyed the three kawau tikitiki breeding colonies at Tarahiki Island, Anita Bay, and Hooks Bay (Figure 1) annually between 2015 and 2025. We conducted surveys during the last week of August, coinciding with the late incubation phase. We made the counts from a boat, using binoculars, to identify active nests with birds incubating eggs or brooding small chicks. At Tarahiki, where sub colonies occur, we divided the colony into sections that were counted sequentially. We counted at close range within 10 m of the cliffs. Since access required calm conditions for safe boat work, surveys were only conducted in fine weather. Three experienced observers consistently made counts across the study period.
GPS tracking
Adult kawau tikitiki identified by plumage (Turbott Reference Turbott1956) were captured in January 2023 at a mussel farm east of Waiheke Island, where they were known to roost (n = 4). Later, in September 2023, we caught birds in breeding plumage as they departed their nests at the colony on Tarahiki Island during the incubation period (n = 10). Captures were conducted using an air-propelled net gun, an ARTS Whale Tagger, custom-fitted to launch 4 PVC tubes attached to the corners of a 4 × 4 m mist net (Rayner et al. Reference Rayner, Gaskin, Fitzgerald, Baird, Berg and Boyle2015; Reference Rayner, Baird, Bird, Cranwell, Raine and Maul2020). Captured birds were weighed using a hand-held Pesola spring balance and up to three breast feathers were removed for genetic-based sex determination (Fridolfsson and Ellegren Reference Fridolfsson and Ellegren1999).
Each captured bird was fitted with a solar-powered Global Positioning System (GPS) logger (Ornitela, Vilnius, Lithuania) equipped with an integrated pressure sensor. Loggers were attached using a custom-designed Teflon ribbon backpack harness, based on methods described by Orben et al. (Reference Orben, Peck-Richardson, Piggott, Lerczak, Wilson and Garwood2025) and King and Tobin (Reference King and Tobin2000). We modified this design by incorporating a weak link into the harness. The weak link consisted of a metal washer supporting the chest and body loops of the harness, which was ground to less than 1 mm thickness at two points. These thinned sections were designed to corrode gradually in seawater, allowing the harness and logger to detach over time and thereby minimising any long-term effects on the bird. The combined mass of the logger and harness was 25 g, representing approximately 1.8% of the mean body mass of tagged birds.
Tag programming was optimised to trigger a GPS fix each time the bird resurfaced from a dive, defined as crossing a 1 m depth threshold. Dive data was recorded at 1Hz. This allowed for high-resolution tracking of foraging behaviour. Data were transmitted over 4G cellular phone networks whenever the tag’s solar charge allowed, enabling the transfer of large datasets remotely. Tag programming was dynamic and dive data were only collected when battery levels exceeded 50%. GPS fixes not associated with diving were also recorded at intervals ranging from 10 minutes to multiple hours depending on battery levels to document flight paths and roosting locations.
GPS and fisheries data processing
Raw tag data were processed to identify individual dive events. Dive events were identified from the data stream by dive start and end flags defined by the depth threshold and numbered sequentially for each bird. For each dive, we recorded the start and end time, duration (s), maximum, minimum, and mean depth (m), and GPS position following the dive. Overly long and biologically unrealistic dives (>120 seconds) were excluded from the dataset.
Commercial set-net fisheries data in New Zealand are collected under statutory requirements of The Fisheries Act 1996 by the Ministry of Primary Industries (MPI) and was made available for this project based on a data sharing agreement between the New Zealand Department of Conservation (DOC) and MPI. The time range of the fisheries data was 8 January 2020 until 24 March 2024 and contains 9,169 set-net fishing events with information of event ID, start date and time, and coordinates of the starting and ending locations of the fishing event. We also acquired the spatial polygons of the marine farms in the Firth of Thames from the Waikato Regional Council.
Recreational set net survey
GPS tracking revealed that kawau tikitiki concentrate foraging effort close to the Thames Coast during November and December, when fledglings are dispersing from breeding colonies and adult energetic demands remain high as they regain body condition following breeding. This period represents a critical window of vulnerability to inshore fisheries, particularly recreational set nets, for which no monitoring data exist. To address this gap, we conducted coastal surveys for the presence of recreational set nets on successive weekends during November and December 2025. This enabled comparison with GPS-derived foraging ranges collected in the same months of 2023 and 2024, which we assumed would be similar in 2025.
Surveys were conducted along an 18 km section of Thames Coast Road between Thames and Te Mata. This route provides an almost continuous view of the inshore core foraging habitat used by kawau tikitiki. Because observer availability was limited, surveys were scheduled as close as possible to high tide, when local fishers indicated set nets were most deployed across a broad range of tidal conditions and when foraging birds were concentrated in nearshore waters. Observers recorded the presence and location of nets, either being deployed or set, during both northbound and southbound passes of the route to maximise detection probability. At four known kawau tikitiki roosting sites (Whakatete Bay, Ruamahunga, Te Mata, and adjacent shoreline rocks), observers stopped to count the number of roosting birds and to scan adjacent waters for nets.
For each net sighting, observers recorded: (i) time of observation, (ii) observer GPS coordinates (using hand-held GPS or location-enabled mobile phone), (iii) estimated distance offshore (m) and compass bearing to the net, (iv) description of location, (v) net characteristics (e.g. marker buoys, visible length, orientation) and (vi) details of conversations with fishers if obtained. Observations were made with binoculars and net distance and bearing from observer were used to gain approximate GPS coordinates for the set net.
Statistical analysis
Population
Counts of nesting spotted shags at three colonies were analysed using generalised linear models with a negative binomial error distribution to account for overdispersion in count data. Models were fitted with year (continuous) and colony (categorical) as explanatory variables, using a log-link function. Competing models with and without a year × colony interaction were compared using Akaike’s Information Criterion (AIC) to assess whether temporal trends differed among colonies.
Seasonal changes in foraging distribution
To understand the space-use patterns of kawau tikitiki, we used GPS dive locations to construct overall and monthly kernel utilisation distributions (UD) between January 2023 and June 2024 using kernelUD function from the package adehabitatHR with a cell size of 100 m and a search radius of 1,500 m (Calenge Reference Calenge2006). The contours and areas of the 95%, 50%, and 10% utilisation distributions were also created to mark the home range, core foraging, and highest-used areas, respectively. Owing to the small number of birds tracked between January and May 2023 (n = 4), data for these months were pooled across 2023 and 2024.
Diving behaviour
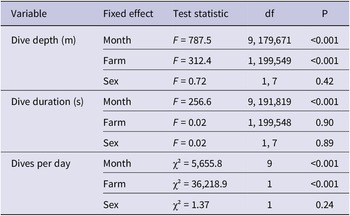
Daily diving behaviour was summarised using the mean and standard error of dive depth, dive duration, and the number of dives per day, stratified by individual bird, sex, and the presence or absence of marine farms. Days for which dive records were truncated due to low device battery levels were excluded from analyses. Because of logistical constraints, sample sizes were unbalanced across sexes and tracking periods. To assess the effects of month, sex, and marine farm use on diving behaviour, linear mixed-effects models (LMMs; lme4::lmer) were fitted for mean daily dive depth and mean daily dive duration, and a generalised linear mixed-effects model (GLMM; Poisson error distribution; lme4::glmer) was fitted for the number of dives per day. Each model included month (categorical factor), marine farm presence (defined where GPS dive locations were within the boundaries of marine farm polygons), and sex as fixed effects, with individual bird (Device) included as a random intercept to account for repeated observations within individuals. The significance of fixed effects was assessed using Type III ANOVA tests, with Satterthwaite’s approximation for the LMMs and Wald χ² tests for the GLMM (Table 3).
Fisheries interactions
For analyses of overlap with tracked kawau tikitiki, we first restricted the commercial fisheries dataset to set-net events occurring during the bird tracking period. Records were screened for spatial errors, and any events with start or end coordinates located on land were removed. Because only the start time of each fishing event was available, a nominal event duration of 2 hours was assigned from the recorded start time based on information provided by local fishers.
To ensure temporal comparability with bird behaviour, we further restricted the dataset to hours during which diving activity was observed. Kawau tikitiki showed no dive activity between 23:00 and 03:00, and fishing events occurring during this period were therefore excluded from all subsequent analyses. This filtered dataset was used for all spatial and temporal overlap analyses, including kernel density estimation of fishing effort.
Direct spatio-temporal interactions with commercial fisheries were identified using a two-step approach. First, we quantified the proportion of fishing events occurring within the 95%, 50%, and 10% utilisation distribution contours of kawau tikitiki for both the overall tracking period and for each month. Second, we examined fine-scale interactions between dives and set nets in space and time using a simplified version of the time-geographic framework described by Rutter et al. (Reference Rutter, Borrelle, Bose, Carneiro, Clark and Debski2024). Specifically, a potential interaction was defined as any dive occurring within 300 m of an active set net, with a ±1 h temporal buffer applied to fishing event start and end times. Interactions were grouped into 50 m distance intervals and summarised by individual bird, fishing event, date, and hour.
All analyses were performed in R (v4.4.3; R Core Team 2025). Packages used included: MASS (Venables and Ripley Reference Venables and Ripley2002), readr, janitor, dplyr, lubridate, sf, adehabitatHR (Calenge Reference Calenge2006), and lme4 (Bates et al. Reference Bates, Mächler, Bolker and Walker2015).
Results
Population
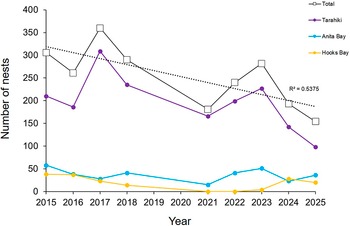
Modelling estimated an overall decline in kawau tikitiki nest counts of approximately 7% per year from 2015–2025 (Figure 2). A model including only additive effects of year and colony was better supported than a model including a year × colony interaction (AIC = 265.17 vs 268.74), indicating no evidence that temporal trends differed among colonies. Although interannual variability was high and the estimated decline was not statistically significant (Year effect: P = 0.16), the magnitude and direction of the trend are consistent with a reduction in the numbers of birds nesting over the decade examined.
Counts of active kawau tikitiki nests at three breeding colonies between 2015 and 2025. Dashed line shows linear fit for total nest count across three colonies.
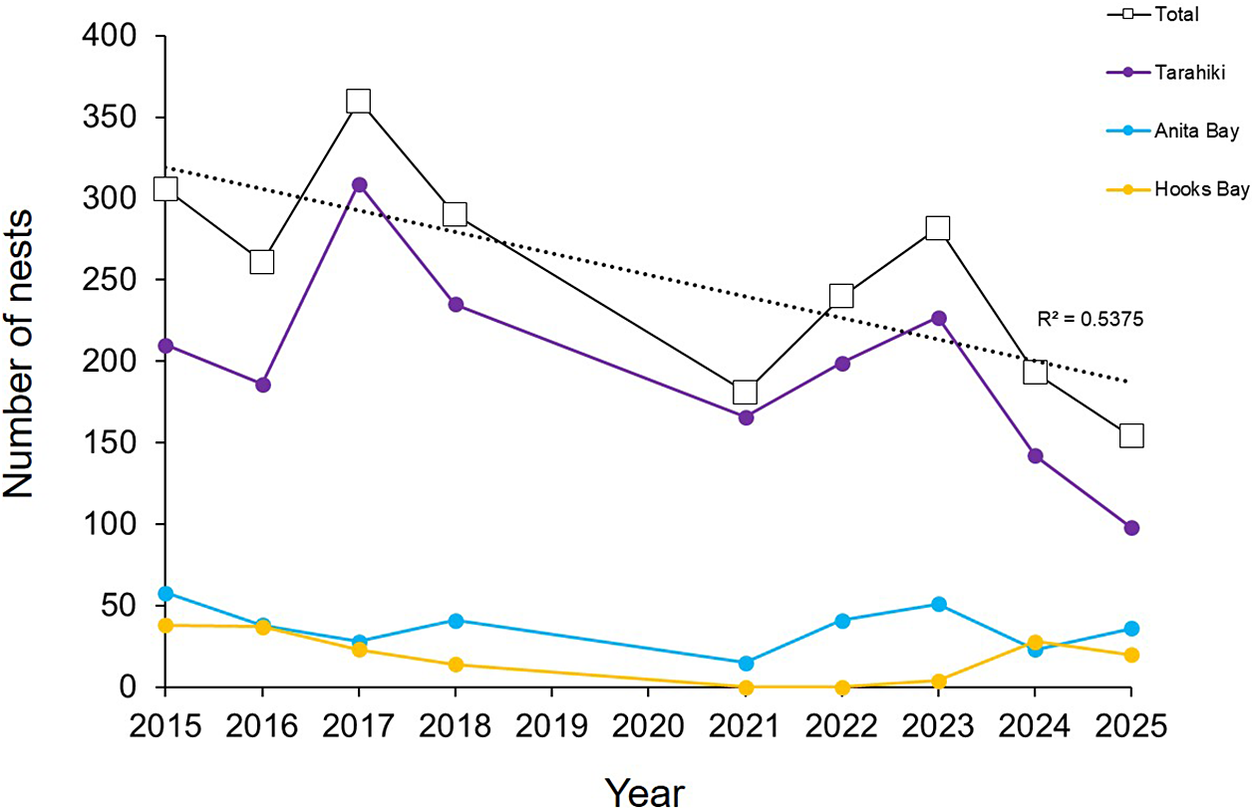
Figure 2. Long description
The X-axis represents Year from 2015 to 2025. The Y-axis represents Number of nests from 0 to 400 in increments of 50. Four data series are plotted.
* Total (black line with white square markers): Starts at approximately 305 in 2015, peaks at 360 in 2017, and shows a general downward trend to 155 in 2025. A dotted linear trendline is overlaid with an R-squared value of 0.5375.
* Tarahiki (purple line with solid circle markers): Follows the total trend closely, starting at 210 in 2015, peaking at 310 in 2017, and declining to 98 in 2025.
* Anita Bay (light blue line with solid circle markers): Starts at 58 in 2015, fluctuates between 15 and 50, and ends at 36 in 2025.
* Hooks Bay (yellow line with solid circle markers): Starts at 38 in 2015, declines to 0 between 2021 and 2022, and ends at 20 in 2025.
All series show a significant dip in 2021 before a brief recovery in 2023 and a subsequent decline.
Bird captures and data processing
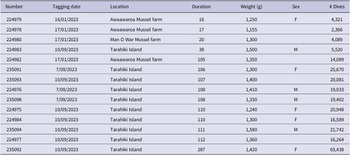
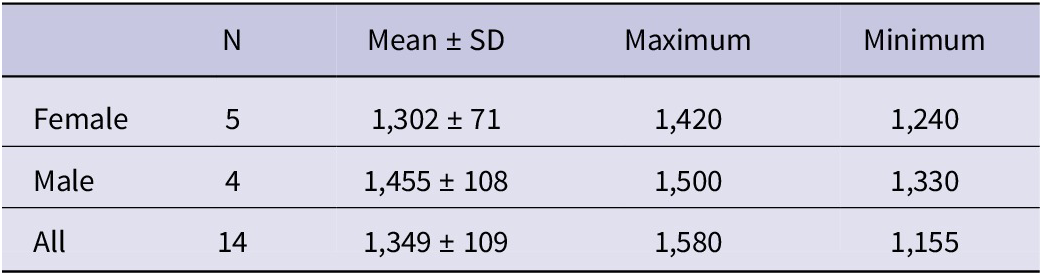
We captured and tagged 4 kawau tikitiki in January 2023 at a mussel farm east of Waiheke Island, and 10 birds in September 2023 at the Tarahiki breeding colony. Tracking duration of the birds was 97 ± 67 days (range 16–287 days) (Table 1). From the data transmitted by the tags we identified a total of 256,452 dives over the tracking period and 18,317 ± 15,545 (range 2,366–65,438) dives per individual (Table 1). Genetic sequencing revealed the sex of 9 of the tracked birds (5 female, 4 male). Females (1,302 ± 71, range 1,240–1,420 grams) were consistently lighter than males (1,455 ± 108, range 1,330-1,500 grams) (Table 2).
Tagging details including tagging deployment date, location, duration, and weight, sex and number of dives captured by tagged birds
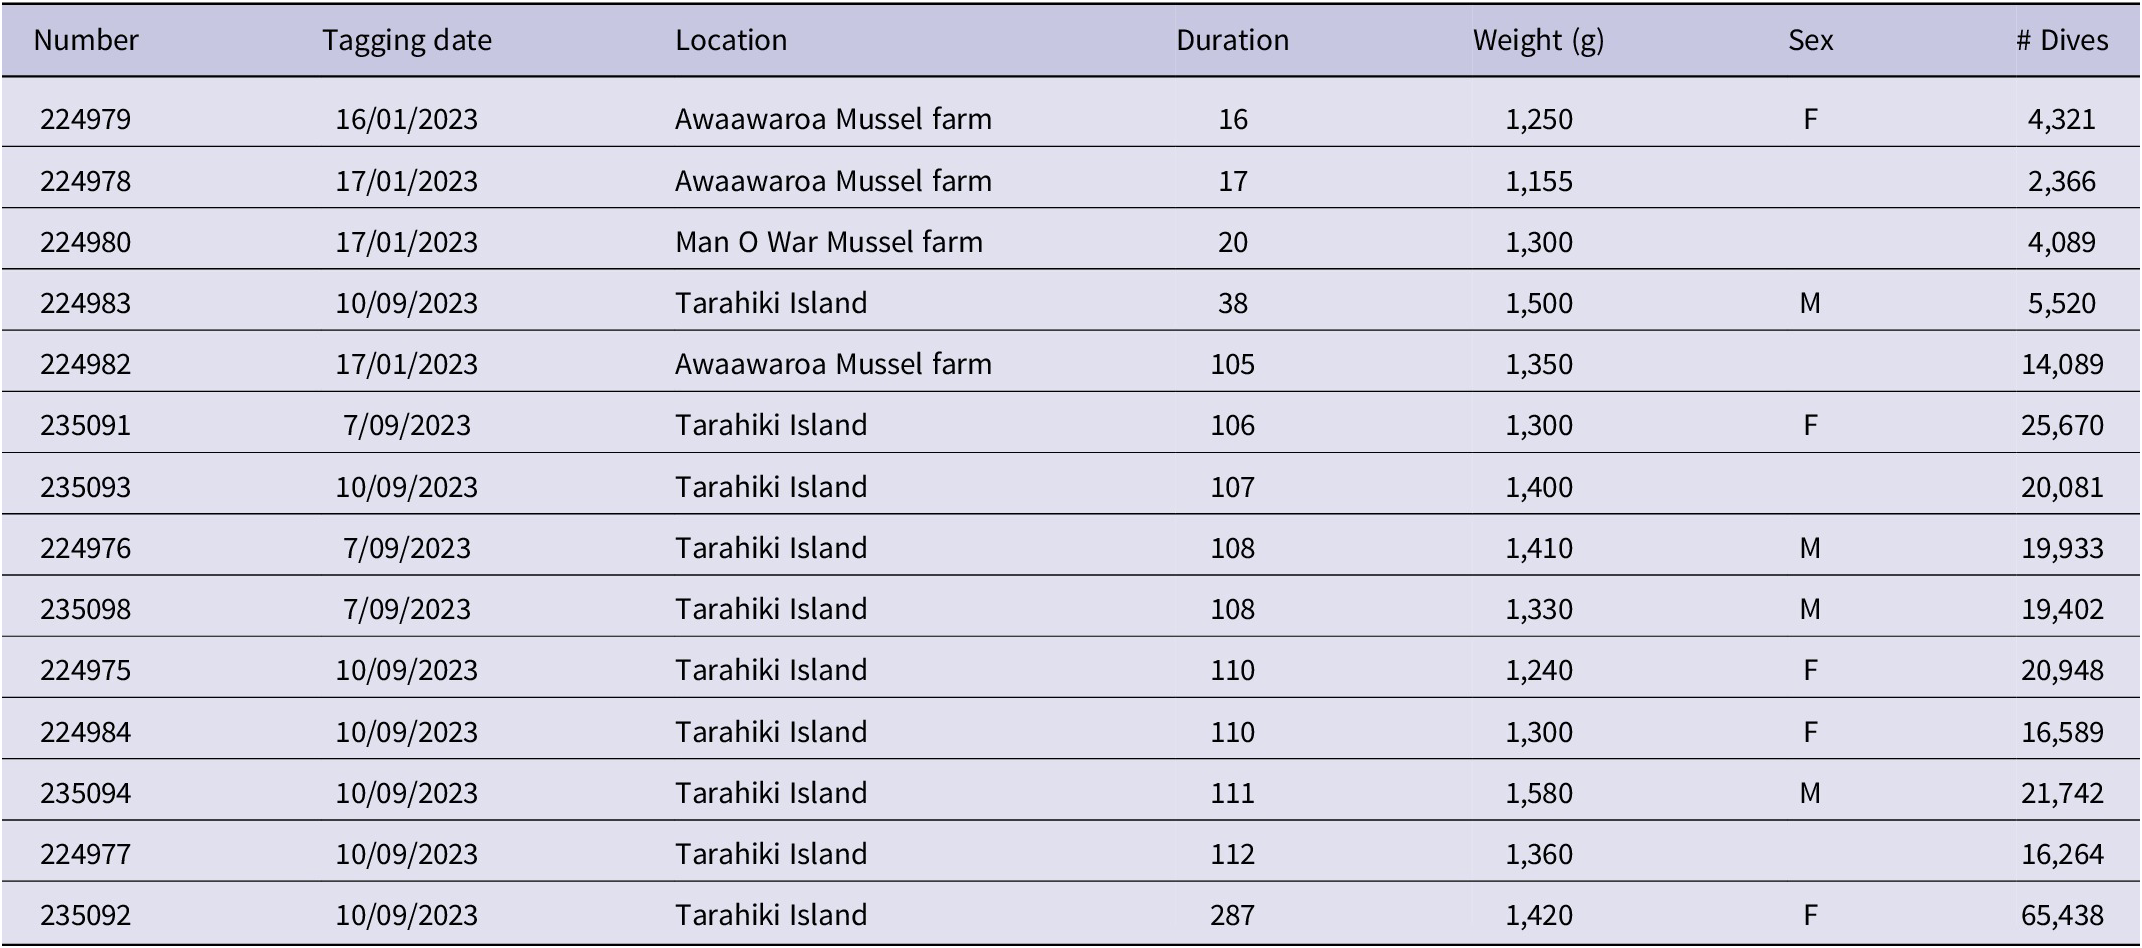
Table 1. Long description
The table contains 14 rows of data with the following columns: Number, Tagging date, Location, Duration, Weight in grams, Sex, and number of Dives.
* Bird 224979: Tagged 16/01/2023 at Awaawaroa Mussel farm, duration 16, weight 1,250, sex F, 4,321 dives.
* Bird 224978: Tagged 17/01/2023 at Awaawaroa Mussel farm, duration 17, weight 1,155, 2,366 dives.
* Bird 224980: Tagged 17/01/2023 at Man O War Mussel farm, duration 20, weight 1,300, 4,089 dives.
* Bird 224983: Tagged 10/09/2023 at Tarahiki Island, duration 38, weight 1,500, sex M, 5,520 dives.
* Bird 224982: Tagged 17/01/2023 at Awaawaroa Mussel farm, duration 105, weight 1,350, 14,089 dives.
* Bird 235091: Tagged 7/09/2023 at Tarahiki Island, duration 106, weight 1,300, sex F, 25,670 dives.
* Bird 235093: Tagged 10/09/2023 at Tarahiki Island, duration 107, weight 1,400, 20,081 dives.
* Bird 224976: Tagged 7/09/2023 at Tarahiki Island, duration 108, weight 1,410, sex M, 19,933 dives.
* Bird 235098: Tagged 7/09/2023 at Tarahiki Island, duration 108, weight 1,330, sex M, 19,402 dives.
* Bird 224975: Tagged 10/09/2023 at Tarahiki Island, duration 110, weight 1,240, sex F, 20,948 dives.
* Bird 224984: Tagged 10/09/2023 at Tarahiki Island, duration 110, weight 1,300, sex F, 16,589 dives.
* Bird 235094: Tagged 10/09/2023 at Tarahiki Island, duration 111, weight 1,580, sex M, 21,742 dives.
* Bird 224977: Tagged 10/09/2023 at Tarahiki Island, duration 112, weight 1,360, 16,264 dives.
* Bird 235092: Tagged 10/09/2023 at Tarahiki Island, duration 287, weight 1,420, sex F, 65,438 dives.
Sex, sample size and mean, minimum and maximum weights (grams) of 14 tracked spotted shags
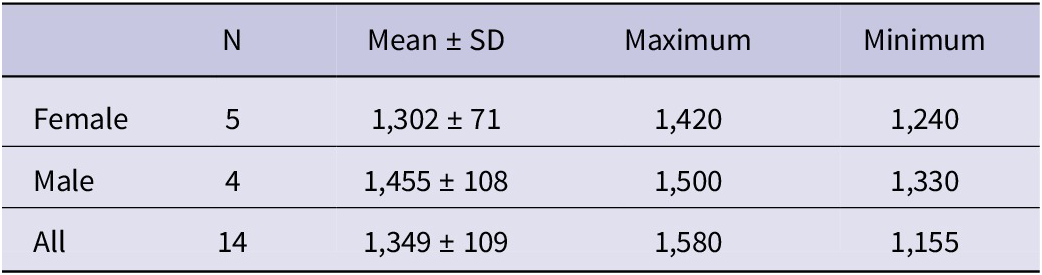
Table 2. Long description
The table consists of five columns: Sex, N (sample size), Mean plus or minus S D (Standard Deviation), Maximum, and Minimum.
* Female row: N is 5. Mean plus or minus S D is 1,302 plus or minus 71. Maximum is 1,420. Minimum is 1,240.
* Male row: N is 4. Mean plus or minus S D is 1,455 plus or minus 108. Maximum is 1,500. Minimum is 1,330.
* All row: N is 14. Mean plus or minus S D is 1,349 plus or minus 109. Maximum is 1,580. Minimum is 1,155.
Foraging distribution
Tracked kawau tikitiki foraged exclusively within the Firth of Thames region including waters south and east of Waiheke Island and north of Te Kouma Harbour (Figure 1). Birds typically moved among a small number of island overnight roost sites, comprising the three breeding colonies at Anita Bay, Hooks Bay, and Tarahiki Island, the southern tip of Ponui Island and islands east of Te Kouma Harbour. Daily maximum ranges were <50 km. Within this distribution, birds roosted during the day at sites along the eastern Firth of Thames coastline and on mussel farms particularly north-east of Te Mata and on the eastern and southern coasts of Waiheke Island (Figure 1).
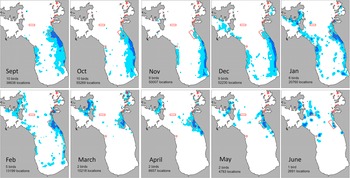
Overall, tracked birds used an area of 417.3 km² (95% UD), with a core foraging area (50% UD) of 47.6 km² and high-use areas (10% UD) of 4.2 km² concentrated along the eastern coastline of the Firth of Thames between Te Mata and Whakatete Bay (Figure 1). There was a seasonal shift in foraging distribution. Between September and December birds predominantly occupied the eastern Firth of Thames coastline, foraging intensively within the large mussel farm north-east of Te Mata in September before progressively shifting their foraging range southward as spring advanced (Figure 3). In November and December, foraging activity was concentrated on the southern Firth of Thames coastline as far south as the mouth of the Waihou River with day roosts at Te Mata, Ruamahunga and Whakatete Bay heavily used during this period (Figures 1 and 3). From January onwards, tracked birds moved north to forage within mussel farms north-east of Te Mata and in deep water channels off eastern and southern Waiheke Island (Figures 1 and 3). There was no clear or consistent difference in overall spatial extent, seasonal movement patterns, or core foraging areas between male and female birds.
Monthly distribution of foraging kawau tikitiki from utilisation distributions (UD); overall foraging range (95% UD; unfilled blue lines) and high-use foraging areas (50% UD; light blue filled). Boundaries of mussel farms shown by red polygons, and depth contours (black lines) shown at 5 m intervals. Data are combined for January to May 2023 and 2024. Number of tracked birds and dive locations for each month are shown.
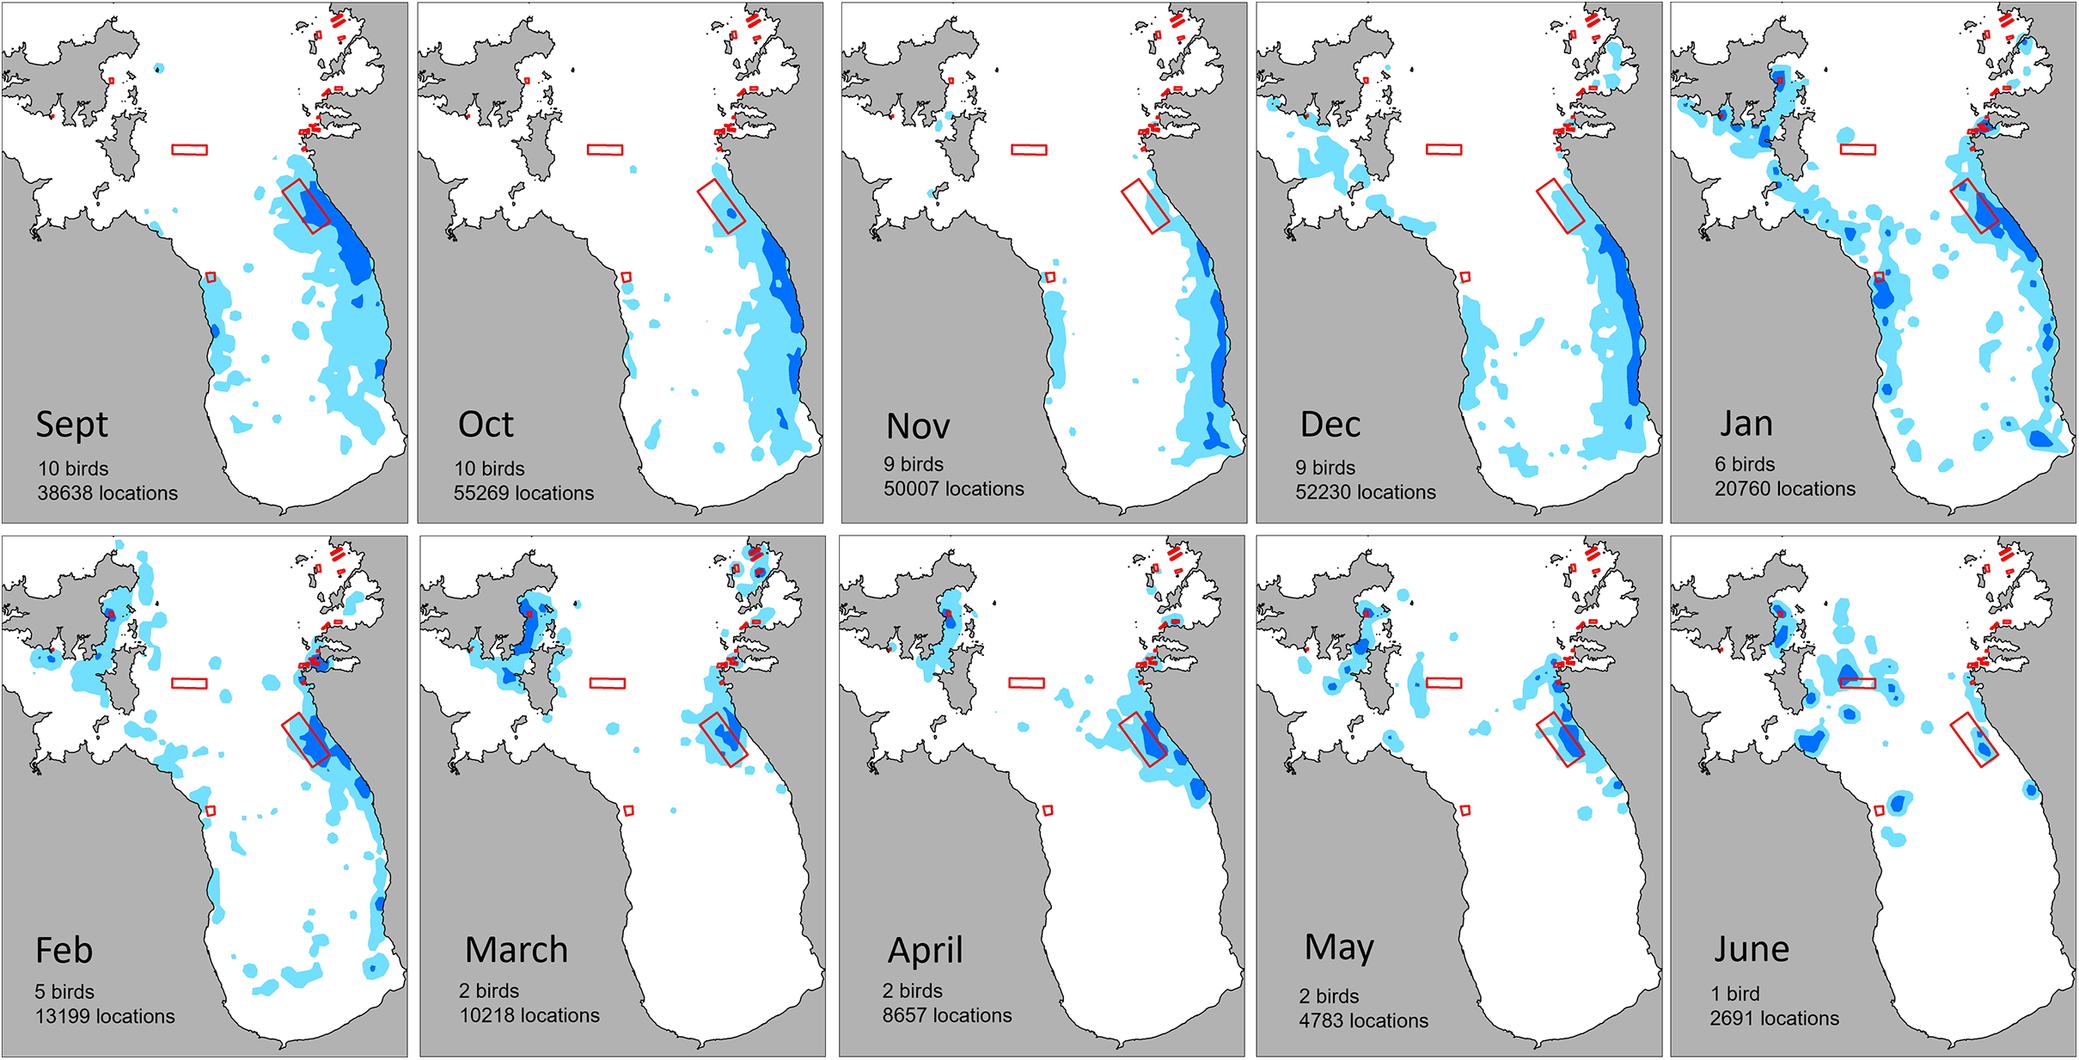
Figure 3. Long description
A series of 10 maps arranged in two rows of five. Each map displays a coastal region with land in grey and water in white. Blue shaded areas represent 50 percent U D (high-use) and blue outlines represent 95 percent U D (overall range). Red polygons indicate mussel farms.
* Top Row (September to January):
- Sept: 10 birds, 38638 locations. High-use areas are concentrated along the eastern coastline.
- Oct: 10 birds, 55269 locations. Foraging range expands slightly further offshore in the east.
- Nov: 9 birds, 50007 locations. High-use areas remain hugging the eastern coast.
- Dec: 9 birds, 52230 locations. Foraging activity begins to spread toward the Northwest and central bay.
- Jan: 6 birds, 20760 locations. Significant expansion of foraging range across the entire bay, including the Northwest and South.
* Bottom Row (February to June):
- Feb: 5 birds, 13199 locations. Activity is scattered across the bay with a core area near the eastern mussel farms.
- March: 2 birds, 10218 locations. High-use areas are concentrated in the Northwest and near the eastern farms.
- April: 2 birds, 8657 locations. Foraging is localized around the eastern farms and Northwest coast.
- May: 2 birds, 4783 locations. Sparse activity concentrated in the central-North and eastern farm areas.
- June: 1 bird, 2691 locations. Highly localized high-use areas in the North and near the eastern farms.
Across all months, the red mussel farm polygons in the East frequently overlap with or are adjacent to the high-use blue shaded areas.
Diving behaviour
The dive depths of tracked kawau tikitiki were typically shallow, averaging 4.12 ± 2.81 m, although birds were capable of deeper dives with a maximum depth of 33.0 m observed. Dive durations averaged 23.4 ± 12.4 s. Individuals performed 150–200 dives per day (mean 187 ± 100, Figure 4). Dive depth, duration and dives per day did not differ significantly between males and females (Table 3). Diving was predominantly diurnal with no dives recorded between 23:00 and 03:00 (Figure 5). Dive frequency increased rapidly after 05:00, peaked between approximately 10:00–15:00, and declined after 18:00. Dive depth varied systematically with time of day. The deepest dives occurred at dawn (05:00–06:00 NZST; mean 3.49 m) and again in late afternoon (17:00–18:00; mean 3.47 m), with dive duration correspondingly longer during these periods (up to 26 s) (Figure 5). Dives were shallowest around midday (11:00–12:00; mean 2.81 m; mean duration 22–23 s), describing a bimodal U-shaped depth profile across the day (Figure 5). Dive frequency peaked in the mid-afternoon (15:00; ~26,000 dives recorded at this hour). There was a positive relationship between dive depth and dive duration across the diurnal cycle (Spearman’s ρ = 0.90, P < 0.001, n = 15, hours with ≥100 dives). Hours with the deepest mean dives also had the longest mean durations (e.g. 05:00: 3.49 m depth, 26.2 s duration; 18:00: 3.46 m, 25.6 s), while the shallowest midday dives were the shortest (11:00: 2.81 m, 22.6 s).
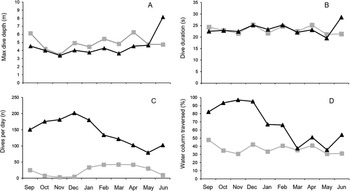
Monthly time series of kawau tikitiki foraging outside mussel farms (filled black triangles) and inside mussel farms (filled grey squares) for (A) maximum dive depth, (B) dive duration, (C) number of dives per day and (D) percentage of the water column used. Data are combined for January to May 2023 and 2024.
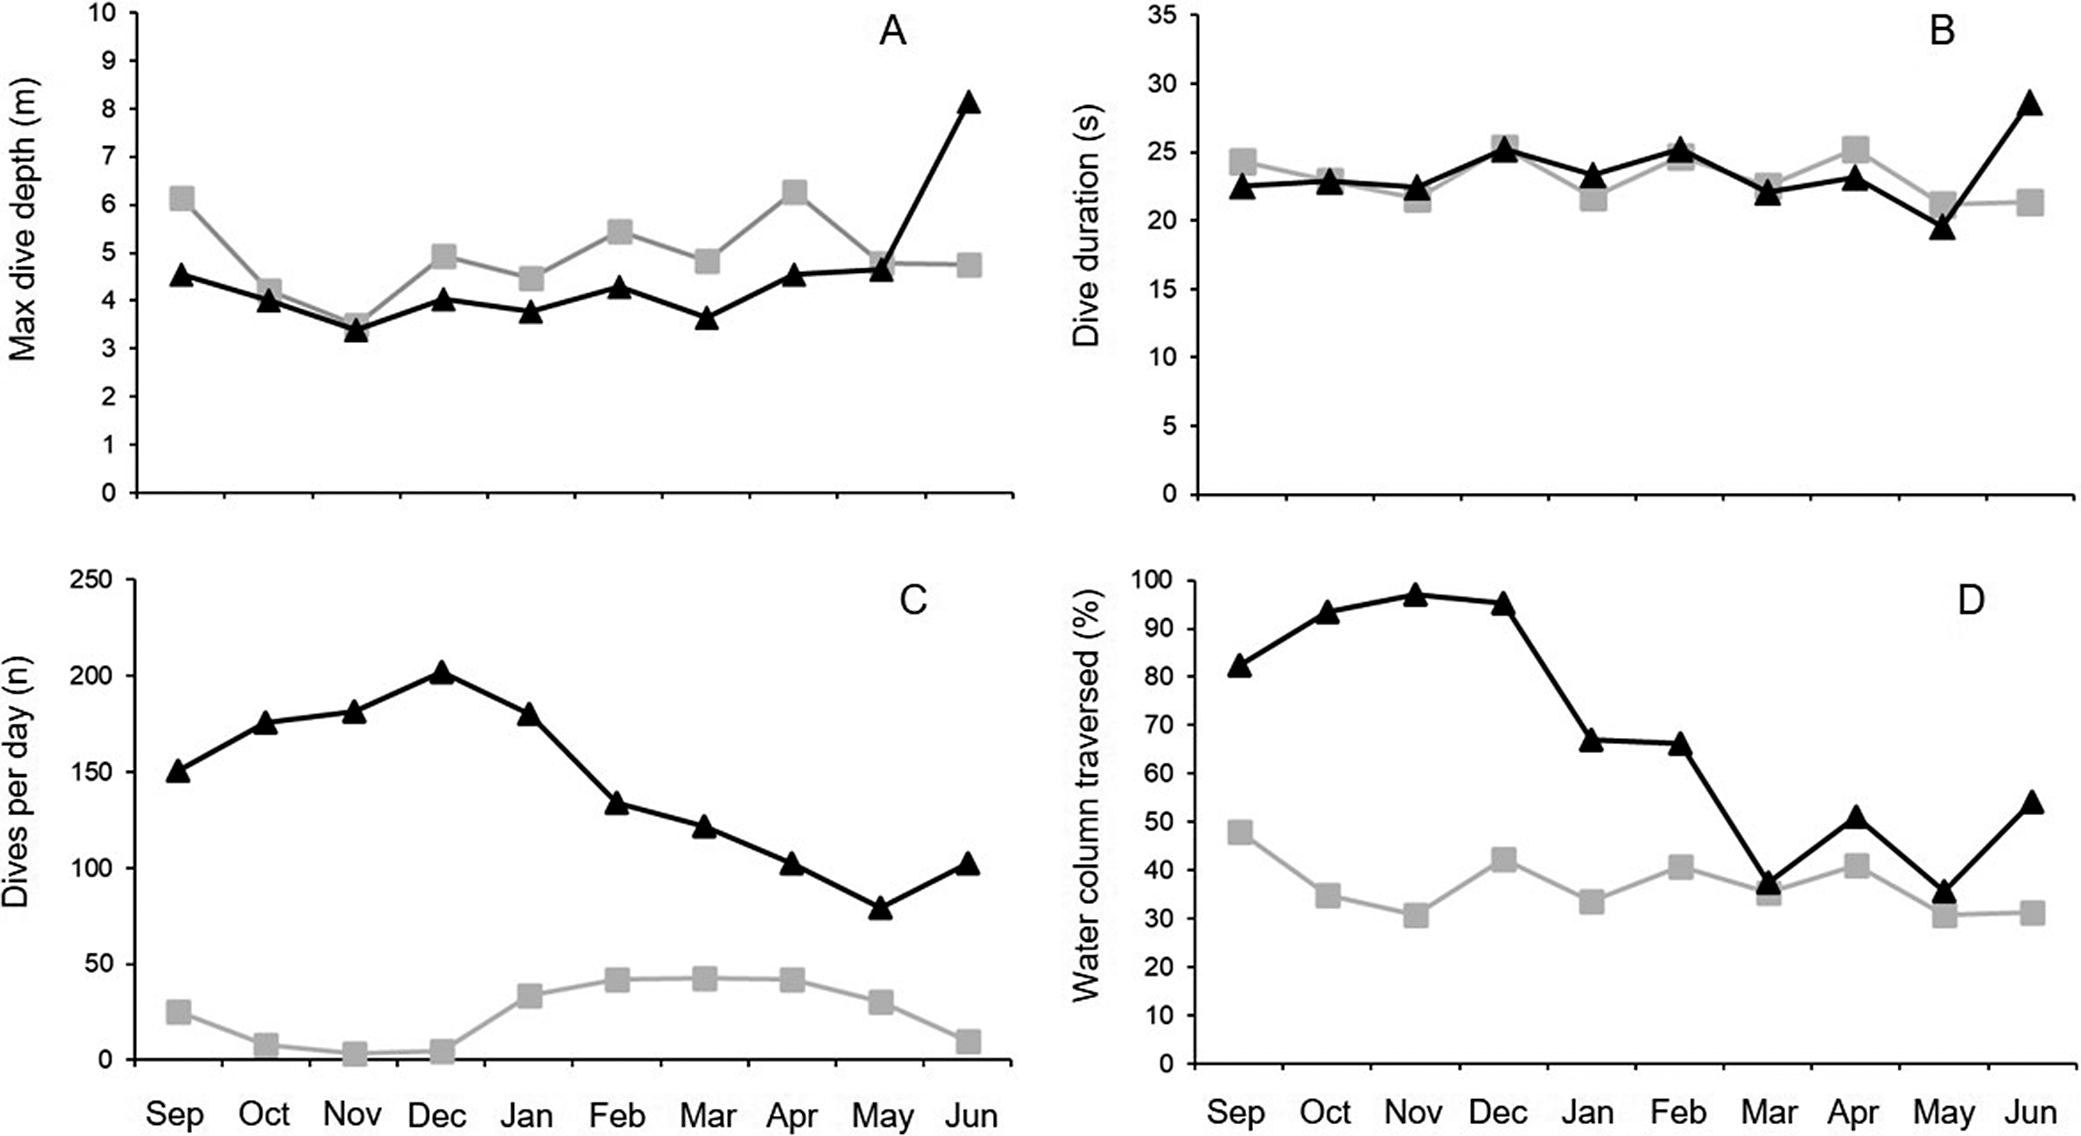
Figure 4. Long description
The figure consists of four panels labeled A through D. All panels share a common X axis representing months from September to June.
Panel A: Max dive depth in meters. The Y axis ranges from 0 to 10. Foraging inside mussel farms (grey squares) fluctuates between 4 and 6 meters. Foraging outside (black triangles) remains lower at 3 to 5 meters until a sharp increase to 8 meters in June.
Panel B: Dive duration in seconds. The Y axis ranges from 0 to 35. Both datasets show similar stable trends, fluctuating between 20 and 25 seconds. Outside foraging shows a peak near 30 seconds in June.
Panel C: Dives per day (n). The Y axis ranges from 0 to 250. Outside foraging (black triangles) is significantly higher, peaking at 200 in December before declining to 100 by June. Inside foraging (grey squares) remains very low, near 0 from September to December, rising slightly to 40 between January and May.
Panel D: Water column traversed in percentage. The Y axis ranges from 0 to 100. Outside foraging (black triangles) starts high at 80 to 95 percent from September to December, then drops and stabilizes between 40 and 60 percent. Inside foraging (grey squares) is consistently lower, fluctuating between 30 and 50 percent throughout the period.
Results of Type III ANOVA analysis from linear mixed-effects models (LMMs) for dive depth and dive duration, and a generalised linear mixed model (GLMM, Poisson family) for dives per day. Fixed effects were month, farm presence (on/off mussel farm), and sex; individual bird (Device) was included as a random intercept. F-tests with Satterthwaite degrees of freedom were used for LMMs; Wald χ² tests were used for the GLMM
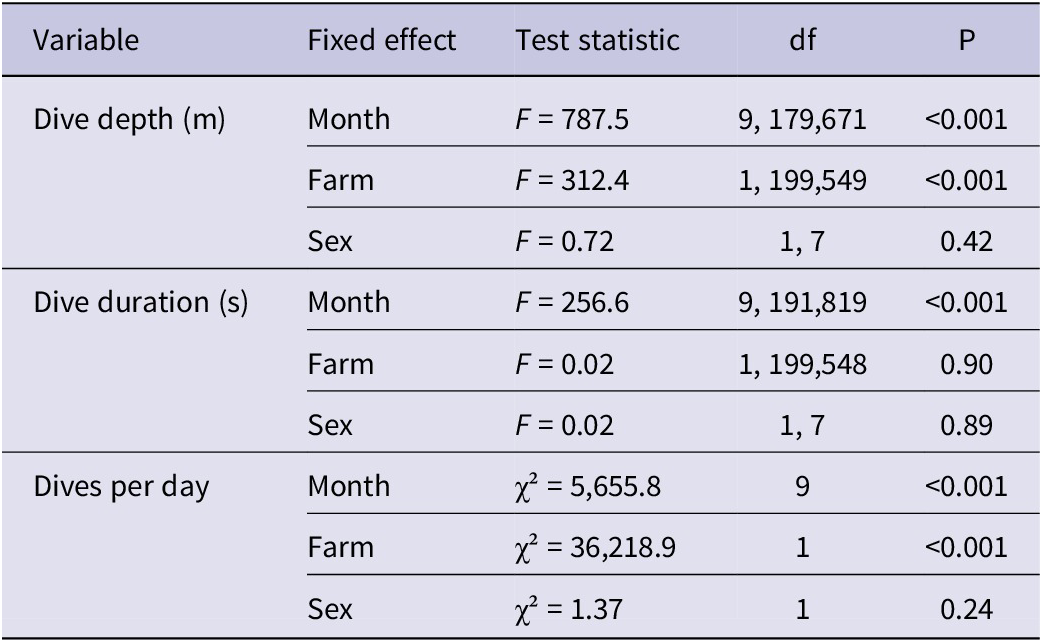
Table 3. Long description
The table consists of five columns: Variable, Fixed effect, Test statistic, d f, and P.
1. Dive depth (m):
* Month: F = 787.5, d f = 9, 179,671, P < 0.001.
* Farm: F = 312.4, d f = 1, 199,549, P < 0.001.
* Sex: F = 0.72, d f = 1, 7, P = 0.42.
2. Dive duration (s):
* Month: F = 256.6, d f = 9, 191,819, P < 0.001.
* Farm: F = 0.02, d f = 1, 199,548, P = 0.90.
* Sex: F = 0.02, d f = 1, 7, P = 0.89.
3. Dives per day:
* Month: chi-squared = 5,655.8, d f = 9, P < 0.001.
* Farm: chi-squared = 36,218.9, d f = 1, P < 0.001.
* Sex: chi-squared = 1.37, d f = 1, P = 0.24.
Daily patterns of kawau tikitiki diving activity by males (red) and females (blue). Bar plot shows the mean number of dives and standard errors for each hour during the day; line plot shows mean dive depth throughout the day.
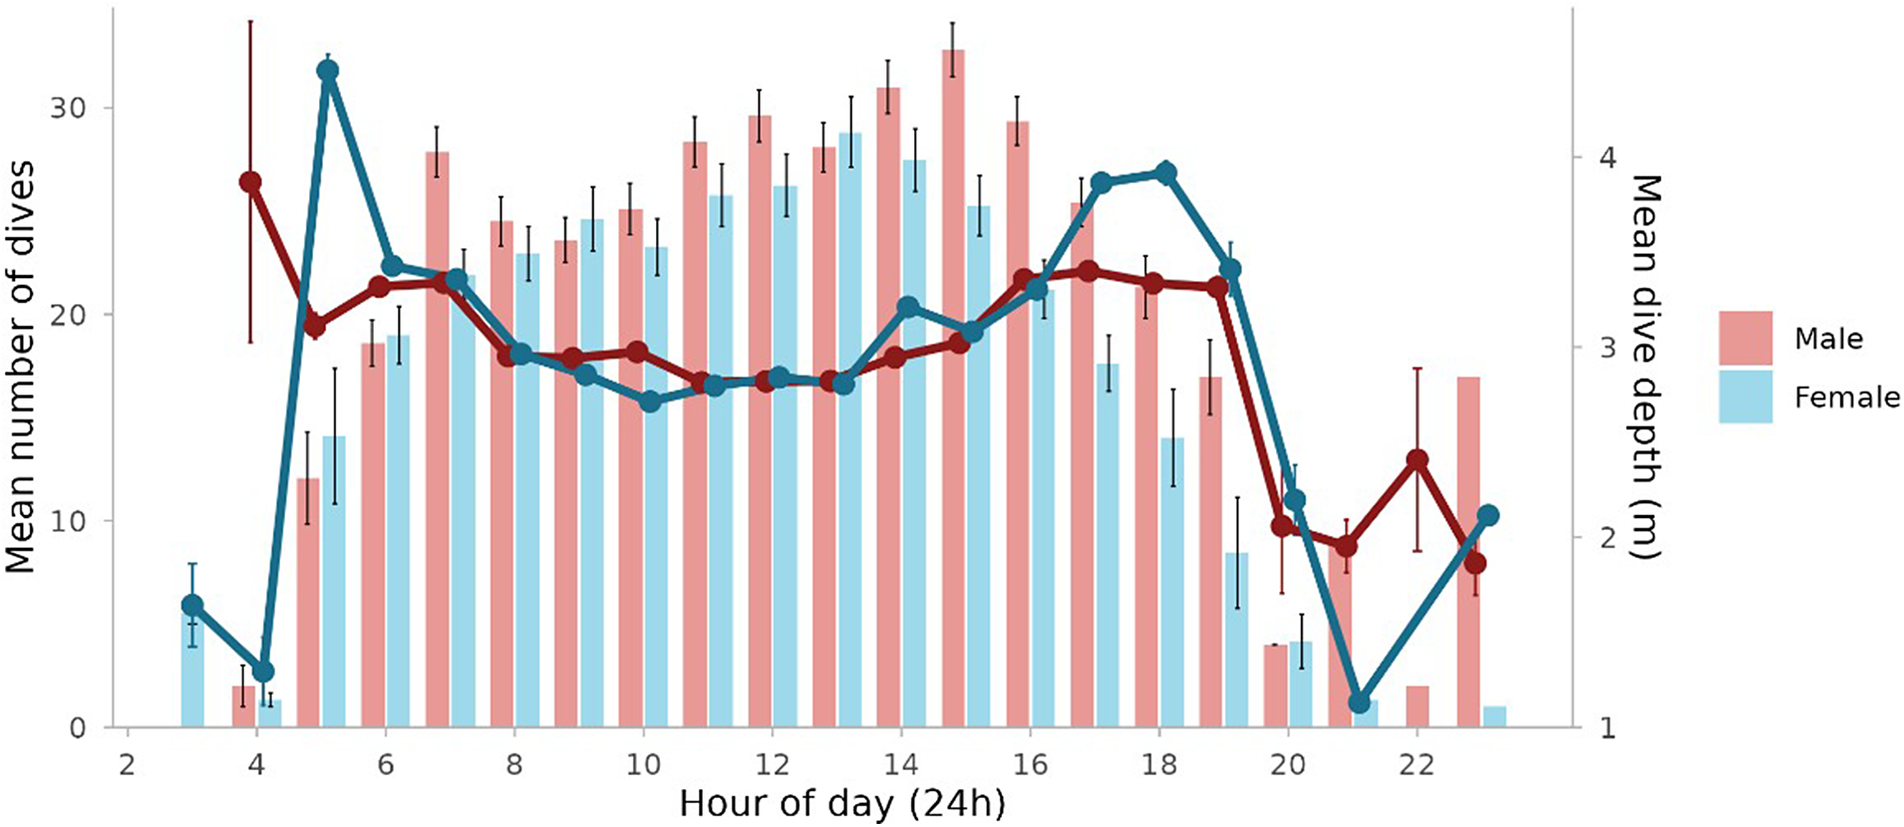
Figure 5. Long description
The x-axis represents the Hour of day in a 24-hour format, ranging from 2 to 23. The primary y-axis on the left measures the Mean number of dives from 0 to 30. The secondary y-axis on the right measures Mean dive depth in meters from 1 to 4. A legend indicates that red represents males and blue represents females.
* Bar Plot (Mean number of dives): Diving activity begins around 03:00 and 04:00. For both sexes, the number of dives increases steadily, peaking between 12:00 and 15:00. Males generally show a higher frequency of dives than females, particularly in the afternoon, with a peak of approximately 33 dives at 15:00. Activity drops sharply after 19:00, reaching near zero by 22:00.
* Line Plot (Mean dive depth): Depth shows high variability in the early morning. A significant peak in depth occurs for females at 05:00, reaching over 4 meters. Throughout the midday period (08:00 to 16:00), both sexes maintain a relatively consistent depth between 2.5 and 3 meters. A second peak in depth occurs for both sexes between 17:00 and 19:00 before declining in the late evening.
* Error bars indicate standard errors for both the number of dives and the dive depth across all hours.
Dive behaviour varied across months (Figure 4). During spring and summer (September–February), when sample sizes were highest, mean dive depths generally ranged between ~2.8–3.3 m, with dive frequency peaking in December. Mean dive depths were higher in May–June, reaching monthly means of 3.1–5.9 m; however, these months were represented by only two tracked individuals in May and one in June.
Diving within mussel farms was also seasonal (Figure 4). From October to December <5% of dives occurred within farms, whereas from February to May farms accounted for approximately 24-29% of dives, suggesting targeted use of farm habitat. Dives within farms were significantly deeper than off-farm dives (3.71 ± 0.20 vs 3.03 ± 0.08; mixed model F = 1339.2, P <0.001), although dive duration did not differ significantly (24.4 ± 0.9 s vs off-farm: 24.1 ± 0.5 s; F = 2.93, P = 0.09).
Bird mortality
Two tagged birds were confirmed to die during the study. Bird 224983 drowned on 19 October 2023 while foraging within 100 m of the shoreline near Whakatete Bay (Figure 1). Dive-profile data indicated that the bird drowned after being held underwater at a depth of approximately 2 m for >5 minutes. Subsequent GPS data showed the bird drifting into the Waihou River, where it was not recoverable. Bird 224976 drowned on 25 December 2023 while foraging approximately 500 m offshore south of Ruamahanga (Figure 1). Dive-profile data indicated that the bird was held underwater for >3 minutes. GPS data revealed that the bird was then immediately transported approximately 23 km (presumably by boat) to a boat ramp in the Waitakaruru River, after which the body was transported by vehicle (based on GPS signal following local roads at high speed) and disposed of in a farm drain approximately 4 km inland. This bird was recovered, thanks to its GPS signal. When recovered, the tracking tag remained attached; however, the birds numbered leg band had been removed and was not located.
Commercial fisheries interactions
Commercial set-net fishing activity occurred throughout the foraging range of tracked kawau tikitiki, with fishing effort concentrated along the southern and eastern Firth of Thames coastline, overlapping substantially with core bird foraging areas (Figure 6). During our study with tracked birds carrying active tags, a total of 2,274 commercial set-net fishing events occurred within the study area. Overall, 31.5% of fishing events fell within the 95% UD (home range), 2.1% within the 50% UD (core foraging area), and 0.3% within the 10% UD (high-use area). Spatial overlap was highest during the spring–summer months (November–February), and particularly in November and December when kawau tikitiki foraging effort peaked in the southern firth. Temporal patterns of fishing and bird diving activity also overlapped, with set-netting concentrated during daylight hours, coinciding with peak kawau tikitiki diving activity. Overlap was greatest during the morning (07:00–10:00), when both fishing effort and bird dive frequency were high.
Spatial overlap between kawau tikitiki diving activity and commercial set net fisheries in the Hauraki Gulf. Utilisation distributions (UDs) are shown as 95% (dashed black line; home range), 50% (solid black line; core foraging area), and 10% (filled black polygon; high-use areas). (A) All tracking data overlaying fishing data for months birds were tracked; (B) November–December 2023 tracking and fish subset, when birds concentrate along the Firth of Thames coastline. Fishing activity density is represented by a heat map from low (light yellow) to high (dark red). Symbols indicate breeding colonies/overnight roosts, day roosts, commercial net interactions, recreational set nets observed during November and December surveys and recorded mortality events.
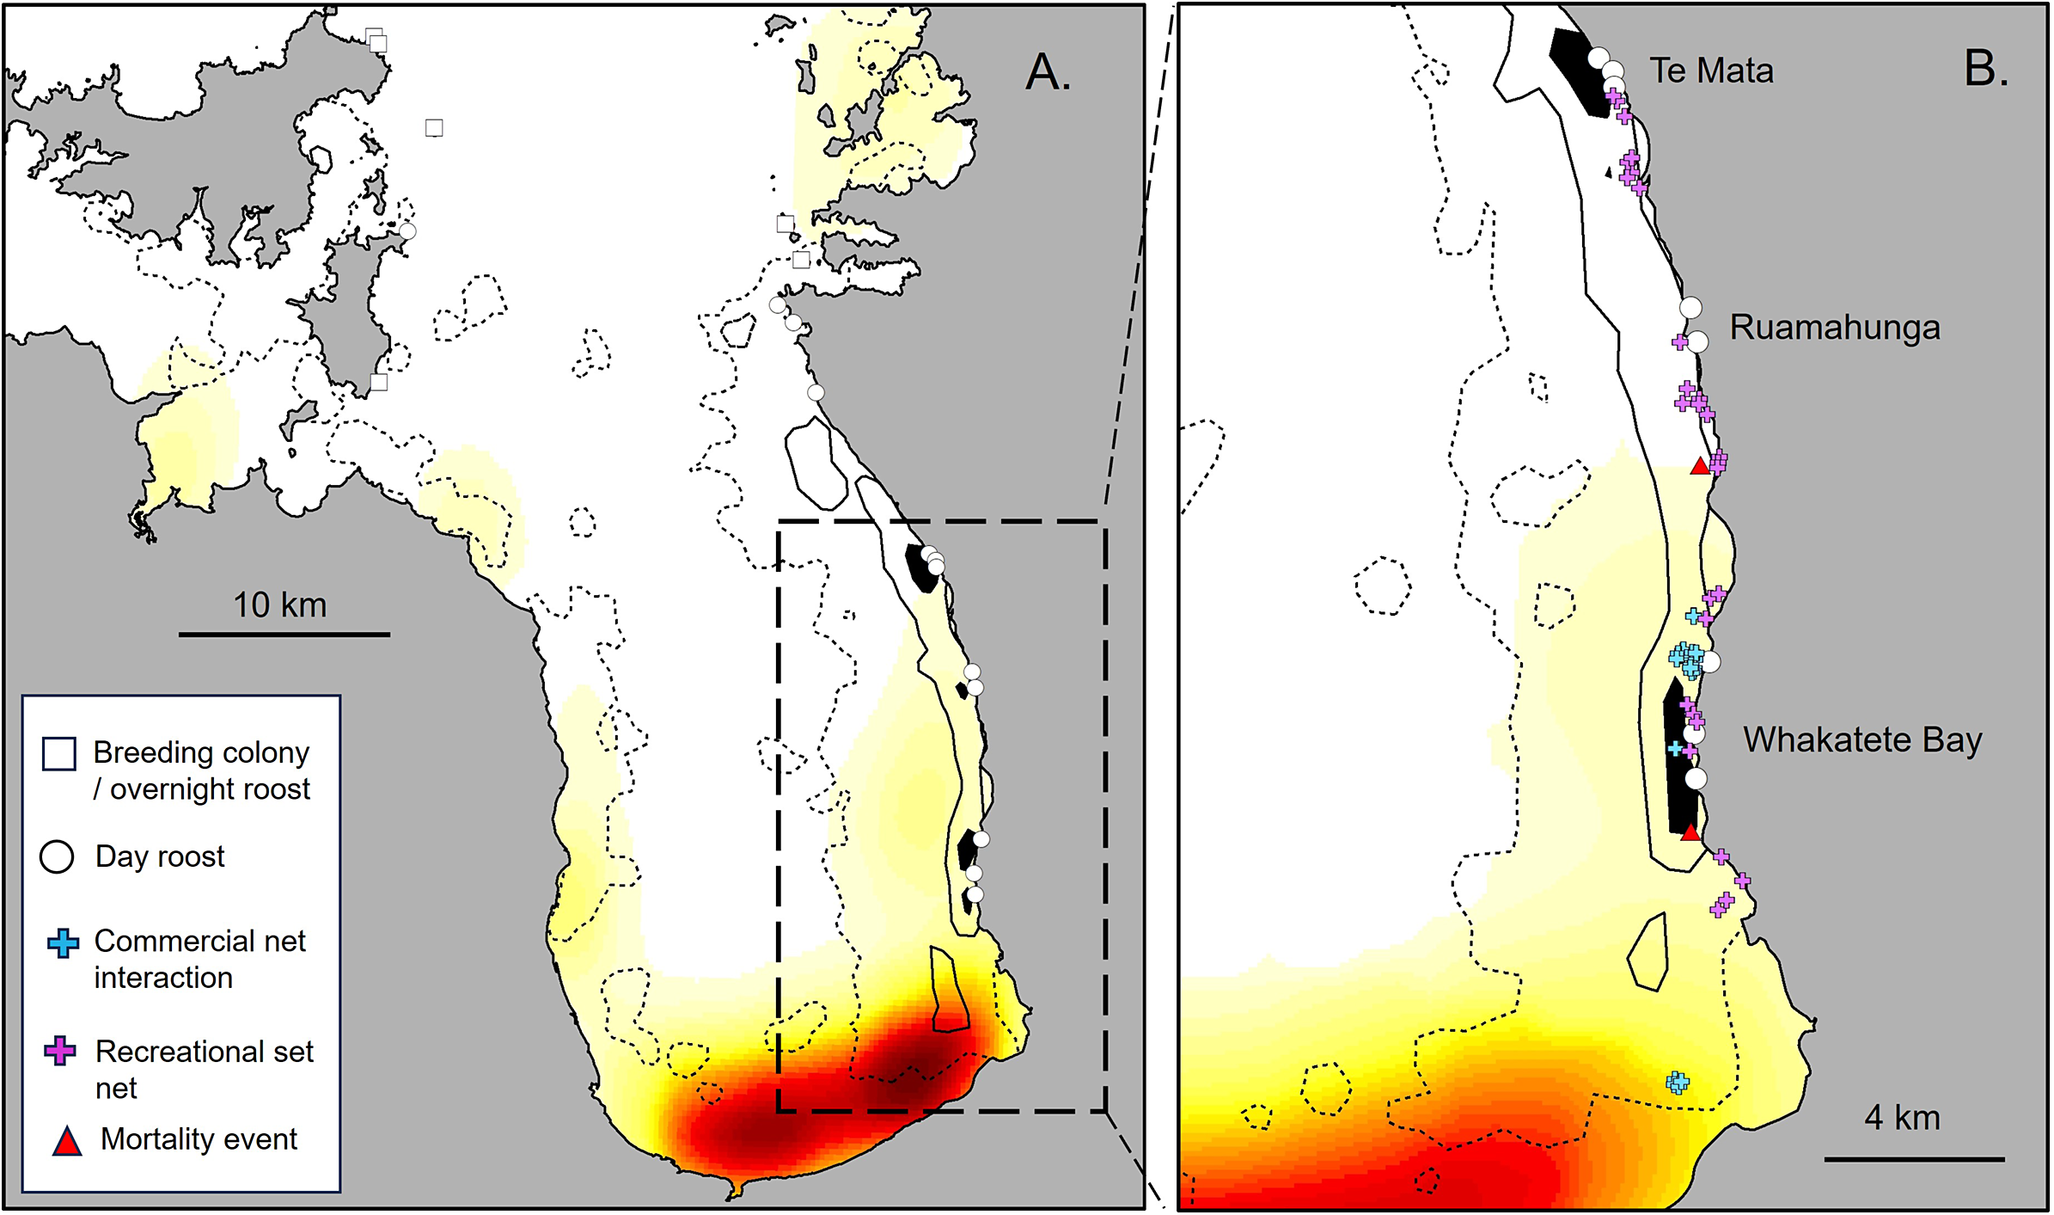
Figure 6. Long description
A two-panel map set labeled A and B.
Panel A shows the Hauraki Gulf with a 10 kilometer scale bar. The map features three nested U D layers. At the core are high-use areas represented by filled black polygons. Surrounding these is a solid black line indicating the 50 percent core foraging area. The outermost layer is a dashed black line representing the 95 percent home range. A heat map indicates fishing density, transitioning from light yellow in the North and West to dark red in the South. A dashed rectangular box on the Eastern coastline indicates the area magnified in Panel B.
Panel B provides a detailed view of the Firth of Thames coastline with a 4 kilometer scale bar. It identifies specific locations from North to South: Te Mata, Ruamahunga, and Whakatete Bay.
Symbols distributed across both maps include:
* White squares for breeding colonies or overnight roosts.
* White circles for day roosts.
* Blue plus signs for commercial net interactions.
* Purple plus signs for recreational set nets.
* Red triangles for recorded mortality events.
In Panel B, recreational set nets and mortality events are concentrated along the coastline between Ruamahunga and Whakatete Bay, overlapping with the black high-use polygons and the high-density red fishing zone in the South.
We identified 27 individual dive events from five tracked birds (two males, two females, one unknown sex) that occurred within 300 m of a concurrently active commercial set net (Figure 6). The distance between bird dive locations and active nets ranged from 50 to 296 m: one dive (3.7%) occurred within 50 m, two (7.4%) within 100 m, eight (29.6%) within 200 m, and all 27 within 300 m (Supplementary material Table S1). Interactions involved four separate fishing events. However most (19 of 27 dives; 70%) occurred on a single day (5 November 2023), when five tagged birds foraged simultaneously in close proximity to an active set net deployed between 07:10 and 09:10. Additional interactions were recorded on 21 November (four dives from one male bird near a set net at midday), and on 5 and 21 December 2023 (four dives from one bird of unknown sex near afternoon set-net deployments). Notably, bird 224976, one of the two birds that subsequently drowned during the study, was recorded making nine dives within 200–278 m of an active set net on 5 November 2023, approximately seven weeks prior to its death.
Recreational set net survey
Over the survey period of 18 weekend days between 1 November and 28 December 2025, a total of 30 recreational set nets was recorded along the Thames Coast Road between Thames and Te Mata (Figure 6). Few nets appeared attended and where this did occur i.e., 3 of 30 occasions, once was by a shore-based fisher and with the other two by boats. Estimated distances from shore ranged from 10 to 500 m (mean = 186 m). Nets were located 1717 ± 938 m (range 245–3,033 m) from key kawau tikitiki roosting sites (Figure 6), and flocks of birds (between 5 and 20 individuals) were observed foraging within 500 m of nets on five occasions. This included two instances where nets were set directly in front of roost sites at Ruamahunga and Whakatete Bay, within 300 m of roosting birds and <200 m from birds actively foraging in the water (9 and 29 November). Recreational set nets overlapped strongly with kawau tikitiki foraging distributions during November and December with 100% (30 / 30 nets) and 67% (20 / 30 nets), occurring within the 95% and 50% UDs for combined November and December data. No nets fell within the 10% UD.
Discussion
Despite the species’ historically widespread distribution in Aotearoa New Zealand, our understanding of the foraging ecology of kawau tikitiki has been mainly derived from South Island studies from observations and colony-based prey remains data (Lalas Reference Lalas1983; Stonehouse Reference Stonehouse1967). Here we applied high-resolution GPS and dive-logging technology to provide the first detailed assessment of at-sea habitat use, diving behaviour and potential fisheries interactions for the threatened Hauraki Gulf population. While based on a modest sample size across only two years with uneven seasonal coverage, the consistency of patterns across individuals provides confidence in the main findings.
These data are timely given results of our decade-long monitoring programme at the breeding colonies, which indicate a modelled population decline of approximately 7% per year between 2015 and 2025. In absolute terms, total nest counts fell from 306 nests in 2015 to 154 nests in 2025. This represents an effective halving of the breeding population within a decade, equivalent to the loss of approximately 25 breeding adults per year. Population dynamics in long-lived seabirds such as cormorants are sensitive to adult survival, meaning that even relatively small increases in mortality can drive population declines (Nur and Sydeman Reference Nur and Sydeman1999). A decline of this magnitude is concerning for a small and geographically isolated population.
The Anita Bay and Hook’s Bay colonies on Waiheke Island are potentially exposed to mammalian predators such as ship and Norway rats Rattus rattus and R. norvegicus, feral cats Felis cattus and stoats Mustela erminea, which can have negative impacts on cormorant colonies (Barros et al. Reference Barros, Romero, Munilla, Pérez and Velando2016).These two outlying colonies are small compared to the main breeding colony on Tarahiki Island, which remains free of introduced mammals. Large predatory birds such as eagles can also target cormorant colonies (Bregnballe et al. Reference Bregnballe, Tofft, Kotzerka, Lehikoinen, Rusanen and Herrmann2022), and in the Hauraki Gulf, the Australasian harrier Circus approximans has been seen attacking white-fronted tern Sterna striata colonies to take chicks (Rayner et al. Reference Rayner, Neureuther, Neureuther and Neureuther2023). However, in over ten years of surveys we saw only a single suspected chick predation event at Tarahiki, when a harrier was observed feeding on a recently dead chick. Given our lack of observation of harriers targeting kawau tikitiki colonies, and the fact that adult kawau tikitiki are larger than harriers, have a prolonged guard phase of up to three weeks and actively defend nests, we consider sustained predation pressure from harriers unlikely. Importantly, all three colonies exhibited declines over the monitoring period, suggesting site-specific predation is unlikely to explain the overall trajectory. Although fledging success was not formally quantified, repeated observations indicated high productivity at the breeding colonies judging by the number of nests with well-grown chicks and many immature (1 year old) birds present at colonies during the breeding season. Avian influeza remained absent from New Zealand during our study. Taken together, our lack of evidence for significant colony-based mortality, and the parallel decline across the three breeding sites, suggests that factors operating in the marine environment are the most likely primary driver of decline in this population.
Foraging distribution, dive behaviour, and use of mussel farms
Our dive location data show that kawau tikitiki are mostly restricted to core habitats in inshore waters of the Firth of Thames and off eastern and southern Waiheke Island. Foraging occurred no more than 10 km from the coast, which is consistent with historical observations elsewhere (Lalas Reference Lalas1983; Stonehouse Reference Stonehouse1967). Core foraging habitats (50% UD) were small and feeding and roosting sites on the eastern Firth coastline and nearby mussel farms were critical habitats. Although our dataset included robust sample sizes only during spring and summer (September to February), with smaller samples from March to June, the results nonetheless suggest that kawau tikitiki move seasonally within their small foraging range. Seasonal movements have been documented in other cormorant species. In North America, double-crested cormorants Nannopterum auritum undertake migrations of thousands of kilometres between breeding and wintering areas (King et al. Reference King, Wang and Cunningham2022; Scherr et al. Reference Scherr, Bowman and Abraham2010). In contrast, Australian, black-faced cormorants Phalacrocorax fuscescens have varied movement strategies, from year-round residency near breeding sites to post-breeding dispersal of up to 250 km (Cansse et al. Reference Cansse, Lens, Orben, Sutton, Botha and Arnould2024). Likewise, the Arabian Gulf endemic species, the Socotra cormorant Phalacrocorax nigrogularis appears to move seasonally within its restricted range to follow locally abundant prey species (Muzaffar et al. Reference Muzaffar, Clarke, Whelan, Gubiani and Cook2017).
For kawau tikitiki, roost availability also appears to be an important habitat feature with birds moving between overnight roosts, concentrated in the northern extent of their range (including breeding sites) and day roosting sites used for resting and drying out between feeding bouts (Figure 2). Coastal day roosts along the eastern Firth coastline, at Te Mata, Ruamahanga and Whakatete Bay, appear particularly important during concentrated spring and summer foraging. These sites likely function to reduce commuting costs during intensive foraging periods. The spatial coupling between southern Firth foraging areas and coastal roosts suggests that safe, undisturbed roost sites represent a critical component of the foraging system.
Dive behaviour patterns also indicate an underwater foraging niche which changes seasonally. During spring and early summer, birds concentrated in shallow coastal waters of the southeastern Firth of Thames where dives typically reached the seabed. In autumn and winter birds moved north into deeper habitats, however dive depths remained similar suggesting they were exploiting mid-water prey sources. Both of these foraging strategies have been described in this species in southern Aotearoa New Zealand (Lalas Reference Lalas1983; Stonehouse Reference Stonehouse1967). How cormorants use the water column depends not just on how deep they dive, but also on how deep the water column is (Christensen-Dalsgaard et al. Reference Christensen-Dalsgaard, Mattisson, Bekkby, Gundersen and May2017; Peck-Richardson et al. Reference Peck-Richardson, Lyons, Roby, Cushing and Lerczak2018). In our study, birds dived to similar depths across seasons, but because they moved into deeper areas later in the year, those same dive depths were less likely to reach the seabed. Dive behaviour was predominantly diurnal, which is consistent with studies of other cormorants (Cook et al. Reference Cook, Hamann, Pichegru, Bonadonna, Grémillet and Ryan2012; Lorentsen et al. Reference S.-H, Christensen-Dalsgaard and Mattisson2019). This likely reflects the fact that birds are dependent on adequate light levels for visually based hunting. In European Shags Phalacrocorax aristotelis, foraging efficiency and accumulated dive depth correlate with daylight period and chick provisioning demand (Lorentsen et al. Reference S.-H, Christensen-Dalsgaard and Mattisson2019).
Mussel farms represented a significant seasonal habitat. During spring and early summer (October–December), fewer than 5% of dives occurred within mussel farms, whereas from February to May these farms accounted for 20–30% of dives. This increase coincided with the movement of birds away from the shallow southeastern Firth of Thames coastline later in the year. Birds dived deeper and less frequently within farms than in non-farm habitats, although dive duration did not differ. These patterns suggest that prey within farms may be spatially structured and profitable. GPS locations and field observations at mussel farms indicated regular and widespread use of large farm buoys for resting between foraging bouts, particularly in sheltered areas and in calm weather. Roosting is not possible during rough conditions when buoys are over washed by the sea. Mussel farms were used for roosting, both when birds were feeding within the farms, or when foraging nearby. The farms therefore likely represent multifunctional habitat. Our analysis focused solely on dive behaviour, so we have probably underestimated the overall use of mussel farms.
The importance of mussel farms to kawau tikitiki must also be considered in the historical context of habitat loss within the Firth of Thames. Extensive subtidal beds of green-lipped mussels formerly occurred throughout the inner Hauraki Gulf and Firth of Thames, forming dense biogenic reefs to depths of 30 m (Paul Reference Paul2012). These mussel beds supported a dredge fishery from the early 1900s, which expanded through the mid-20th century and then collapsed by the 1960s through overharvesting. Ongoing surveys show little sign of recovery (Paul Reference Paul2012), but in the small number of remnant beds fish densities were found to be 13 times higher than surrounding areas (McLeod et al. Reference McLeod, Parsons, Morrison, Van Dijken and Taylor2014). Mussel farms may now provide that role that reefs once did, forming artificial vertical biogenic “reef” structures that support dense biofouling communities, including macroalgae and invertebrates, and may function as habitats analogous to natural reef systems (Underwood and Jeffs Reference Underwood and Jeffs2023; Underwood et al. Reference Underwood, van der Reis and Jeffs2023). In northern New Zealand, mussel farms support fish settlement and recruitment at rates comparable to adjacent rocky reefs (Underwood and Jeffs Reference Underwood and Jeffs2023), and globally, shellfish aquaculture is recognised as providing artificial reef habitat that enhances local food-web complexity and benefits higher trophic level predators (Callier et al. Reference Callier, Byron, Bengtson, Cranford, Cross and Focken2018; Theuerkauf et al. Reference Theuerkauf, Barrett, Alleway, Costa-Pierce, St. Gelais and Jones2022; Underwood et al. Reference Underwood, Mugica and Jeffs2024). The seasonal foraging of kawau tikitiki within mussel farms may represent a partial functional replacement of lost natural mussel reef habitat, albeit on a much smaller spatial scale. The historical destruction of extensive subtidal mussel beds may therefore have reduced the availability of benthic foraging habitats in the Firth of Thames, potentially contributing to long term decline in the kawau tikitiki population from the mid-20th century (Rawlence et al. Reference Rawlence, Rayner, Lovegrove, Stoddart, Vermeulen and Easton2019).
Seasonal changes
Our tracking suggests a seasonal shift in the foraging distribution and water-column use of kawau tikitiki, and several non-exclusive drivers are likely responsible. First, birds may be tracking seasonally available prey. The Firth of Thames undergoes seasonal lower-food-web change, with elevated spring primary production driving increased phyto- and zooplankton biomass, supporting fish recruitment (Green and Zeldis Reference Green and Zeldis2015; Zeldis and Willis Reference Zeldis and Willis2015). Small pelagic fishes such as anchovy Engraulis australis and pilchard Sardinops sagax spawn in spring–summer and aggregate in shallow, productive inshore waters during this period (Paul et al. Reference Paul, Taylor and Parkinson2001). Seasonal increases in zooplankton and associated inshore concentrations of these forage fish could therefore generate predictable spring–early summer prey availability in the southern Firth of Thames. This mechanism is consistent with the aggregation of kawau tikitiki we observed during this period, although direct seasonal prey data are lacking. Second, seasonal changes in habitat conditions may reduce the profitability of southern Firth of Thames habitats as waters reach peak temperatures in late summer and early autumn. During this period, density stratification develops in the inner Firth, limiting vertical mixing and leading to reductions in bottom-water oxygen saturation (Green and Zeldis Reference Green and Zeldis2015). Episodic low-oxygen conditions can persist for weeks in late summer and may extend shoreward (Green and Zeldis Reference Green and Zeldis2015). If reduced oxygen alters prey availability, it would explain the observed movements of tracked birds away from shallow southern habitats in late summer. Seasonal responses to shifting prey availability and environmental conditions have been reported in other cormorant species (Cansse et al. Reference Cansse, Lens, Orben, Sutton, Botha and Arnould2024; Guillaumet et al. Reference Guillaumet, Dorr, Wang, Taylor, Chipman and Scherr2011).
Fisheries interactions
Spatial and temporal overlap between kawau tikitiki foraging areas and commercial set-net fisheries was pronounced, particularly in the southern Firth of Thames during November and December. This period occurs following breeding, when adults are recovering condition and fledglings are learning to forage. Energetic demands remain high, and birds are concentrated in shallow coastal habitats. The concentration of bird-set-net interactions during morning hours (07:00–10:00) coincides with peak daily diving activity. In the shallow coastal waters of the southern Firth of Thames birds foraging at or near the seabed are vulnerable to both surface- and bottom-set nets, with observed interaction depths (1.4–4.0 m) consistent with benthic foraging. The fact that five of 14 tracked birds were simultaneously foraging within 300 m of a single active set net on 5 November 2023 highlights the spatially aggregated foraging behaviour of this species, which places it at risk of mass drowning events.
While our interaction analysis was restricted to commercial fisheries data, a recreational set-net survey along the Thames Coast (November–December 2025) confirmed that recreational nets are frequently deployed within core kawau tikitiki foraging areas, representing an additional and currently unquantified risk. Recreational set netting likely occurs throughout the species’ range, further compounding the threat. Our observations of birds foraging near nets set close to roosting sites is particularly concerning, as it indicates a high risk of entanglement and drowning. Recreational set netting is a poorly quantified but significant source of bycatch for seabirds and other protected species in New Zealand, with limited monitoring and reporting (Abraham et al. Reference Abraham, Berkenbusch and Richard2010). For example, an eight-year study in Otago Harbour documented substantial mortality of kawau tikitiki and other wildlife in set nets (Lalas Reference Lalas1991), highlighting the potential for localised impacts where fishing effort overlaps with key foraging habitats.
The drowning of two tracked birds from a small number of tagged individuals during our study provides strong evidence that set-net mortality is occurring in this population. Net-entrapment rates in great cormorants P. carbo have been shown to increase with proximity of fishing effort to colonies and roosting sites (Bregnballe and Frederiksen Reference Bregnballe and Frederiksen2006), a pattern consistent with the results of our study. In New Zealand, commercial set netting in inshore waters is typically conducted by small vessels with very low levels of independent observer coverage (e.g. ~1.3%, New Zealand Department of Conservation 2023, 2024), in contrast to larger offshore fisheries where observer programmes provide greater oversight of bycatch (New Zealand Department of Conservation 2023, 2024). Consequently, bycatch in these inshore fisheries is likely to be under-reported.
Taken together, the repeated fine-scale overlap between kawau tikitiki and fishing effort, the concentration of birds in high-risk habitats, and documented mortality events indicate that fisheries interactions represent a significant threat to the persistence of this genetically distinct population.
Conservation implications
Our results indicate that kawau tikitiki in the Hauraki Gulf are exposed to multiple pressures likely contributing to the ongoing population decline. Breeding success may be constrained at some colonies by the presence of mammalian predators, particularly on Waiheke Island where rats, cats and mustelids occur. Our tracking also highlights the importance of coastal roosting sites used for rest and recovery between foraging bouts. These sites are probably critical for meeting daily energetic requirements, yet many occur along accessible shorelines, particularly along the Firth of Thames coastline. Observations from this study suggest that birds frequently roost in areas subject to human disturbance, including recreational rock fishing, which may disrupt resting behaviour and increase energetic costs. Despite their importance, these sites currently receive no formal protection.
Against this backdrop, our results provide evidence that set-net fisheries represent a significant and under-recognised threat to kawau tikitiki in the Hauraki Gulf. The combination of spatial and temporal overlap between commercial set-netting and core foraging areas, shallow nearshore diving behaviour, and the confirmed mortality of tracked individuals indicates that bycatch risk is likely ongoing and may threaten the persistence of this population. This risk is probably underestimated, as recreational set-netting also occurs within the same high-use areas but remains largely unquantified. Given the small size of the breeding population and the observed annual decline of approximately 7%, the loss of only a small number of breeding adults each year—potentially as few as 10–20 individuals—may be sufficient to sustain the current downward trend.
The recent establishment of the Pakatoa and Tarahiki/Shag Island HPA under the Hauraki Gulf / Tīkapa Moana Marine Protection Act 2025 (New Zealand Government 2025) provides important protection for marine habitats surrounding the principal kawau tikitiki breeding colony, including the removal of commercial and recreational fishing from these waters. However, our data indicate that its direct benefit in reducing fisheries interactions for kawau tikitiki are limited. Though birds roost and breed at Tarahiki, their principal foraging areas occur elsewhere, particularly 40 km south along the eastern and southern Firth of Thames coastline, well outside the HPA. During November and December, when overlap with set-net fisheries was greatest, birds were concentrated in these unprotected waters. This highlights a broader challenge for spatial marine conservation in as much as protected areas established around geographically fixed habitats may provide only partial protection for mobile marine predators whose forage elsewhere (Zhang et al. Reference Zhang, Carroll, Constantine, Andrews-Goff, Childerhouse and Cole2024). For kawau tikitiki, extending spatial protection to encompass identified high-use foraging areas, or establishing targeted seasonal no-set-net zones within these areas, could substantially reduce bycatch risk. Such protection would not necessarily require permanent closure of the entire foraging range; spatial and temporal measures targeted to predictable high-risk areas and periods may provide substantial conservation benefit while limiting restrictions on fisheries.
Conservation management of kawau tikitiki in the Hauraki Gulf should prioritise ongoing monitoring of breeding populations, protecting exposed colonies from predators, and safeguarding key coastal roosting sites from disturbance. Reducing interactions with set nets in high-risk foraging areas, particularly along the southern and eastern Firth of Thames coastline during the post-breeding period, is critical. Mitigation measures should include targeted observer or camera-based monitoring on vessels to improve reporting and assess compliance, spatial or seasonal restrictions on set netting in identified risk hotspots, and temporal restrictions to reduce overlap with peak morning foraging activity. Extending these approaches to recreational fishers, including restrictions on set netting in core habitats, is also important. Because kawau tikitiki remain overlooked by the public despite being one of New Zealand’s most distinctive coastal seabirds, an outreach campaign to raise awareness of their conservation status, ecological importance, and vulnerability to fisheries bycatch could help build community support for protective measures and encourage voluntary changes in fishing practices. Reducing fisheries mortality in these predictable high-risk areas, alongside improved monitoring and reporting of bycatch, will be critical to reversing the decline of this small and genetically distinct population.
Supplementary material
The supplementary material for this article can be found at http://doi.org/10.1017/S0959270926100744.
Acknowledgements
We are grateful to the Ngāti Paoa Trust Board for support and permission for our work on Tarahiki Island. We thank Greg Meikle and Bruce Goff from the Auckland Council Harbourmaster’s office and Rob Chappell (Department of Conservation) for providing boat transport during population surveys and the many volunteers who assisted with population surveys at the breeding colonies including Gaia Dell’ Ariccia, Maira Fessarrdi, Jennifer Carol, Samantha Hill, Andrew Nelson, Michael Ngatai and Chris Bindon. Graeme Taylor, Alan Tennyson, Emma Rowell, Ted Kitching and the late Michael Taylor provided historical information on the Hauraki Gulf population, while Tony Habraken provided observations and count data along the western shore of the Firth of Thames. Rotoroa Island Trust kindly provided accommodation during field work, and we are grateful to Glen and Milly Lucas for their wonderful hospitality. We are indebted to Katina Conomos and Simon Lear who coordinated the Thames coast community recreational set net surveys and to local citizen scientists who collected these data including Samara Kollen, Sam Lapere, Mike Milburn, Keri Moyle, Ed Mroceck, Sally and Rod Poulgrain, Jeremy Pyatt, Deirdre Savage, Robyn Sinclair and Susanne Single-Liertz. We thank William Gibson and Daniel Heslop from Fisheries New Zealand (Ministry of Primary Industries) for providing commercial net fisheries data under a confidentiality agreement with Auckland Museum and André Bellvé and Marina Klemm for the help with R coding. Funding for this research was provided by the C & L Gregory Trust, the Auckland Council and the Birds New Zealand Research Fund. Funding for Ornitela loggers was provided as part of the Cormorant Oceanography Project through the Office of Naval Research (ONR) Grant N000141912218. Funding for analyses was also provided by the New Zealand Department of Conservation Services Conservation Services Programme, and we thank Igor Debski and Johannes Fischer for their support. This research was conducted under authorisation from the New Zealand Department of Conservation (73861-FAU) and with ethics approval from the University of Auckland (AEC23914) and Oregon State University.