

Introduction
The 1970s industrial crisis marked the end of the Golden Age of capitalism, dismantling the dominance of large vertically integrated firms and diminishing the role of industrial policies in economic development.Footnote 1 In Europe, this shift led to a deindustrialization process that impacted regions to varying degrees depending on their specialization and productive structure.Footnote 2 From that moment onwards, industry was relegated to a secondary role in the political and academic spheres. However, the Great Recession, the COVID-19 crisis, and the current geopolitical tensions reignited the debate on European policy-driven reindustrialization, reinforcing the idea that targeted industrial strategies can enhance competitiveness and sustainable long-term development.Footnote 3
The transformations associated with the Second Industrial Divide led scholars to reassess Marshall’s agglomeration economies, trying to understand how the new spatial configuration of economic activity could favor economic development through endogenous growth processes.Footnote 4 On this basis, Porter conceptualized clusters as the geographic agglomeration of industries and related agents interconnected through knowledge, specialized labor, Input-Output transactions, and other linkages.Footnote 5 Clusters’ positive impact on regional growth and firm performance rapidly spurred further research. One prominent line focused on cluster typologies, highlighting how hierarchical structures enable large firms to shape their environment.Footnote 6 Other authors examined the role of path dependence and continuous agent interactions on cluster life cycles.Footnote 7 In both cases, literature has identified direct cluster-oriented policies as one key factor in explaining the success of these ecosystems and the agents that comprise them.Footnote 8
Nevertheless, works on cluster analysis have mostly adopted an in media res approach, primarily focusing on the dynamics of existing clusters, while there continues to be a lack of understanding regarding how and why these ecosystems originate.Footnote 9 As Giacomin underlines, “Despite efforts to generalize and categorize, studies fail to provide a clear-cut picture of how emergence works as a process.”Footnote 10 The lack of historical analysis renders emergence as a static outcome at a specific point in time rather than as the result of a complex and iterative change process resulting from the actions of companies, institutions, and their relationship with their particular context.Footnote 11 Similarly, the role of public policies in cluster emergence remains understudied. While direct cluster-oriented policies have been shown to enhance existing clusters, little is known about broader interventions that, though not explicitly designed for this purpose, may trigger cluster formation and influence their trajectory.
To address this gap, this paper examines the emergence and first evolution of the metalworking cluster in Asturias from the end of the Spanish Civil War in 1939 to the onset of industrial restructuring.Footnote 12 After the victory of the fascist faction, Asturias became a strategic industrial pole for the Francoist regime. As the most prominent example, in 1950, the regime established in the area the national steelmaking champion, Ensidesa, which absorbed the bulk of direct intervention in the region (credit lines and direct investment, preferential access to input quotas, bilateral agreements for machinery imports, and the creation of ad hoc infrastructures).Footnote 13 Once the regime was over, the region’s traditional specialization made it particularly vulnerable to the impact of industrial restructuring. Yet, the metalworking sector emerged as the regional leader in this deindustrialization context thanks to the consolidation of a hierarchical cluster environment. Spatial agglomeration around Ensidesa fostered firms’ interconnections—both horizontally, through the exchange of intermediate and capital goods, and vertically, with the steelmaking industry serving as both supplier and client. In addition, dense R&D networks developed beyond these material linkages, often involving public universities and research centers. A group of medium-to-large firms led the ecosystem, specializing in the development of high-value-added projects for international markets. This paper explores the historical dynamics behind the emergence of this cluster, which employs more than 20,000 people nowadays.Footnote 14
Methodologically, the paper is built on a mixed-methods approach. One of the paper’s main contributions is an innovative, qualitative use of the New Industries Files (1939–1960), which, through detailed reports on requirements of various kinds, provides detailed information on the sector’s companies and their relationship with Francoist institutions.Footnote 15 Despite being a highly reliable source, the absence of some notable companies indicates that it is fragmented and not fully preserved. To quantitatively reconstruct series and indicators, it has been combined with other primary sources, such as the 1958 National Industrial Census of Companies and the Input-Output tables of the Principality of Asturias, which are available for the years 1968, 1978, and 1985.Footnote 16
This study presents how the sector’s counterintuitive success stemmed from a cumulative process developed in the very long term, with roots dating back to the late eighteenth century. After the bottlenecks caused by the post-war autarky, the spillovers generated by Ensidesa enabled the sector to grow in the shadow of steelmaking, benefiting from endogenous dynamics characteristic of a hierarchical cluster. Additionally, the paper sheds light on the role of public policies in cluster emergence and how they can unintentionally shape their long-run trajectory. The Asturian metalworking sector benefited from public intervention, but only indirectly, as the regime never considered the positive externalities generated by Ensidesa to be the basis for a potential virtuous cycle. On the contrary, metalworking companies suffered numerous inefficiencies and contradictions resulting from arbitrariness, while Francoist institutions systematically ignored the voices that identified the sector’s potential and called for direct support.
The obtained results are theoretically consistent with the 3-stage model for cluster emergence proposed by Brenner and Müligh (2013). This framework departs from the existence of determined and required (1) prerequisites, identified as all the conditions (factors, resources) that must be present before the emergence of the cluster. These are necessary but insufficient, as their existence only allows a cluster to emerge, but some accident, random circumstance, or (2) triggering event must occur. Finally, the (3) self-augmenting dynamics appear, reinforcing cluster development (see Annex 1). This last stage encompasses the positive effect of Krugman’s local externalities, which “is the basis for all the theories and explanations found in the literature.”Footnote 17 Combining these paradigms with the construction of historical narratives allows shifting the focus from events to processes, grounding theory, and placing agency and contingency at the core of the analysis.Footnote 18 Integrating agents and their actions into the narrative reveals the mechanisms of this iterative process, which can lead to potential lock-in and endogenous growth. Consequently, certain “accidents” or random incidents could be explained within a particular context and due to decision-making.
This paper contributes new insights to literature on cluster emergence, highlighting the value of historical analysis in understanding these processes.Footnote 19 Moreover, it deepens our understanding of how non-cluster-oriented public policies can influence the birth and evolution of such ecosystems.Footnote 20 Finally, using the Spanish case, this study offers a new perspective on the historical determinism of the industrial policies of European totalitarian regimes in the twentieth century and their impact on long-term sectoral and territorial development through the lens of firms and non-strategic sectors.Footnote 21 More specifically, the paper emphasizes the potential of narratives and case study analysis to dialogue with other works that, using approaches more closely aligned with Economic Geography, have identified the factors influencing the life cycles of diverse clusters and industrial districts in Southern Europe.Footnote 22
The paper is organized as follows. The next section reconstructs and analyzes the emergence of the Asturian metalworking cluster and its evolution up to industrial restructuring. Then, the role that the Francoist regime played in this process is discussed. The work ends with some concluding remarks.
The Emergence And First Evolution of the Asturian Metalworking Cluster, 1939–1985
Prerequisites: The Asturian Metalworking Sector in the Very Long Term
Geographical factors played a significant role in the industrial origins of Asturias. The region’s abundant coal deposits positioned it as a crucial hub in Spain’s industrialization process, further facilitated by its coastal location. In the late eighteenth century, the Royal Ammunition Factory of Trubia and the Royal Arms Factory of Oviedo represented the initial attempts to apply the “English triad” in Spain.Footnote 23 However, the inability to maintain a profitable and stable production based on the use of mineral coal, coupled with the French occupation that halted the operations of the Trubia factory in 1808, ultimately ended this endeavor.Footnote 24
Since the 1840s, once the intensive use of mineral coal was finally established in the country, Asturias became Spain’s leading coal producer. Mining drove nineteenth-century infrastructure development, particularly in the construction of roads and a railway network to connect the interior mining valleys of Langreo and Caudal to the coastal cities of Avilés and Gijón, whose ports were also expanded and adapted to foster industrial growth. Key projects included the Langreo-Gijón road (1842) and railway (1852), later extended to Mieres, Oviedo, and Avilés. This network formed the “Asturian Eight,” which agglomerated most of the region’s industry and population.Footnote 25
The exploitation of coal mines had significant forward linkages for the Asturian productive structure, leading to the creation of diverse metallurgical companies that sought to benefit from the proximity of coal and the associated infrastructure. At the corporate level, this resulted in both progressive processes of birth and growth through the vertical integration of large companies that occupied the steel value chain (coal mining, metallurgy, and finished products) and the creation of smaller establishments working for others in their proximity. Although they undertook various corporate modifications later, some of these early large metallurgical companies included the Asturian Mining Company (1844, later Fábrica de Mieres S.A.) and Sociedad Gil y Cia. (1856), and Sociedad Metalúrgica de Langreo (1857).Footnote 26 Consequently, the advancement in mining and metallurgy boosted the shipbuilding industry. The transition to steam-powered ships, coupled with the intensification of maritime trade in minerals, increased the demand for large vessels, favoring the establishment of industrial shipyards. While traditional shipyards were located in the western end of the region, the new industrial-oriented shipping companies set up in the ports of Gijón and Avilés.Footnote 27
Between the 1860s and 1880s, Asturias led Spain’s metallurgical industry. Still, the adoption of the Bessemer method shifted this leadership to the Basque Country, where high-quality iron ore and a robust Bilbao-Cardiff trade route spurred steel production. This shift enabled local industrial capital growth, exemplified by the founding of Altos Hornos de Vizcaya in 1902, Spain’s leading private steelmaker.Footnote 28 In contrast, Asturias saw limited local industrial initiatives and relied on state and foreign investments, mainly from Belgium, Britain, and France. By the onset of the Spanish Civil War, only two of its six major foundries had national capital: Gil y cía. (1856) and Sociedad Metalúrgica de Langreo (1857).Footnote 29 The loss of national leadership exacerbated this lack of capital accumulation. Nevertheless, foreign investment helped attract machinery, technology, and skilled engineers, supporting the region’s industrial development.Footnote 30
At the beginning of the twentieth century, three major companies led the Asturian landscape: Sociedad Metalúrgica Duro-Felguera S.A. (previously Sociedad Metalúrgica de Langreo), Fábrica de Mieres (the former Asturian Mining Company), and the newly created Sociedad Industrial Asturiana Santa Bárbara (which acquired Fábrica de Moreda y Gijón, created in 1879). As noted, these large foundries operated alongside smaller, less specialized metalworking companies and workshops. In 1916, although Asturias accounted for only 3.5 percent of the country’s population, it ranked fifth among Spanish regions in terms of industrial establishments related to the metallurgical industry, with a total of 49, of which 12 were dedicated to basic metallurgy, 10 to metallic products, 13 to machinery and equipment, and 14 to repairs.Footnote 31
In the turbulent Spanish context of the late nineteenth century, the power amassed by Asturian industrial companies led to sectoral oligopolization, forming a strong lobby advocating for tariff protection alongside Basque steel and Catalan textile businessmen. In the case of Asturias, the achievement of tariff interests and the extraordinary profits generated by the business boom during WWI discouraged investment in competitiveness. As a result, this industry faced a deep crisis at the end of the conflict, prompting companies to seek national protection once again, first under Primo de Rivera’s dictatorship (1923–1930) and later until the outbreak of the civil war.Footnote 32 Due to its industry’s productive structure, Asturias became a potentially strategic industrial pole for the Francoist dictatorship, initiated in 1939. As a result, several heavy industries sheltered by the National Institute of Industry (INI) were established in the region, such as Siasa (1942) for scrap metal manufacturing or Endasa (1949) to produce aluminum. Meanwhile, the Francoist industrial policy favored the creation of new industrial shipyards and the expansion of existing ones.Footnote 33
By that time, the region possessed multiple potential factors for the emergence of a leading metalworking cluster: (1) abundant coal deposits near the coast and an established production structure for its exploitation, (2) an infrastructure network established to serve the regional industry, and (3) a significant industrial agglomeration in the “Asturian Eight.” This triggered the concentration of the population, fostering the offer of both (4) skilled and non-skilled industrial workforce and (5) a growing demand for manufactured Metallic Products driven by urbanization. From a business perspective, significant factors include (6) inter- and intra-sectoral linkages based on Input-Output relationships along the coal and steel value chain, and (6) significant foreign influence in capital, knowledge, and machinery, easily disseminable due to agglomeration and close relationships maintained among companies. Nonetheless, the metalworking industry still exhibited a fragmented productive structure characterized by tiny, non-specialized establishments that resurged from the urgency and provisionality of the post-war landscape.Footnote 34 Given that the shortage of steel was a key industrial bottleneck in early Francoist Spain, all eyes were focused on the start-up of Ensidesa.
Triggering Event: The Birth of Ensidesa, 1950
After the war, the regime’s autarkic ambitions gave rise to an import-substitution model which, combined with the country’s political isolation, plunged Spanish industry into a context of severe scarcity of mineral inputs, foreign currency, capital goods, and significant energy shortages.Footnote 35 Despite being considered strategic for the nation’s reconstruction, the steelmaking industry was also severely affected by these constraints; it stagnated from 1939 to 1948, only reaching its 1929 production levels by 1954, falling short of meeting domestic demand.Footnote 36 This chronic shortage of production was marked by the underutilization of existing facilities throughout the 1940s, giving rise to the so-called “steelmaking problem,” the resolution of which became a matter of utmost urgency for the INI, which could not elicit sufficient response from private producers.Footnote 37
During Primo de Rivera’s dictatorship (1923–1930), private steel companies had made significant investments to increase their capacity, encouraged by public contracts for infrastructure construction. The suspension of those plans, the crisis resulting from the Great Depression, and the political and economic situation after the Spanish Civil War caused businessmen to distrust the national consumption forecasts expressed by the Francoist regime. In addition, AHV’s acquisition of Compañía Siderúrgica del Mediterráneo in 1940 gave the Basque company a virtual monopoly on national steel production, tremendously increasing its bargaining power in an already heavily oligopolized sector.Footnote 38 Moreover, Juan Antonio Suanzes, Minister of Industry and President of the INI, believed that the productive structure of the Spanish steel industry was fundamentally flawed: most plants were small in scale, poorly located, and overly dependent on foreign inputs. For all that, he did not believe that simply expanding the existing facilities would be enough to solve Spain’s steelmaking problem.Footnote 39
As a result, Suanzes decided to create a national champion in 1950 to significantly increase steel production and supply the domestic market without reducing tariffs and responding to the regime’s urgencies. Initially, the creation of a mixed enterprise was considered, and 35 percent of the capital was offered to private steelmaking companies. Nevertheless, none participated in the operation. Businessmen preferred a regulated market similar to the one designed by Primo de Rivera in the 1920s, where the State acted as a financier and demander, not as a producer.Footnote 40 As they conveyed to the INI, their financial capacity would not allow them to undertake such an investment, as they had to finance the expansion of their own facilities, and they doubted the project’s profitability in the short term. Moreover, the steel consumption forecasts underpinning the creation of the new company seemed unrealistic to them, and contrary to Suanzes’s position, they stated that such demand could eventually be met through the expansion of existing plants.Footnote 41 Given their refusal to participate in the capital of this new company, the Empresa Nacional Siderúrgica S.A. (Ensidesa) was created in 1950 with an initial capital of 1,000 million pesetas fully subscribed by the INI, which was increased to 12,000 million by 1958.Footnote 42
From a geographical standpoint, the classic European model for locating steel facilities had concentrated fully integrated steel mills in inland areas, prioritizing proximity to primary inputs (coal, iron, etc.). However, since the end of WWII, the Japanese model prevailed, based on electric steel mills located in coastal regions. This model, which found its pinnacle in Europe with the implementation of the Sinigaglia Plan in Italy, brought steel production closer to the market and favored the utilization of inputs from abroad.Footnote 43 Asturias combined the defining factors of both. Specifically, Avilés allowed the plant to be situated near its estuary and industrial port, directly connected by train to the coalfields of the region’s interior.Footnote 44 This situation facilitated the domestic supply of raw materials in the early years and the importation of coal (from the United States, Poland, or Germany) and iron (from Morocco, Mauritania, or Sweden) once the production growth made it necessary, coinciding with the progressive opening of the Spanish economy in the 1960s. Ensidesa began operations in 1957, and three years later, it produced almost 60 percent of the national pig iron production and 35 percent and 25 percent of finished steel and rolled products, respectively, in Avilés.Footnote 45
The lighting of Ensidesa’s first blast furnace marked a turning point in the Spanish industrial landscape. Between 1950 and 1961, steel production tripled—both due to Ensidesa’s growing direct contribution and because its creation spurred investment by private companies, which always kept tensions with the INI and the national champion. Despite this, domestic demand for steel would not begin to stabilize until the market was liberalized in 1963.Footnote 46 After the severe constraints imposed by the postwar autarky of the 1940s and the gradual yet still incipient steps toward economic openness in the 1950s, the second Francoist period—initiated with the 1959 Stabilization Plan—opened the phase of Spain’s most significant relative industrial growth. During the so-called “developmental Francoism” (1960–1975), Spain experienced a rapid convergence with the leading European industrial economies, partly driven by the lag accumulated over the preceding two decades. One of the primary drivers of this industrial expansion was the metalworking sector, fueled by the rise of the automobile industry and the production of domestic appliances. However, neither of these activities had a significant weight in the Asturian industrial structure, where the large, strategic industries directly promoted by the INI and the Development Plans (1964–1967, 1968–1971, and 1972–1975)—steel, mining, and shipbuilding—continued to dominate.Footnote 47
Self-Augmenting Processes: The Metalworking Sector in Asturias From Ensidesa to Industrial Restructuring, 1958–1985
In Asturias, Ensidesa’s impact extended far beyond alleviating the bottlenecks created by autarkic policies. Within its operational context, the company generated positive externalities—workforce development, infrastructure, technical training, interaction with foreign firms—that stimulated reinforcing dynamics in the metalworking sector due to geographical concentration and strong industrial interconnections.
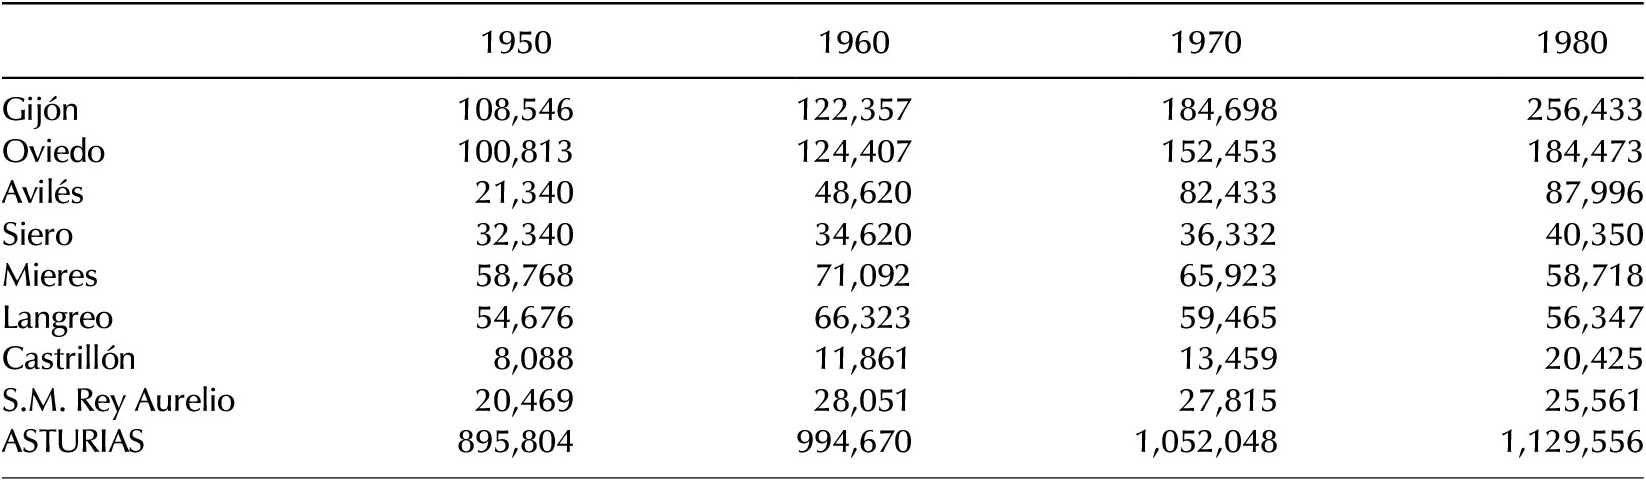
One of the most notable consequences of Ensidesa’s creation was its demographic impact, supported by the paternalistic policy of Francoist developmentalism (Table 1). The creation and development of large industries offset the rural exodus of the 1960s, which in Asturias was further intensified by the mining crisis. The region’s total population rose from 895,804 in 1950 to 1,129,556 in 1981, reaching its historical peak and finally consolidating the current “Asturian Eight.” The industrial development linked to the steel industry led to rapid population growth in cities where this activity was located (Avilés, Gijón) and in the adjacent municipalities. At the same time, the mining municipalities of Langreo and Mieres, which had been the main poles of attraction for migrants in previous decades, were now relegated to a secondary position.
Population evolution in the main Asturian municipalities, 1950–1980

Note: 1980 data correspond to the 1981 census.
Source: SADEI, historical census.
Although Spain did not benefit from the Marshall Plan, signing the Madrid Agreements between the Franco regime and the United States in 1953 facilitated the creation of Ensidesa. A specially agreed-upon line of financing covered one-third of the initial investment. Additionally, the signing of this pact (which preceded the 1959 Stabilization Plan in opening the country to foreign trade) eased the direct involvement of foreign companies in the construction of the new factory. Thus, American and German companies led the initial phases of constructing the Avilés steel mill.Footnote 48 Part of these contributions was based on bilateral agreements, which, for example, involved exporting minerals and raw materials obtained from mines owned by Ensidesa as payment for the shipment of machinery and components for the Avilés plant until it became operational. Other agreements directly entailed opening credit lines for purchasing machinery and equipment intended for Ensidesa and its subsidiaries.Footnote 49
Foreign firms handled the main construction of the new plant, while Spanish and Asturian companies were tasked with manufacturing and installing machinery and equipment. Ensidesa’s technical team oversaw the coordination and acted as a mediator among all parties. However, interactions with foreign entities extended beyond equipment shipments. Engineers from Ensidesa and technicians from local metalworking concessionary companies visited facilities abroad to monitor component production and receive process training. Foreign firms sent personnel to Avilés to oversee equipment installation, while Ensidesa’s machinery procurement and collaborations with foreign technicians extended to other ventures throughout Asturias, fostering knowledge and technology transfer. Thus, the need for auxiliary services spurred a network of collaborations among local companies and subcontractors, enhancing specialization. In 1956, the Avilés plant employed 18,137 workers, with 5,500 company staff and the remainder from subcontractors.Footnote 50
The significant infrastructural development accompanying the plant’s construction was equally crucial for the metalworking network. In addition to the infrastructure directly intended for the company’s activities, the “Asturian Eight” was finally structured thanks to a series of extensive civil works that accompanied the creation of Ensidesa.Footnote 51 Some examples were the successive port expansions of Avilés and Gijón to serve the thriving manufacturing industry, the opening of different commuter rail lines and branches connected to Ensidesa’s internal line between Avilés and Gijón, and the Avilés-Oviedo-Gijón highway.Footnote 52
These civil works also extended to education, as technical training became a central issue once migratory flows laid the foundation for a broad supply of labor. The creation of Ensidesa transformed Asturias into a reference hub for developing the Francoist model of technical education, legislated by the Organic Law of Industrial Training of 1955, aimed to create a technically skilled and ideologically aligned workforce through a system that combined state-sponsored institutions with on-the-job instruction. As a result, the Ensidesa Apprentice School and the Avilés School of Industrial Mastery were founded just a year later. However, the most important work of the regime in this regard was the Labor University of Gijón, created in 1956 with 800 boarders and 500 ordinary students, and which still houses the Polytechnic Campus of the University of Oviedo.Footnote 53
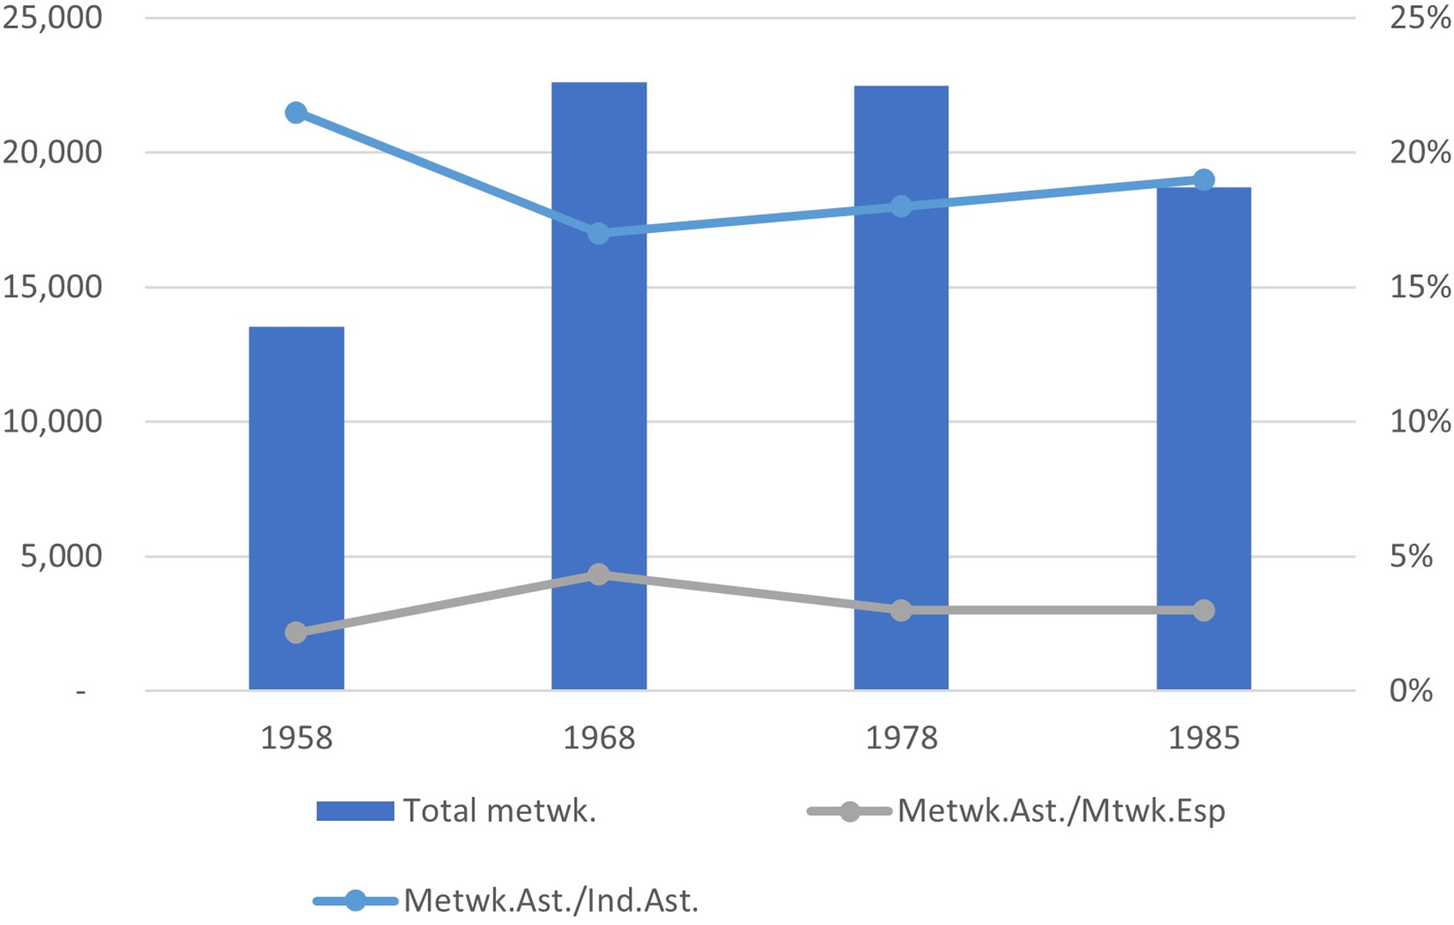
Benefiting from all these externalities, the Asturian metalworking sector took off during the late 1950s in the shadow of the national champion (Figure 1). The sharp overall growth in industrial employment overshadowed its relative weight. Nevertheless, despite the impact of the 1970s industrial crisis and the subsequent restructuring plan of 1984, its share of total employment continued to increase, becoming the regional benchmark from that moment onwards and maintaining regional specialization above the national average.Footnote 54
Metalworking employment evolution in Asturias, 1958–1985.
Source: Own elaboration with SADEI, Input-Output; INE, Spanish Industrial Census, 1958. The total number of employees is in the bars and on the left axis. The percentage results are in lines and on the right axis.

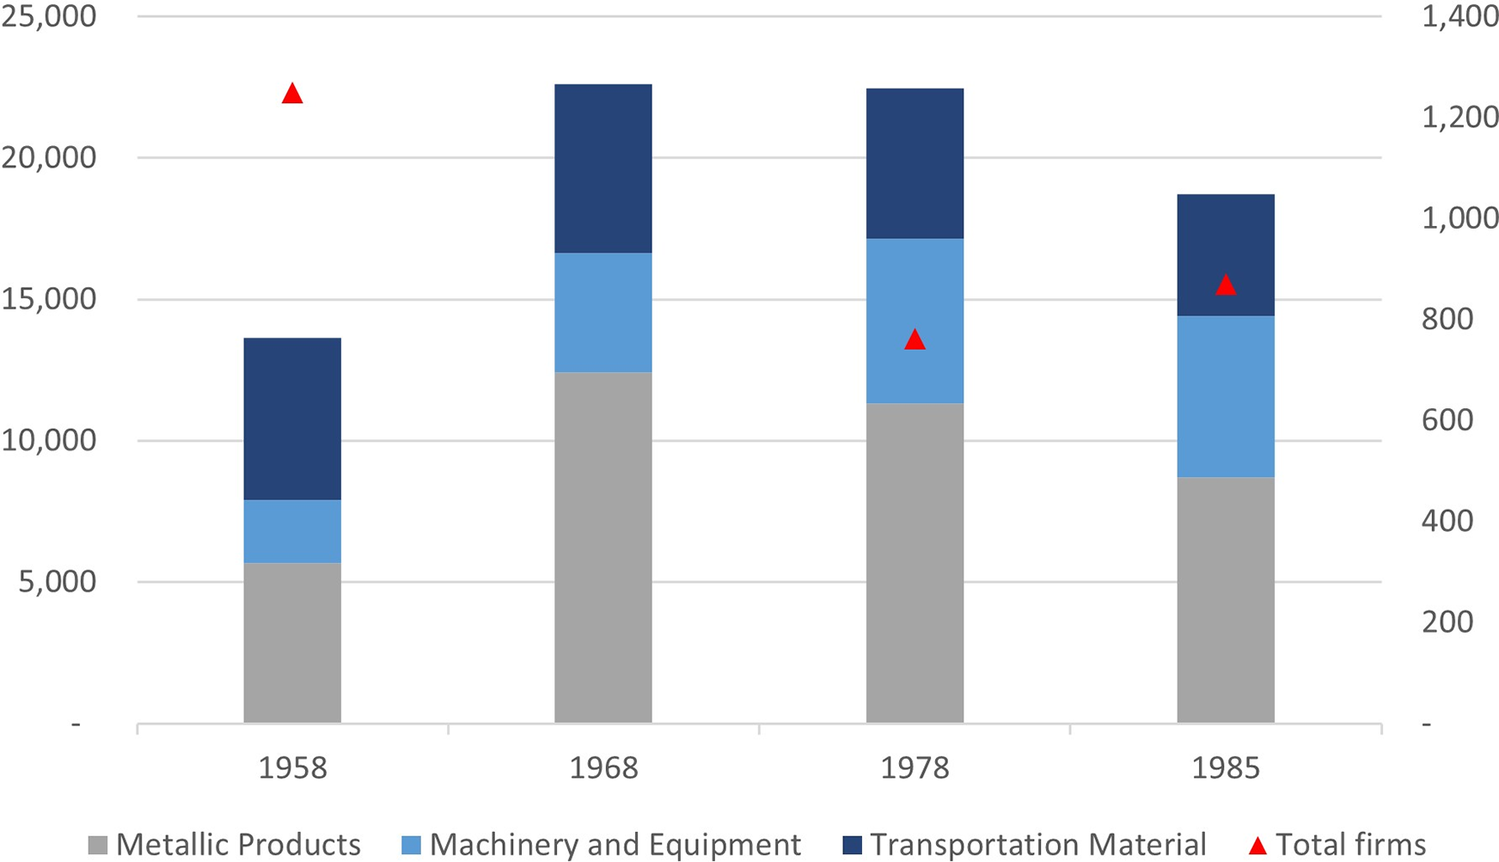
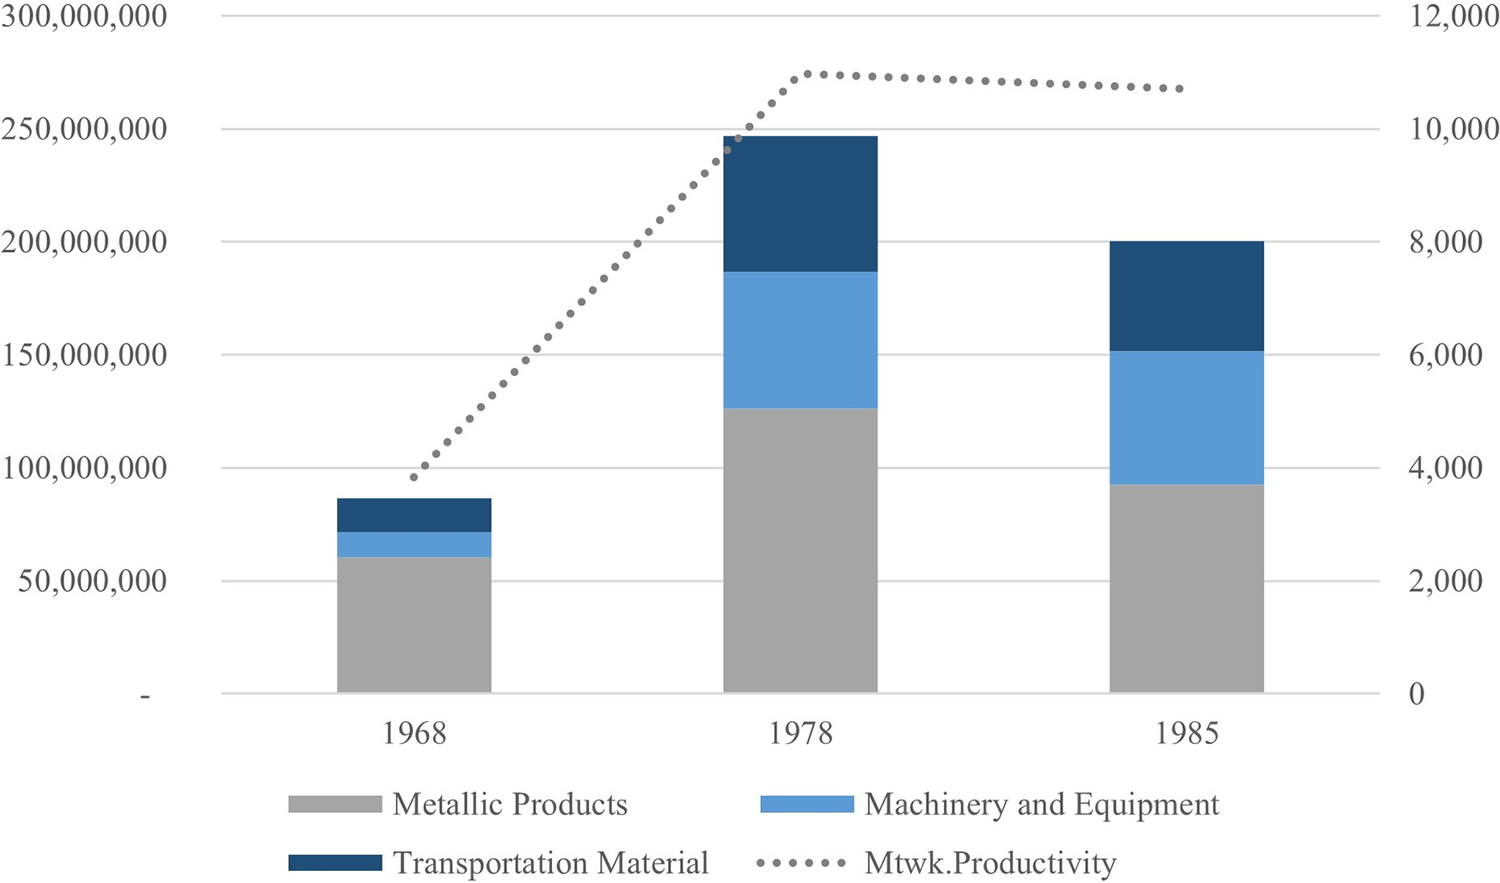
Broken down by activity branches, the notable weight of Metallic Products is consistent with the existence of comprehensive steelmaking facilities, as this segment is the closest to primary manufacturing and constitutes the lowest value-added part of the steel production chain (Figure 2). Transportation Material mostly responded to the evolution of shipbuilding, which followed a similar path to steelmaking. It experienced significant growth during the Francoist period but later faced the adjustments of industrial restructuring, particularly affecting large public and private shipyards.
Evolution of Asturian metalworking employment by branches and total firms, 1958–1985.
Source: Own elaboration with SADEI, Input-Output; INE, Spanish Industrial Census, 1958. The total number of employees is in the bars and on the left axis. The total number of firms is in triangles and on the right axis. There is no consistent data available on the number of firms for 1968.

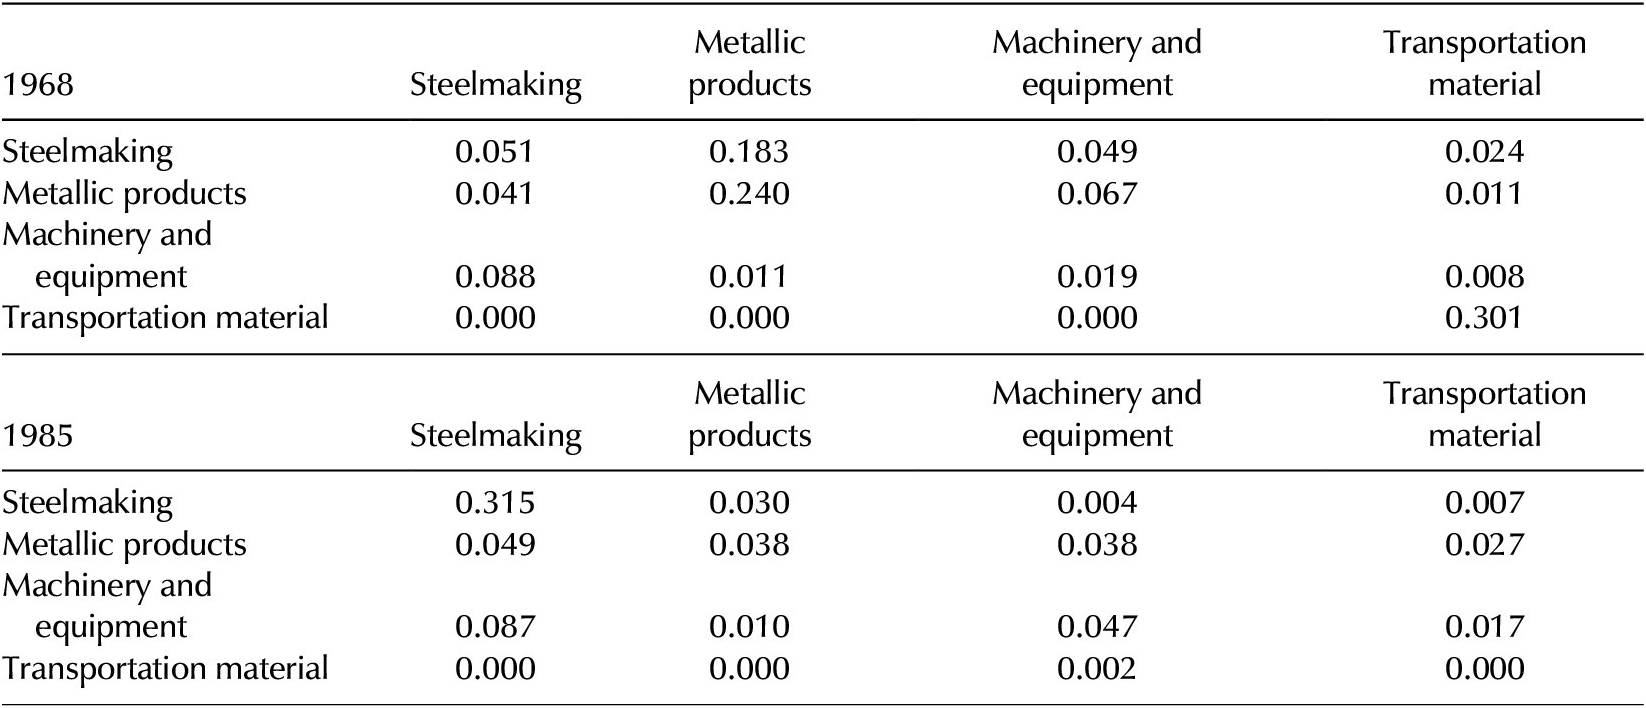
In this context, it is worth noting the advancement of Machinery and Equipment, whose relative weight in the total sector increased by more than ten percentage points, reaching 30 percent in the last year studied. This segment’s growth represents the dynamism brewing within the sector, as manufacturing machinery and capital goods are the backbone of industrial development. Overall, the results are consistent with the interrelations shown in Table 2, and together, they demonstrate the progressive consolidation of the productive branch that generates more added value, growing in the face of the contraction of more traditional activities.
Regional technical coefficients of steelmaking and the metalworking subsectors, 1968 and 1985

Source: Own elaboration with data from SADEI, Input-Output tables. Vertically, the demand that branch j makes of branch i for the production of one unit. Horizontally, the sales of branch i to branch j for the production of one unit. Years at the extremes based on data availability.
This scenario aligns with progress in terms of production and productivity. The sustained increase in both variables during the years of developmentalism was halted by the 1980s adjustments (Figure 3). However, the activity of Machinery and Equipment barely changed in the last period, with the aggregate falling due to the contraction of Metallic Products and Shipbuilding. The onset of deindustrialization fundamentally affected these two subsectors, more closely linked to basic industry, while machinery and capital goods maintained the apparent total labor productivity.
Evolution of Asturian metalworking production broken down by branches, 1968–1985.
Source: Own elaboration with SADEI, Input-Output. 2010 constant pesetas(k). No data is available for 1958. Productivity is based on total production, as there is no data on added value for 1968. On the left axis, total production value. On the right axis, labor productivity, measured as the annual value produced per worker.

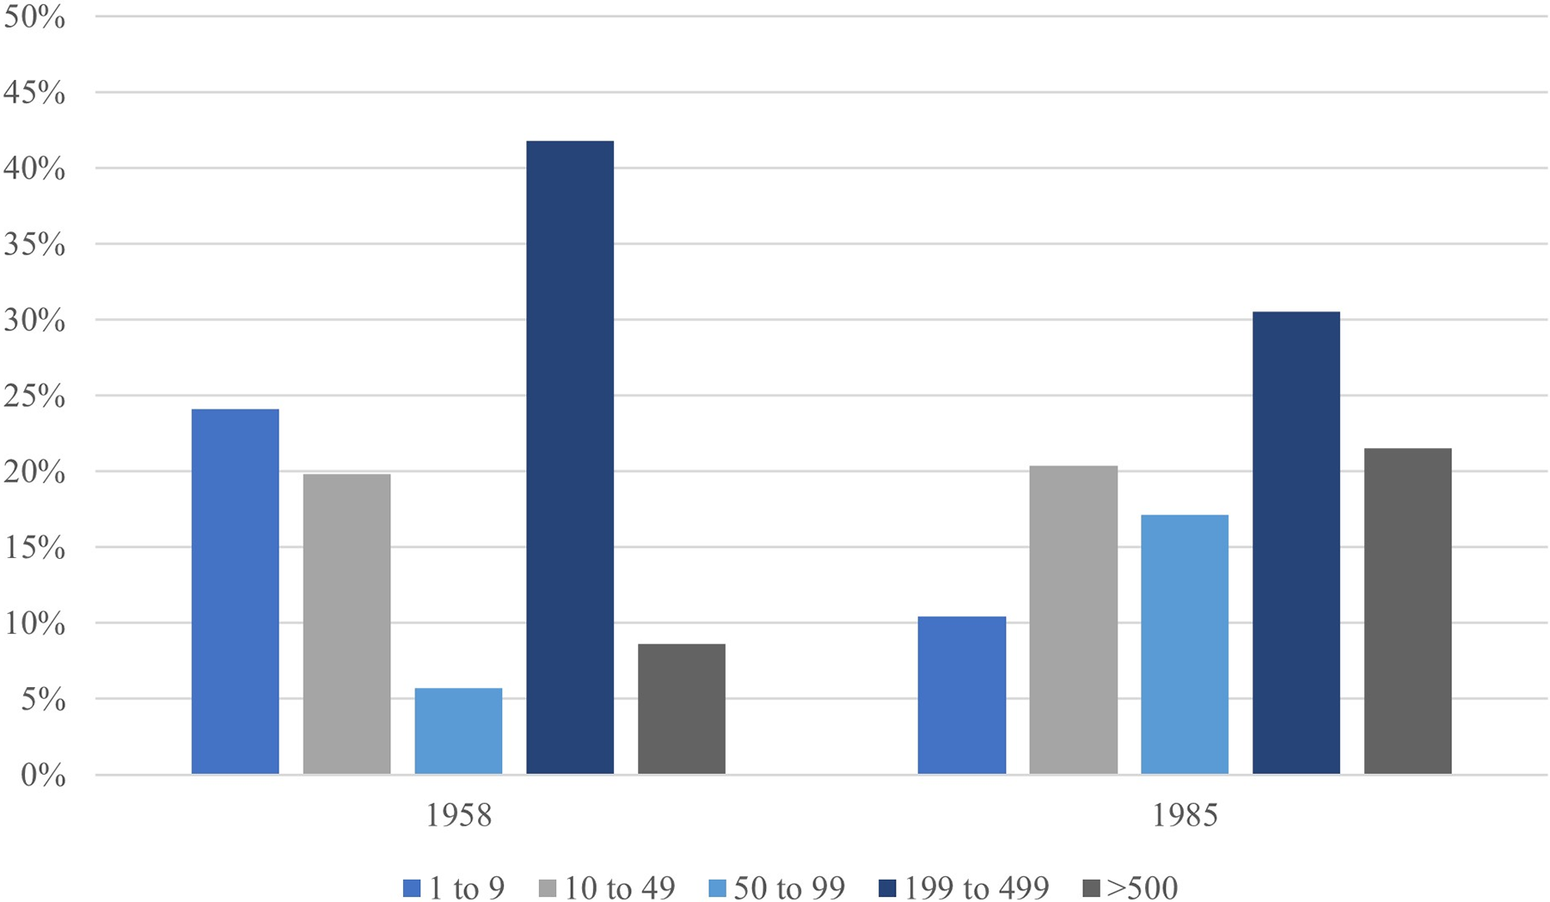
Sectoral growth accompanied a reconfiguration of its internal structure, and these years witnessed the birth and consolidation of a series of companies that would lead the activity by the end of the century. The sector transitioned from being characterized either by tiny workshops or large oligopolistic companies to concentrating employment in medium and medium-large firms (Figure 4). As a result, the average size of metalworking companies tripled during the period studied, going from 7.57 employees per company in 1958 to 21.26 in 1985.
Distribution of metalworking employment in Asturias by firm size, 1958–1984.
Source: Own elaboration with SADEI, Input-Output.

Throughout the period, Metallic Products continued to concentrate a significant portion of its employment in small, low-skilled workplaces. On the other hand, large shipyards such as Juliana Constructora Gijonesa S.A. or Duro Felguera employed over 500 workers in shipbuilding. After the crisis, many of them faced closure or restructuring, which, in most cases, proved unviable in the long term, resulting in the shift of leadership to medium-sized shipyards located in the region’s western end.Footnote 55 Machinery and Equipment represented the significant weight gained by companies with 50 to 500 employees. These medium- to large-sized companies played a leading role in the region after the industrial restructuring, somewhat assuming the role Ensidesa once held.Footnote 56
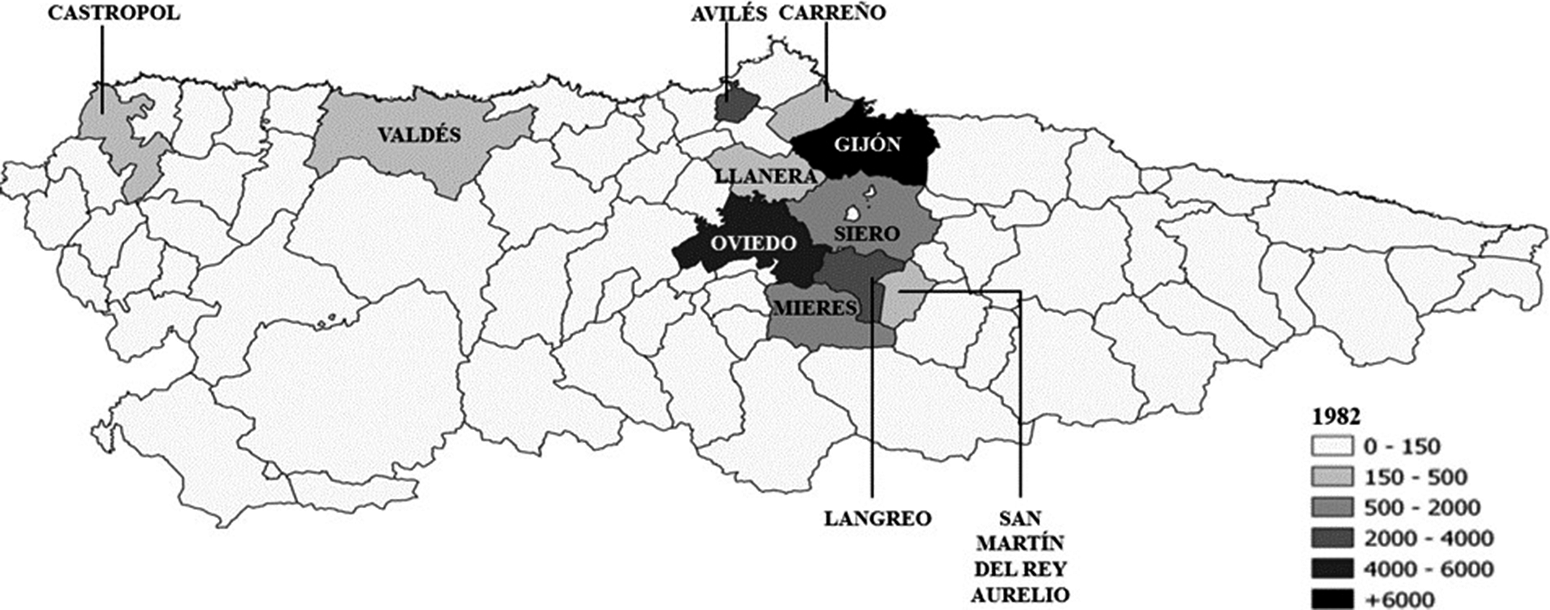
Agglomeration dynamics reinforce the notion of a sector that ultimately developed, boosted by the location advantages generated by the state-owned steelmaking giant. The spatial distribution of metalworking activity at the onset of industrial restructuring showed a clear concentration in the “Asturian Eight,” structured around the traditional coal basins of Langreo and Mieres, as well as the port cities of Avilés and Gijón, headquarters of Ensidesa (Figure 5).Footnote 57 To these, we must add Oviedo, influenced by the capital city effect and by the presence of the Empresa Nacional Santa Bárbara, one of the most prominent firms in the Spanish military industry.
Distribution of metalworking employment in Asturias by municipalities, 1985.
Source: Antuña, “Un paso,” 136.

Nevertheless, this agglomeration does not explain the interrelation between the metalworking and steelmaking industries by itself, as almost 70 percent of the regional population was concentrated in the area, and thus growth was influenced by endogenous variables. The Input-Output tables enable the calculation of regional technical coefficients for these industries, which measure the degree of interrelation between different branches based on commercial flows.Footnote 58 The regional coefficients for the years 1968 and 1985, which represent the highest level of industrial interconnection when energy inputs are excluded, reveal two distinct moments for the metalworking sector in Asturias (Table 2). Despite remaining the starting point of the value chain, the fall in demand for steel from all branches shows the industry’s retreat in the prelude to restructuring and the effects of the first adjustments. This, combined with forward integration in steel production to include more semi-finished products, explains the significant increase in its reuses. The evolution of Metallic Products reflects the gradual decline in its importance within the Asturian industrial economy, as is the case with Transportation Material, which was also already immersed in the adjustment process. On the contrary, Machinery and Equipment was the only branch that expanded its activity within the network, maintaining its supply to other sectors and increasing its reuses. The increase in intrasectoral relationships explains this, as different company branches collaborated and acted as suppliers and clients.
A Non-Strategic Sector and the Indirect Role of the Francoist Industrial Policy
Following the results presented so far, it is evident that the State’s role in Asturias’s industrial development was significant. However, it is also observable that all direct interventions identified to date are related to the establishment of Ensidesa in the region or to the development of other industries considered strategic by the regime. Due to its importance as a technological catalyst, it would be reasonable to consider the metalworking sector as part of this group. Developing a robust and diversified metalworking industry became a priority for Western industrial powers during the period under analysis.Footnote 59 Nonetheless, in the organization of Spanish post-war industrial policy, the role of the metalworking industry was marginal, as the regime focused its attention on basic sectors such as steelmaking, chemistry, or mining.Footnote 60 As was noted before, over the decades and following the country’s gradual opening that started with the Stabilization Plan of 1959, the importance attributed to this sector was almost exclusively concentrated in domestic appliances and the automobile industry, with the latter centering the attraction of foreign capital and the creation of supplying companies.Footnote 61
Francoist intervention in industrial development dates back to the Law for the Organization and Defense of the National Industry (21/11/1939), which regulated the creation of new industrial companies, the expansion of their production, the increase of machinery, or the change of activity.Footnote 62 The severity of this regulatory framework, along with the discretionary nature of its enforcement, represented a significant obstacle to business activity. The power held by high-ranking state officials often led to the dominance of state interests over those of most private firms, while also fostering nepotism in specific industries aligned with the regime’s strategic interests. Despite a brief and limited liberalization in the early 1960s, strict controls over the opening and expansion of industrial establishments persisted essentially unchanged until the end of the dictatorship.Footnote 63 In Asturias, this resulted in widespread tensions between private companies and the regime—tensions that were particularly acute in the metalworking sector due to the secondary role assigned to this activity within the regime’s industrial priorities. The scarcity of raw materials, the arbitrariness in the allocation of quotas, and the restrictions on acquiring capital goods severely undermined the viability of new investments.
All of this makes it even more remarkable that the identification of this sector’s potential in Asturias preceded the creation of Ensidesa. In 1941, a report from the Provincial Delegation to the Ministry of Industry detailed the conditions of metalworking manufacturers in Asturias. Faced with the National Syndicate’s refusal to approve La Felguera Industrial’s addition of welded iron tube manufacturing to screw manufacturing, engineer Jesús Canga argued that the mining industry, which produced 75 percent of the national total, was barely able to supply itself with these goods, fundamental for the development of its activity.Footnote 64 The defense of Jesús Canga and the Provincial Delegation was based fundamentally on two arguments that he extrapolated to the entire sector. The first was the modest capacity of this new plant; precisely due to its small size, it would not require a large quantity of inputs. The second argument was the possibility of exploiting agglomeration economies in the Nalón Valley. The new plant would be located near Duro Felguera—one of the largest metallurgical companies—and the coal mines, thereby reducing transportation costs.Footnote 65
The importance granted to coal mining as a generator of value chains contrasted with the precarious level of professionalization and technical development of the Asturian mining sector at that time. As indicated in the cited report:
The life of the coal mines in Asturias […] was always quite precarious, leading to a normal economic situation of poverty, which did not allow for the development of transformation industries, finding it necessary to export 85 to 90% of its production to the rest of Spain, with its main markets being the Mediterranean coast and the Basque provinces.Footnote 66
The Provincial Delegation quickly identified the need to develop the metalworking industry, ensuring that basic sectors, such as steel and coal mining, could find sufficient regional demand for their production. Just as with mining, the Provincial Delegation appealed to the Ministry to directly promote the metalworking industry in Asturias to support the development of regional steelmaking, given the lack of incentives for Asturian companies to increase their production:
The only industry of importance from the coal point of view that was established in Asturias from old times was the steel industry, with its three factories Duro Felguera, Fábrica de Mieres, and Moreda y Gijón, to which we can add the Military Factories of Trubia and Oviedo. The first three generally had a languid life […] mainly due to the lack of transformation industries in their vicinity because, just like the coal industry, they are forced to export their products to the Mediterranean.
Finally, delegate Jesús Canga defended Asturias’s potential to become a leading metalworking hub for the rest of the country, warning the central government that the region had significant locational advantages. In his concluding arguments, Canga alleged that:
[…] any new iron transformation industry has its best location in Asturias because it produces iron, coal, and electric power, the latter produced by its waterfalls and thermal power stations at the coal mine entrance […] For all the reasons stated, we consider that not only should all kinds of metallurgical transformation industries in this region be authorized in general, but they should also be encouraged, giving them the maximum facilities.
Madrid did not meet the Provincial Delegation’s demands. The scarcity of raw materials in autarchic Spain hindered the proliferation of new companies and restricted the growth capacity of the existing ones, a fact that was compounded by the arbitrariness and preference of INI industries in allocating input quotas.Footnote 67 Although imports of primary goods increased significantly during the 1950s, the Yearbooks of the Higher Council of Industry repeatedly emphasized the scourge that the scarcity of raw materials and primary inputs posed for the national industry, identifying it as the main problem for its development.Footnote 68
In the Asturian case, the metalworking industry severely suffered from the internal contradictions of Francoist industrial policy and its governmental bodies. Thus, while there was an institutional push for sectoral concentration in large strategic companies, access to the scarce primary inputs available was restricted. This situation generated conceptual tension in the Francoist industrial policy itself. On the one side, it hindered the creation of new small firms, which consumed few resources but contradicted the productive logic of the regime due to their limited production capacity. On the other hand, it limited larger companies’ growth and capacity to generate internal economies of scale by restricting their access to primary goods, as their requirements were significantly higher than those of minor establishments.
As a result, many requests related to establishing small metalworking businesses were sent to the “free market” for raw materials, effectively invalidating them or diverting them to the underground economy.Footnote 69 Others, made by larger companies to expand their capacity, were accepted as long as they did not involve an increase in their quotas for raw materials.Footnote 70 The arduous and arbitrary access to quotas ultimately served as an entry barrier, complementing the high initial investment required in particular market niches and the bargaining power of larger, already established companies. However, these firms’ competitive logic also reflected the contradictions of the autarchic model. After the publication of a company’s request to expand its productive capacity, the objections from its competitors usually focused on the claim that there was already sufficient productive capacity in the market, underutilized due to access to raw materials. Subsequently, it is common to find later requests from these same companies seeking an increase in their production capacity.Footnote 71
Following this, at the end of the 1950s, the Asturian metalworking industry found itself in a situation relatively similar to the one described in the previous decade, reflecting an archaic and precarious structure. The mismatches in the supply of resources were continuous. The bottlenecks for coal, which Jesús Canga had referred to more than a decade earlier, remained. In 1954, 80–90 percent of the coal intended for consumption by the regional metalworking industry was not being used, as the transformation industries could not find a market for their production. Equally, access to metal quotas remained very restricted: it was estimated that in 1954, the transformation industry had only received 45 percent of its theoretical needs.Footnote 72
In this context, all hopes were pinned on Ensidesa’s progress. The rest of the regional steel companies looked at it suspiciously, but its implementation constituted the main incentive for creating or expanding metalworking industries in the region. This sentiment was expressed in 1952 by naval engineer José R. Camps-Santamarina on behalf of Construcciones y Reparaciones Marítimas S.A. when requesting an expansion of their mechanical workshops in Avilés:
The creation in Avilés by the National Institute of Industry of the great Nacional Siderúrgica, the Empresa Nacional de Aluminia (Endasa), the Asturian Steelworks, and the new chemical industry with 1.5 billion in capital under study by the INI, as well as the creation of Cristalería Española and other private industries established here, are completely transforming the appearance of the town […] The increase in the production of irons and steels indicated by official statistics, and the performance that we will soon have with the launch of the Nacional Siderúrgica, are factors that necessitate the expansion of the existing steel and metalworking industries.Footnote 73
The potential for establishing a solid value chain around steel was not only identified by metalworking companies.Footnote 74 In 1957, the Provincial Delegation submitted a report to the General Directorate of Industry detailing the precarious situation of the Asturian metalworking industry. The document describes a fragmented productive structure, very similar to the one outlined by Canga in 1941. A large part of the metal manufacturing establishments in the region originated from the urgency and provisionality of the post-war period, so they were tiny and presented a very low level of specialization. The report continued to present Asturias as a region with tremendous metalworking potential, as it possessed, alongside the steel industry, important sources of coal and metallic minerals and was also one of the country’s leading electricity producers. For all these reasons, the Provincial Delegation noted that:
[…] the new industrial plants should be backed by capitals capable of acquiring and sustaining modern and efficient production elements, and of making possible technical assistance from specialized firms […]. This is tantamount to advocating for the establishment of significant plants, which should also have a generous cadre of specialized technicians and workers, or the assistance of guaranteed firms.Footnote 75
To reverse this situation, the inevitable participation of the State, which controlled and directed the country’s industrial activity, was required. In the same report, and as suggested by the previous paragraph, an appeal was made to the Ministry of Industry not only to favor the metalworking business but also to extrapolate the conditions of such a request to the bulk of the sector in the region. Thus, it was considered that:
The fruits of the State’s intervention in the industrialization of Spain, stimulating, guiding, and channeling the establishment of new industrial plants […] constitute a flattering harvest for the country. But these same applications, applied to a specific province (Asturias) and a particular type of industry (metalworking), can change, for the better, the landscape of the iron and metal transformation industries.
Once again, the Ministry did not meet these demands. While the strategic industries concentrated the bulk of the available resources, Asturian metalworking companies did not receive direct incentives from the INI, nor were they favored by external agreements. The Pacts of Madrid (1953) allowed companies to negotiate the import of foreign machinery under bilateral agreements. Nonetheless, the regime’s control continued to introduce profound contradictions in these operations. For example, it could deny the supply of second-hand machinery—when it was the only one offered by a foreign company—and then reject the acquisition of new machinery because of currency conflicts or because it was claimed that it could be acquired in Spain, even when no national firm presented a project to manufacture it.Footnote 76
A decade later, and once more, the Provincial Delegation presented a “suggestion” to the Ministry of Industry to develop a metalworking hub in the region, highlighting “the importance for the national economy of creating a robust manufacturing industry in Asturias.” The Delegation pointed out the availability of raw materials, the development of infrastructure, and the presence of highly qualified personnel in the sector. Consequently, it was contended that “at present, this industry, although significant, does not reach its full potential, and a substantial portion of our basic productions are exported in their raw form only to be processed elsewhere.”Footnote 77 Once again, the requests were not addressed.
Although the primary source for this work ended in 1960, we can continue to follow Francoist intervention in the Asturian industry through the implementation of the so-called Development Plans (1964–1967, 1970–1972). These plans shaped the above-mentioned “developmental Francoism” (1960–1975), during which the regime adopted a more planning-oriented rather than interventionist role, with a technocratic profile and support from supranational institutions such as the World Bank and the IMF. Their aim was not only to foster national economic growth, but also to promote regional development. To this end, the regime introduced the Industrial Promotion Poles in the most deindustrialized regions, followed by the Industrial Development Poles to consolidate industrial take-off in those areas.Footnote 78
Thus, Article 6 of the Law of 28/12/1963 stated that “The action of the State in favor of raising the standard of living in regions or economic areas with low income per inhabitant will be carried out by promoting their industrialization, agricultural improvement, and modernization of services.” Similarly, the preamble of the Decree of 30/01/1964, noted that the promotion poles “will be located in populations where there is no industry” but which have resources for their potential development, while the Industrial Development Poles “are those located in populations that, having a considerable industrial activity, cannot be compared with the industrialized areas of the country.”
Asturias did not become part of Development Plan I. The region joined Plan II through the Oviedo Development Pole, as outlined in the Government Presidency Decree 240/1969 of February 21, which extended the first plans and defined the areas affected by Pole II. The geographical limits of the action were confined to the above-mentioned “Asturian Eight” and aimed to diversify the Asturian economy, which, as shown, was highly specialized in basic industries such as mining or steelmaking. The intervention offered a series of incentives for the location of private companies in the affected area, including the possibility of compulsory expropriation of land, non-repayable grants of up to 10 percent of the total investment, preference in obtaining official credits, and various reductions and tax exemptions. At the aggregate level, the results of the Oviedo Development Pole have been interpreted as positive. Between 1971 and 1983, 19,139 jobs were created, exceeding the target figure of 17,500, with a total investment of nearly 134,000 million pesetas. However, the plan did not directly favor the metalworking sector. It was included within a framework of allocation based on competitive bidding along with 29 other activities, so there was no strategic logic to promote this concrete activity.Footnote 79
Despite this, the metalworking industry was the most successful, representing 27.6 percent of the total investment granted and 64.4 percent of the total employment generated. As with its expansion in previous decades, this leadership resulted primarily from a market-driven logic, where the most competitive activities secured a larger share of available aid. Consequently, the sector’s success in attracting investment within the Oviedo Development Pole stemmed from its ability to naturally benefit from a broad aid program intended for diverse industries, rather than a targeted industrial strategy.
This leadership was the unintended result of a market-oriented logic in which those already more competitive activities could capture a larger share of the aid granted. Thus, the sector’s success in attracting investments within the framework of the Oviedo Development Pole was due to its capacity to organically benefit from a plan intended for a diverse range of activities, rather than to a clear industrial strategy aimed at directly promoting it. This is consistent with what happened during the industrial restructuring in the following decades, when the regional industrial policy was oriented toward restructuring declining sectors, while the metalworking sector led the financing plans based on a competitive logic.Footnote 80
Concluding Remarks
Despite the growing importance of cluster studies in recent decades, a significant lack of knowledge remains regarding how these ecosystems originate and the comprehension of how emergence works as a process.Footnote 81 Moreover, cluster-oriented policies stand out as one of the most important factors in creating these ecosystems, as well as in promoting those already in existence.Footnote 82 However, little research has been conducted on the indirect role that public policies may play in their initial organic conformation. This paper contributes to this gap by analyzing the emergence of the metalworking cluster in Asturias from the end of the civil war to the industrial restructuring, delving into the influence of the Francoist regime’s industrial policy on this process.
At the end of the war, and due to its mining and metallurgical tradition dating back to the late eighteenth century, Asturias presented many prerequisites for the potential emergence of a metalworking cluster. Nonetheless, the constraints and contradictions generated by Franco’s autarchic industrial policy did not allow this potential to be uncovered, even when State bodies in the region were clamoring for direct incentives for this industry. The creation of the public steelmaking champion Ensidesa in 1950 represented the triggering event that finally broke this bottleneck. From the market perspective and at the country level, the company supplied the steel necessary for the national industry to finally take off. Still, the paper demonstrates that its influence at the regional level was even more profound. In its operative environment, Ensidesa generated a series of positive externalities (labor pool, infrastructures, technical training, etc.) that boosted the appearance of self-reinforcing dynamics for the metalworking sector, favored by its geographical agglomeration and the close interconnection between industries. From the late 1950s onward, Ensidesa fostered the emergence of a hierarchical cluster in which metalworking firms grew during the following decades. This ecosystem was led by increasingly interrelated medium-sized companies dedicated to manufacturing machinery and capital goods. These firms, which exhibited the highest level of specialization, finally became the regional leaders after the decline of Ensidesa and the rest of the traditional industries, resulting from the 1980s industrial restructuring.
Although the Francoist industrial policy guided the creation of Ensidesa, developing a robust and dynamic metalworking hub in Asturias was not on the regimen’s agenda. The Ministry of Industry never directly promoted this activity, even when the Provincial Delegation of Industry had already revealed its potential by 1941. While resources were concentrated in heavy industries, the sector was relegated to the background during the autarchy, as it was not considered a strategic priority for national interest. This situation was not reversed during the 1960s–1970s, the country’s gradual opening. The concerted policy characteristic of “developmental Francoism” continued to lack ad hoc plans for the metalworking sector in Asturias. Despite its recognized potential, the Development Pole of Oviedo did not grant it preferential status, forcing it to compete for funding alongside numerous activities of diverse nature. The sector remained far from receiving the incentives conceded to strategic industries and lacked clear growth guidelines defined by industrial policy. Nevertheless, metalworking firms could benefit from this competitive environment, attracting relatively significant investments and generating the highest number of viable projects within this context, but only due to their growing dynamism and competitiveness.
This paper demonstrates that industrial policy played a crucial—though indirect—role in the emergence of the now-prominent Asturian metalworking cluster. This reinforces the importance of analyzing the long-term effects of industrial policy’s externalities, and the value of historical approaches for informing decision-making, particularly in the context of Europe’s current reindustrialization.Footnote 83 The Francoist regime systematically ignored calls for direct support to these transformative industries and concentrated the bulk of its interventions in sectors that it considered strategic. This decision created structural asymmetries that weakened Asturias’ position in the face of industrial restructuring due to its relatively high traditional specialization. From an evolutionary standpoint, this illustrates the role of institutional agency in the deliberate concentration of specific resources in particular territories, which may help explain the uneven regional impact of deindustrialization across Europe.Footnote 84
Such an approach opens new avenues for the study of territorial inequality, shifting the focus from regional productive specialization as a static outcome to the historical causes behind it, and the capabilities that emerged over time. It also allows us to revisit the notion of lock-in, not merely as a constraint, but as a mechanism through which regions can endogenously develop new capacities that eventually support path creation and the emergence of new growth trajectories.Footnote 85
From a long-term perspective, the paper offers insights that shed light on how past industrial policies may have contributed to the development of specific capabilities, which later enabled processes of related diversification, thereby complementing research on the role of contemporary public policies in shaping economic development.Footnote 86 In the context of reindustrialization, this perspective may help identify latent sectoral potential within declining industrial regions—guiding industrial policy in Europe not only toward strengthening already successful territories, but also toward promoting redistribution and territorial convergence through support for new, strategically aligned activities.Footnote 87
Beyond its implications for debates on industrial policy and political economy, this paper also speaks to the literature on the value of historical methods to analyze cluster emergence as it aligns with previous works on the potential of employing agency and contingency to explain structural dynamics, deepening the interrelationship between firms and public institutions.Footnote 88 Finally, from the perspective of Economic and Business History, this study represents a clear response from our discipline to the identified need to bring the historical perspective closer to Evolutionary Economic Geography, and thus, to the claim that in evolutionary studies, “history (really) matters.”Footnote 89
Acknowledgments
This research is funded by the Ministry of Science, Innovation, and Universities through the project “Business Dynamics and Varieties of Capitalism: Industrialization, Deindustrialization, and Resilience in the Northwestern Mediterranean, 1889–2024” (PID2024-157174NB-I00). It is also supported by the GRAEFES (Tecnocampus—UPF) and the Economic History and Development (Industry, Business, Sustainability) (UB, 2021SGR0762) research groups. Thanks to the reviewers and editor of Enterprise & Society, whose comments and guidance have greatly improved the original version of this paper. I would also like to thank Jordi Catalan, Marc Prat, Guillem Verd, Grace Ballor, Valeria Giacomin, and the participants in the 9th Annual Meeting of the Danish Society for Economic and Social History for their valuable comments. All errors are my own.
Annex 1
Main factors affecting each phase in the emergence of the Asturian metalworking cluster

Note: Factors are based on those presented in Brenner and Mühligh (2013).