INTRODUCTION
Biological reference points (BRPs) are commonly used to judge the status of exploited fish populations (Collie & Gislason Reference Collie and Gislason2001). In most cases, BRPs are estimated from stock assessment models and then used to define limits of fishery exploitation in terms of maximum sustainable yield (MSY), maximum fishing mortality (for example F MSY), target spawning stock biomass levels (such as B MSY), or some multiple of these measures (United Nations 1995). Although increasingly sophisticated fisheries stock assessment models are used to characterize the risks associated with measurement and process uncertainties (Cordue & Francis Reference Cordue and Francis1994), widely disparate estimates of BRPs often arise from small changes in model assumptions, estimation methods, or even the weights placed on particular data sources. Such differences imply that no individual set of BRPs, and therefore assessments of uncertainty and risk, can be considered correct for a particular fish stock. Instead, alternative BRPs, each corresponding to alternative assumptions or hypotheses about the stock, data or both, should be considered when developing fishery harvest strategies. Although the need to recognize alternative model structures is well established in the fisheries literature (Hilborn & Peterman Reference Hilborn and Peterman1995), use of multiple working hypotheses seems rare in stock assessment practice. The worst-case stock assessment scenario occurs where a suite of alternative models is presented without an evaluation of the expected ability of those models to help managers meet fishery objectives related to conservation and economic opportunity. Too often the fishery manager is left in the untenable position of having to derive the allowable catch by integrating dissimilar measures of risk across sensitivity analyses that are only intended to illustrate BRP uncertainty.
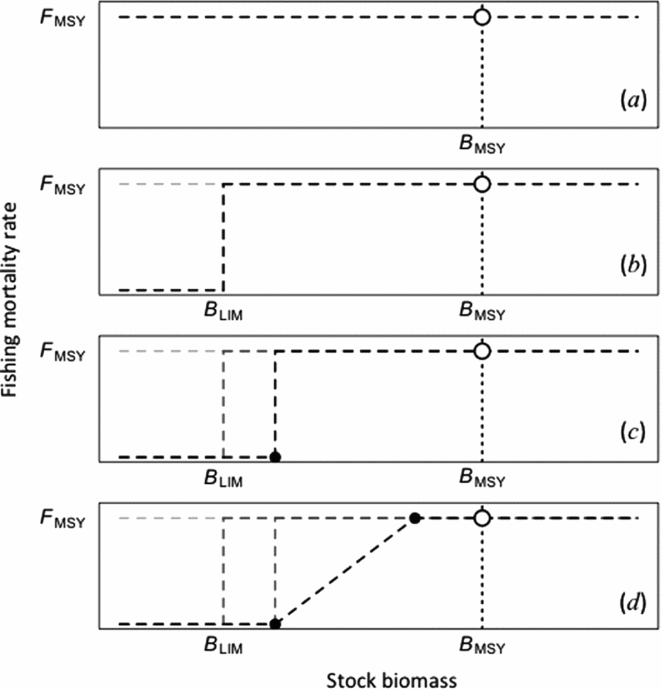
In this paper, we investigate the conservation and economic consequences of adopting alternative management procedures (MPs) for the multi-fleet multi-gear sablefish (Anoplopoma fimbria) fishery in British Columbia (Canada). Biological reference points estimated for this stock vary substantially depending on assumptions about population dynamics, recruitment and data quality. Despite this uncertainty, fishery managers and stakeholders require a single transparent MP that maximizes economic opportunity, while meeting requirements for acceptably low conservation risks to the sablefish stock. The procedures we examined all involved a set of operational control points (OCPs) that defined a harvest control rule. Where annual catch limits are derived from a harvest control rule, OCPs are quantities that reflect estimated stock status (for example 0.5B MSY) calculated from a predetermined data set and stock assessment method (Cooke Reference Cooke1999); they may, or may not, be specifically related to BRPs. In contrast to BRPs, which are usually derived on theoretical grounds related to B MSY and F MSY (Caddy & Mahon Reference Caddy and Mahon1995), OCP choices typically reflect practical limitations of data, stock assessment errors, risk tolerance and socioeconomic preferences (Butterworth & Bergh Reference Butterworth, Bergh, Smith, Hunt and Rivard1993; Starr et al. Reference Starr, Breen, Hilborn and Kendrick1997; Hilborn Reference Hilborn2003). One way to view this distinction is as an evolution from equilibrium-based BRPs to the OCPs used in harvest control rules (Fig. 1).
Evolution from equilibrium-based biological reference points to a harvest control rule based on OCPs. (a) The combination (B MSY, F MSY) represents the basis for most biological reference points used in fisheries management. (b) Biological limit reference point B LIM adopted to protect depleted stocks against possible collapse. (c) Avoiding B LIM with high probability in the presence of stock assessment errors, delays in adjusting catch limits and implementation uncertainty involves the first operational control point (black circle). (d) In some cases, a second operational control point (upper black circle) is established at or below B MSY to encourage more rapid stock recovery toward B MSY and lower risk of complete closure. The final dashed line shows a harvest control rule with two OCPs and a target of (B MSY, F MSY). Note that, in practice, stock biomass and harvest control rule OCPs must be estimated from data.

Although harvest control rules (Fig. 1d) are stated in fishery policies and guidelines for Canada (DFO [Department of Fisheries and Oceans, Canada] 2009), New Zealand (NZ MOF [New Zealand Ministry of Fisheries] Reference MOF2008), Australia (Wayte Reference Wayte2009) and the USA (NMFS [National Marine Fisheries Service of the USA] 2009), the conservation benefits and economic trade-offs associated with these rules have rarely been evaluated for individual fisheries. We used a collaborative management strategy evaluation (MSE; de la Mare Reference de la Mare, Floyd, Sheppard and De Barro1986; Cooke Reference Cooke1999; Punt Reference Punt2006) approach to compare alternative harvest control rules in the presence of uncertainty about sablefish stock dynamics and biological reference points.
Sablefish inhabit deep (up to 1500 m below sea level) shelf and slope waters from Baja California to the Bering Sea and Japan. Spawning in the north-east Pacific typically occurs from January to March along the continental shelf at depths > 300 m; larval sablefish are found in surface waters over the shelf and slope in April and May (Kimura et al. Reference Kimura, Shimada and Shaw1998). Juveniles migrate inshore over the following six months and rear in near shore and shelf habitats before moving to offshore deep-water habitats, where they become vulnerable to trawl, longline hook and longline trap fisheries. Offshore migration occurs when sablefish are somewhere between 2 and 5 years old, most likely coincident with maturation, based on the observed higher proportions of young mature fish at a given size in offshore regions as compared to inshore areas. Sablefish display both highly migratory and sedentary life histories, as evidenced by tag-recapture observations (Beamish & McFarlane Reference Beamish and McFarlane1988). The maximum ages that have been reported for sablefish are 94 years in Alaska (Kimura et al. Reference Kimura, Shimada and Shaw1998), 85 years along the USA's west coast (Schirripa Reference Schirripa2007) and 92 years in British Columbia (BC) (A.R. Kronlund, unpublished data 2012). Initial growth is generally rapid, with mature females reaching an average fork length of 55 cm within 3–5 years (McFarlane & Beamish Reference McFarlane and Beamish1983; Kimura et al. Reference Kimura, Shimada and Lowe1993) and a maximum length of up to 110 cm.
Since individual transferable quotas were established in 1991, the sablefish fishery has been managed via a collaborative agreement between the DFO and the Canadian Sablefish Association. Between 1991 and 2005, annual total allowable catches (TACs) were based on a best assessment model approach (de la Mare 1986; Cooke Reference Cooke1999), which is primarily used to identify a catch limit based on the most plausible model and reference points. Despite fishery-independent surveys and sophisticated annual stock assessments, indices of sablefish abundance in Canadian waters declined by approximately 50% between 1991 and 2002, and then again between 2005 and 2009. Causes for the decline remain uncertain, but a lack of strong recruitment and increasing exploitation rates are among the most plausible explanations. During this time, stakeholder frustration grew over what appeared to be complicated and frequently changing stock assessment models, as well as a lack of transparency in how annual quotas were derived from those models. Thus, in 2006, there was mutual agreement to initiate an MSE process aimed at establishing a transparent and consistent process for deriving annual TACs. At that time, annual quotas were 4600 tonnes, but by 2013, quotas were reduced to approximately 2000 tonnes. At least half of this difference represents the accumulation of voluntary annual reductions agreed by industry stakeholders during the MSE process, in part because of manager and stakeholder engagement in setting biological and economic objectives, MP options and operating model scenarios (Cox & Kronlund Reference Cox and Kronlund2008). Declining stock abundance indices after 2005 also contributed to a sense of urgency that quotas were too high, and that the MSE needed to establish a MP capable of stopping that decline. By 2008, we had identified empirical harvest control rules that were easy to understand and potentially effective at reversing the stock decline (Cox & Kronlund Reference Cox and Kronlund2008); however, these procedures were never formally adopted and used because their impacts on short-term yield were perceived to be too drastic.
In this paper, we describe our recent experience developing a new sablefish MP, in which both biological reference points and operational control points play central, yet distinct roles. Our specific objectives are to: (1) show how uncertainty in a complex stock assessment model leads to alternative BRPs and conservation objectives for the sablefish population, (2) use a closed-loop simulation model to compare how alternative operational control point choices affect management ability to meet conservation objectives defined by biological reference points, as well as short-term fishery economic objectives defined by stakeholders, and (3) test robustness of MPs under an unlikely, yet risky, population dynamics scenario.
METHODS
The simulation modelling component of management strategy evaluation is comprised of three parts (Cox & Kronlund Reference Cox and Kronlund2008): (1) operating models and associated BRPs where the former represent hypotheses about the stock and fishery dynamics, and the latter reflect criteria used to define conservation objectives specific to each operating model; (2) MPs and OCPs that define how fishery monitoring data will be collected, analysed and used in a harvest control rule to derive annual TACs; and (3) an evaluation of MPs from part (2) against population dynamics and objectives implied by part (1) via closed-loop simulation techniques. Although our MSE process investigated 56 combinations of operating models and MPs, here we focus on a small subset to demonstrate how our distinction between BRPs and OCPs affects management performance. Full details of the modelling and simulation methods can be found in Cox et al. (Reference Cox, Kronlund and Lacko2011).
Operating models and biological reference points
Sablefish fishery operating models were developed to represent alternative hypotheses about natural mortality rates, at-sea release mortality rates, individual growth rate, and recruitment autocorrelation. These processes are all fundamental to fish population dynamics, yet are typically the most difficult parameters to estimate reliably from fisheries data. The sablefish population dynamics model is structured by age (25+ age-classes) and also by 30 growth groups; the latter dimension is added as part of an evaluation of size-based discarding, selective grading of fish at sea, and potential regulatory changes aimed at reducing these activities. Each operating model was fitted to the entire set of available data for the BC sablefish fishery using AD Model Builder software (Fournier et al. Reference Fournier, Skaug, Ancheta, Ianelli, Magnusson, Maunder, Nielsen and Sibert2012). These data include: (1) annual landed catch by longline trap, longline hook and bottom trawl fisheries (1965–2009); (2) catch-per-unit-effort and age-composition for the longline trap fishery (1979–2009), a fishery-independent fixed-station trap survey (1990–2009), and a fishery-independent stratified random trap survey (2003–2009); (3) audited logbook and onboard observer estimates of total annual at-sea discards for longline trap, longline hook and bottom trawl fisheries (2006–2009); and (4) length-based survey tag releases and recoveries in each of the three fisheries (1996–2009).
Although we originally developed eight operating model scenarios to capture key structural model uncertainties about sablefish population dynamics and recruitment, we only describe three in this paper for the sake of simplicity. The first ‘baseline’ scenario dealt explicitly with uncertainty about sablefish natural mortality by estimating this parameter as part of the operating model fitting procedure. We used an informative Normal(0.08, 0.005) Bayesian prior on the natural mortality rate (M) to overcome the well-known difficulties in estimating M along with other production parameters, and to guard against implausible values. The prior mean is consistent with a wide range of M estimators and assumptions used in sablefish stock assessments (see Appendix C in Cox et al. Reference Cox, Kronlund and Lacko2011). It is not known whether M varies substantially with age for sablefish, or whether there have been systematic changes in M over time. Therefore, we adopt the standard practice in sablefish and other groundfish assessments of assuming that M is constant. We based our estimated model parameters and BRPs on the maximum of the joint Bayes posterior density (MPD) obtained via Markov Chain Monte Carlo simulation (Gelman et al. Reference Gelman, Carlin, Stern and Rubin2004). The second scenario ‘posterior-mean’ was identical to the baseline scenario except that Bayes posterior means, rather than MPDs, were used for all model parameters and BRPs. The third scenario ‘posterior-10th’ was structurally similar to the baseline scenario, except that parameters and BRPs associated with the 10th percentile of the posterior distribution for MSY were deliberately selected to represent a worst-case scenario. This allowed us to evaluate the expected ability of candidate MPs to prevent a stock collapse under extreme outcomes that may arise from structural model errors. Although the science team identified all of the operating model scenarios, the posterior-10th was important to stakeholders because it represented a critical safety test and was also the easiest alternative to understand compared to, for example, auto-correlated recruitment.
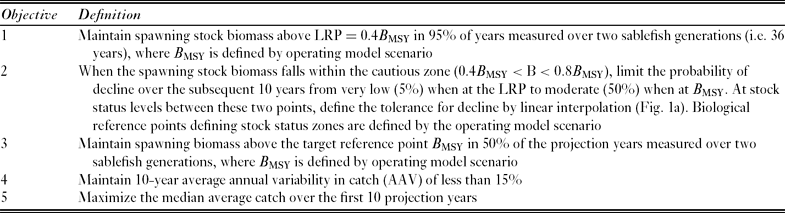
The BRPs derived from each operating model (Table 1) are used to define five specific fishery objectives and criteria (Table 2) that need to be satisfied by the MPs and OCPs (defined below). We derived biological objectives for the stock from DFO (2009) definitions of critical (namely B < 0.4B MSY), cautious (0.4B MSY < B < 0.8B MSY), and healthy (B > 0.8B MSY) zones of stock status (Fig. 2a). Most of these objectives are straightforward, with the exception of objective 2, which attempts to select for MPs that provide an acceptable risk of stock decline that varies with stock abundance (Fig. 2a). For example, when the stock falls within the cautious zone of Canada's harvest policy, application of a MP should promote stock growth rather than decline. If the stock falls near or within the critical zone, the same MP should avoid further decline with high probability (for example 95%). Performance against objective 2 was assessed by (1) determining the exponential population growth rate of the operating model stock over the first 10 years of the projection period for each simulation trial, (2) computing the proportion of these growth rates that are negative, and (3) comparing the proportion of negative growth rates to the probability shown as the ‘acceptable probability of decline’ (APD; Fig. 2a). Note that the operating model stock status values used to determine the APD (Fig. 2a) are derived from the operating model spawning stock status for year 2011 (Table 1); therefore, the APD will differ among operating model scenarios.
Operating model stock status for year 2011, production parameters and biological reference points based on assessment data up to 2010. Model parameters are stock-recruitment steepness (h), natural mortality rate (M, yr−1), and unfished spawning biomass (B 0). Biological reference points for each model: maximum sustainable yield (MSY), optimal exploitation rate on legal-size sablefish (U MSY), target stock biomass (B MSY) and spawning biomass depletion at B MSY (B MSY/B 0). Biomass and catch units are given as thousands of metric tonnes.
Objective definitions for evaluating BC sablefish fishery management procedures.
(a) Fishery conservation objectives derived from biological reference points using biological limit reference point (LRP) and upper stock reference points (USR) to define the critical (dark grey shading), cautious (light grey shading), and healthy (white) zones of true stock status with a target reference point within the healthy zone. The acceptable probability of decline (dashed line segments) provides a status-dependent short-term objective related to the true stock biomass trend. (b) Alternative harvest control rules evaluated for BC sablefish based on OCPs that differ only by the estimated stock status at which the target exploitation begins to decline.
It is important to note that all of the operating models considered in this paper involve stationary population dynamics parameters; that is, we do not contemplate time-varying parameters (such as catchability, M, stock recruitment steepness and B 0) that would cause stock assessment biases or changes in the relationship between stock biomass and production over time (Punt et al. Reference Punt, Trinnie, Walker, McGarvey, Feenstra, Linnane and Hartmann2013).
Management procedures and operational control points
We originally examined seven candidate MPs for the BC sablefish fishery, where each MP represents a specific combination of monitoring data, stock assessment method, harvest control rules (based on OCPs) and measures governing at-sea release of sub-legal sablefish. For this paper, we illustrate the evaluation of trade-offs using only two MPs, distinguished by the choice of OCPs used in the harvest control rule. These two MPs differ only in the upper bound of the estimated stock status, below which the target exploitation rate decreases from the estimated optimal level (namely U MSY) as the estimated stock declines (Fig. 2b). The harvest control rule in the first procedure most closely resembles the provisional suggestion in the DFO fisheries decision-making framework (Shelton & Sinclair Reference Shelton and Sinclair2008; DFO 2009), in which limit and upper stock reference points correspond to 40% and 80% of B MSY, respectively. We refer to this procedure as U80-40 to reflect these operational control point choices. The second procedure, U60-40, uses OCPs corresponding to 40% and 60% of the estimated B MSY. In both cases, the target exploitation rate is zero when estimated stock status is below 40% of estimated B MSY. Although these OCPs are similar multiples of B MSY as BRPs defined earlier for the operating models, they differ in two important respects. First, OCPs use estimated B MSY values that are updated annually from accumulating stock assessment information, whereas BRPs are based on the true operating model biomass. Second, the production function assumed in MP assessments is symmetric about B MSY, whereas the operating model production function is asymmetric. This mismatch should lead to a conservative positive bias in estimates of B MSY and negative bias in U MSY relative to operating model values.
Stock status, U MSY and B MSY used in both U60-40 and U80-40 harvest control rules are estimated annually by fitting a Schaefer surplus production model with process errors in the population dynamics (Punt Reference Punt2003) to time-series consisting of actual landed catch and survey data over the period 1965–2009, as well as the simulated data for the 2010–2047 projection period (described later). An important feature of the Schaefer stock assessment model is that we imposed relatively informative Bayesian priors on U MSY and MSY parameters to define the model. Priors were ‘tuned’ to provide good performance over all of the original eight scenarios, while not tuning to any scenario in particular (Cooke Reference Cooke1999). For the prior distribution on MSY, we used a normal distribution centred on mean 3400 tonnes with standard deviation 1700 tonnes. For U MSY, we used a normal distribution centred on mean 0.08 and standard deviation 0.04. Such tuning reduced the interannual variability in estimates of OCPs, U MSY and MSY derived from the simulated assessments, and provided some flexibility for adapting to new data. The simulated assessments were performed each year by re-fitting the Schaefer model to the entire set of historical (1965–2009) and simulated (2010–2047) data using an errors-in-variables estimation procedure programmed in AD Model Builder (Fournier et al. Reference Fournier, Skaug, Ancheta, Ianelli, Magnusson, Maunder, Nielsen and Sibert2012).
Evaluation in closed-loop simulations
We used the following closed-loop simulation algorithm to evaluate each candidate MP against each operating model (see Walters Reference Walters1986; de la Mare Reference de la Mare1998; Cooke Reference Cooke1999; Punt & Smith Reference Punt and Smith1999; Sainsbury et al. Reference Sainsbury, Punt and Smith2000):
(1) Define a management procedure based on U60-40 or U80-40;
(2) Initialize an operating model scenario (from Table 1) for the period (1965–2010);
(3) Project the operating model population and fishery one year at a time from 2011 to 2047 (two sablefish generations) and apply the following for each year T:
(a) Generate survey abundance index data for the stock assessment;
(b) Apply the Schaefer stock assessment model to catch and survey data for 1965-T to estimate quantities
 $( {\hat U_{{\rm MSY},T} ,\hat B_{{\rm MSY},T} ,\hat B_{T + 1} } )$ (where symbol ^ represents an estimate) required by the harvest control rule;
(c) Compute and apply the target exploitation rate from the harvest control rule (Fig. 2b) to generate a TAC for year T+1;
(4) Update the operating model population age-/size-specific fishing mortality rates generated by the TACs for each fishery, at-sea discard mortalities and new age-1 recruitment;
(5) Repeat steps 3–4 until T = 2047;
(6) Calculate quantitative performance statistics for the simulation trial based on operating model population relative to BRPs, catch and catch variability;
(7) Repeat steps 2–6 for 100 trials and compute summary performance statistics related to objectives.

RESULTS
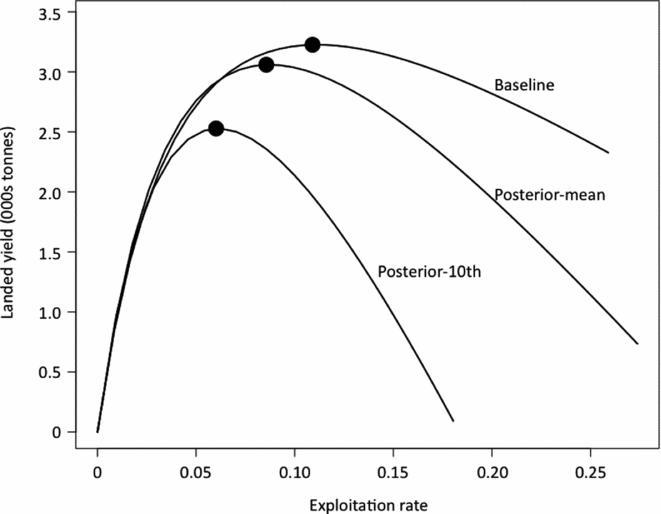
The operating models differ substantially in their relationships between exploitation rates and yield, particularly in how yield declines when the stock is overfished (Fig. 3). As expected, our worst-case scenario (posterior-10th) showed a high degree of sensitivity to overfishing, while the other two scenarios were less affected. It is therefore important that MP projections account for estimation errors in annual biomass and  $\hat U_{{\rm MSY},T}$, as well as implementation errors for the target exploitation rates UT.
Equilibrium relationships between the annual exploitation rate on legal-sized sablefish (> 55 cm) and landed yield for three alternative parameterizations of the operating model. Black points indicate the maximum sustainable yield (MSY) and optimal exploitation rate (U MSY) combinations for each scenario.
Example management procedure performance
We investigated how the two MPs functioned during one 36-year simulation trial under the posterior-10th operating model scenario. We chose this example because it clearly demonstrated a feedback interaction between the harvest control rules (that differ only in the upper OCP on the harvest control rule) and the stock assessment model used to estimate stock biomass and parameters of those rules.
Simulated annual stock assessments for both U60-40 and U80-40 MPs were relatively unbiased early in the projection period, but predicted increasingly large overestimation of spawning biomass over time (T > 2025; Fig. 4a, c). Although only the upper OCP differed, the U80-40 procedure produced greater and earlier overestimation than the U60-40 procedure. Retrospective trajectories of biomass estimates showed temporal error patterns that are typical of stock assessment estimators (not shown; NRC [National Research Council] 1998; Walters Reference Walters2004).
Performance of (a, b) U60-40 and (c, d) U80-40 procedures in a single 36-year simulation trial under the posterior-10th operating model scenario. (a, c) Annual stock assessment model estimates of spawning biomass (red lines beginning in 2011),  $\hat B_{{\rm MSY},T}$ (black circles), lower bound OCP (
 $0.4\hat B_{{\rm MSY},T}$; grey), and upper bound OCP for U60-40 (a, white circles) and U80-40 (c, white circles) harvest control rules. Black lines indicate true operating model spawning biomass. Horizontal lines indicate the true operating model B MSY (dash-dot) and stock status boundaries critical-cautious (0.4B MSY) and cautious-healthy (0.8B MSY). (b, d) The true annual exploitation rate realized by the operating model stock (black), annual estimates of $\hat U_{{\rm MSY},T}$ (red lines beginning in 2011) and annual target exploitation rates output from harvest control rules (white circles). The horizontal dash-dot line indicates the true operating model U MSY.
Overestimation of spawning biomass was associated with increasing overestimation of B MSY and its derivative lower and upper bound OCPs (Fig. 4a, c). The estimated lower bounds, i.e., 40% of estimated $\hat B_{{\rm MSY},T}$, were consistently greater than the corresponding biological limit reference points derived from the operating model.
Exploitation rates realized by the operating model stock were greater than the operating model U MSY for most of the 36-year projection period, although there was a clear decreasing trend in realized exploitation under both MPs (Fig. 4b, d). Annual estimates of the optimal exploitation rate $\hat U_{{\rm MSY},T}$ also decreased over time, and there was a strong negative correlation with the $\hat B_{{\rm MSY},T}$ parameter. As expected, the U60-40 procedure made fewer precautionary reductions in target exploitation rates from the estimated $\hat U_{{\rm MSY},T}$ than the U80-40 procedure, although both reduced exploitation rates sharply in two short periods. Both procedures ultimately resulted in exploitation rates near the operating model U MSY levels by the end of the projection period.
General behaviour of the MPs under other operating model scenarios and simulation trials was similar, although stock assessment estimation biases were generally much smaller for the baseline scenario and moderately smaller for posterior-mean scenario. The feedback between harvest control rules and these stock assessment biases prevailed throughout the simulations.
Conservation and catch performance
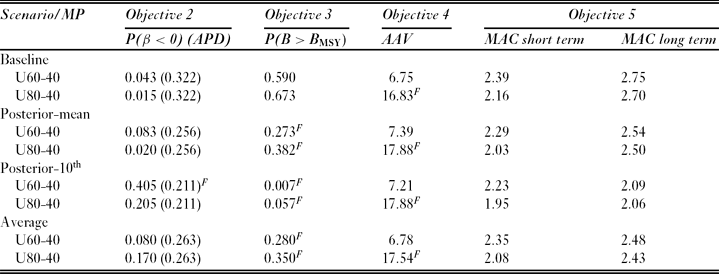
Both U60-40 and U80-40 MPs met the requirement to avoid the biological limit reference point (LRP) with >95% probability (objective 1) under all operating model scenarios, which suggests there is a low probability that various sources of stock assessment biases and delays would lead to stock collapse. The U60-40 procedure failed to meet objective 2 under the posterior-10th scenario in which 40.5% of simulated stock trajectories declined over the first 10 projection years compared to an allowable probability of 21.1% (Table 3). Both U60-40 and U80-40 procedures failed to maintain the stock above B MSY in 50% of years (as required for objective 3) for all but the baseline scenario. This result is unsurprising given that current stock status is below B MSY for all operating models (Table 1) and the life history of sablefish limits the rate of stock growth in the short-term in the presence of fishing. However, even under the most pessimistic posterior-10th scenario, realized exploitation rates under both MPs resulted in long-term biomass growth to within 80% of B MSY, which is the BRP delineating the cautious-healthy zone boundary (not shown). In terms of catch performance, procedure U80-40 failed to meet the 15% acceptable limit to average annual variation in catch (objective 4) in all scenarios. In the short term (2011–2021), U80-40 produced annual yields that were c. 230–280 t yr−1 less than those produced by U60-40, but, over the long term (2011–2047), U80-40 yields were only 30–50 t yr−1 less than those obtained by U60-40.
Management procedure performance against objectives 2–5 (Table 2). Under objective 2, numbers in parentheses indicate the acceptable probability of decline (APD) for that particular scenario. The superscript F indicates failure to meet an objective. For objective 4, MAC = medium average annual catch and, for objective 5, AAV = average annual variability in catch.
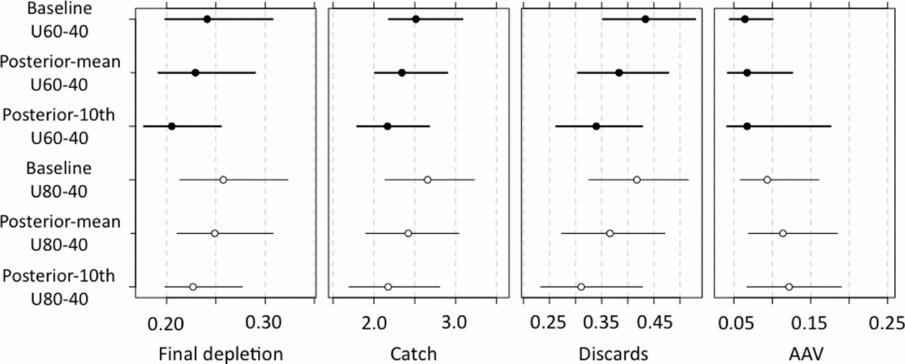
When averaged over scenarios (operating models considered equally plausible), U60-40 and U80-40 performed similarly for conservation objectives 1–3, but differed dramatically for short-term catch objectives 4 and 5. Interannual variation in catch for U80-40 was 1.58 times higher than that of U60-40, although the average value of 17.54% was only slightly above the acceptable upper limit of 15%. At recent dockside prices, the greater 10-year median average catch achieved by U60-40 equates to approximately CAN$ 2.7 million per year (CAN$ 1.00 = US$ 0.994, 31 January 2011), which is approximately 10% of current landed value. This difference occurs because the U80-40 rule imposes an immediate 50% reduction in exploitation rate in the first projection year (Fig. 5b, d), which subsequently results in a yield of 1100 tonnes in 2011, as compared to a yield of 2300 tonnes for U60-40 in 2011. Although the simulated exploitation rates and yield for U80-40 recover within a few years, the difference for 2011 alone represents an estimated additional cost of CAN$ 12 million to implement the U80-40 rule as opposed to the U60-40 rule. Conversely, a short initial period of low exploitation also produces greater growth in simulated stock over the medium term; thus over the period 2016–2021, the U80-40 procedure outperformed U60-40 for all catch and conservation objectives except average annual variation in catch (Fig. 6).
Distributions of exploitation rates realized by the operating model stock arising from application of (a, c) U60-40 and (b, d) U80-40 management procedures to (a, b) posterior-mean and (c, d) posterior-10th operating model scenarios. Dashed horizontal lines indicate the actual U MSY for each scenario. The vertical line segment on the right edge shows the mean (black dot) ± 1 standard deviation of the prior distribution for U MSY used in the management procedure stock assessments.
Projected medium-term (2016–2021) performance statistics for U60-40 and U80-40 harvest control rules under the three alternative operating model parameterizations. Catch and discards are in thousands of metric tonnes, final depletion is unitless, and AAV is the average per cent change in annual landed catch. Symbols indicate the median (circle) and central 90% interval (bars).
Performance against UMSY reference point
The BRP target biomass for the sablefish stock is B MSY, as implied by objective 3. Both U60-40 and U80-40 MPs were able to rebuild spawning stock biomass to this level under the most optimistic baseline scenario; however, they were able to meet that objective largely because the stock assessment model was tuned to produce slightly conservative estimates of U MSY that were lower than those implied by the baseline scenario. Under all combinations of operating model and MPs, exploitation rates realized by the operating model populations declined over time, with median values either approaching the conservative U MSY prior for the baseline and posterior-mean (Fig. 5a, b) scenarios, or the actual operating model value of U MSY for posterior-10th (Fig. 5c, d). The latter result suggests that the MPs are robust, in that they are able to learn and adapt to the lower productivity scenario presented by posterior-10th, although learning is relatively slow. As expected, the U60-40 procedure maintained both slightly higher and less variable distributions of realized exploitation rates on the stock compared to the U80-40 procedure because the target exploitation rates were consistent over a wider range of estimated stock sizes. Under the baseline scenario, the U80-40 procedure maintained the probability of exceeding U MSY at < 10% in most years. Procedure U60-40 performed similarly, but only after a relatively short period of about 5–6 years in which the probability of exceeding a U MSY limit reference point ranged from 5–30%. Under the posterior-mean scenario, on average U60-40 continued overfishing the stock for about 15 years and then underfished for the next 20 years (Fig. 5a). The distribution of all 100 trials followed a similar pattern. Although the U80-40 procedure generally slightly underfished the stock for the entire projection period, it overfished the stock in 50–70% of the years (Fig. 5b). Finally, on average both MPs overfished the posterior-10th scenario for the entire projection period, with median exploitation rates realized by the stock ranging from 7% to 9%, compared to an optimal level of c. 6% (Fig. 5c, d).
DISCUSSION
In this paper, we have demonstrated how distinguishing between the role of BRPs in setting fishery conservation objectives and the role of OCPs in defining harvest control rules may improve management performance in one of Canada's most valuable fisheries. The sablefish management system treats BRPs as purely biological criteria within explicit fishery conservation objectives, while OCPs are devised to maximize the socioeconomic performance of the management system subject to meeting conservation constraints. Our results show that a slight modification of OCPs from the provisional values suggested in Canada's harvest policy substantially reduced the apparent cost of adopting precautionary MPs for this fishery.
Our closed-loop simulations indicate that implementing Canada's provisional U80-40 harvest control rule would lead to initial reductions in annual sablefish yield of CAN$ 2.7–10 million yr−1, or 10–50% of current landed value. These losses in yield are relatively certain compared to the less certain gains in future yield that would follow from lower exploitation rates on the stock. This supports Walters (Reference Walters1998), who also investigated ‘precautionary’ harvest control rules, and speculated that the unnecessary variations in catch associated with such rules may risk stakeholder distrust. Indeed, fishery managers and stakeholders responded to our simulation results for the U80-40 procedure with shock and disappointment, rather than expressing relief that such procedures were robust to several recognized uncertainties. Ensuing dialogues led to the development of alternative MPs, such as U60-40, in an attempt to improve on the conservation-economic trade-off. Even under the most pessimistic scenarios we examined, the U60-40 procedure provided negligible risks of impairing future recruitment and did not inflict unnecessary short-term penalties on the fishing industry. This design choice also did not require amendment of the original BRPs and the definitions of critical, cautious and healthy zones of stock status suggested in Canada's harvest policy.
Harvest control rules of the U80-40 form are standard for fisheries around the world. Choices for the upper bound of stock status at which precautionary harvest rates are invoked are normally based on biological arguments such as 0.8B MSY (DFO 2009) or (1-M)B MSY (Restrepo & Powers Reference Restrepo and Powers1999). However, it is difficult to imagine how biological considerations alone can lead to a high probability of meeting conservation and economic objectives in the presence of typical population dynamics uncertainties, as well as biomass and reference point estimation errors of the magnitude shown in our simulations. Similarly, it is not clear how a biologically-based upper bound choice should be modified to mitigate risks associated with changes in the abundance monitoring and stock assessment cycle, perhaps as a consequence of reduced survey funding; the fishery assessment and management context must also be taken into account when setting the upper bound OCP for harvest control rules.
The initial implementation years of formal MPs could be the most critical period in any fisheries management strategy evaluation process, because this is the time when yield may need to be reduced significantly, or even slightly, from historical levels. The voluntary reductions in sablefish quotas during 2006–2009 were somewhat risky because they were less than the amounts suggested by preliminary MPs. These gradual changes reflected industry preferences for a phased transition to a formal MP. In the revised MSE process of 2010–2011, our distinction between BRPs and OCPs allowed industry stakeholders to tailor the management process (namely OCPs) to suit short-term economic needs, while simultaneously demonstrating acceptable conservation performance against common BRP standards. This flexibility ultimately led to successful implementation of the U60-40 procedure for setting TACs in 2011, 2012 and 2013.
Structural model uncertainties are clearly an important factor to be considered in fisheries stock assessment as reflected in language used to define the precautionary approach to capture fisheries (FAO [Food and Agricultural Organization of the United Nations] 1995) and consumer-based seafood certification programmes, which both emphasize a need to avoid serious and potentially irreversible harm to a stock. The failure of some Canadian fish stocks such as northern cod (Gadus morhua; Hutchings Reference Hutchings2000) or some Pacific herring (Clupea pallasi) populations in BC (Schweigert et al. Reference Schweigert, Boldt, Flostrand and Cleary2010) to recover from low abundance is consistent with the notion that true population dynamics at low abundance may be more complex than typical fisheries models allow (Keith et al. Reference Keith, Hutchings and Hilborn2012). However, such outcomes are unlikely in traditional stock assessments because the models usually involve relatively stable compensatory population dynamics (production-per-spawner increasing at low spawning stock sizes) (Punt Reference Punt2006). Admitting greater complexity is unlikely to occur under a best assessment approach because BRPs derived from overparameterized models are already highly uncertain and difficult to defend. In contrast, OCPs within an MSE approach are designed to be estimable from any available data. Testing MPs against increasingly complex operating models until there is clear evidence that objectives cannot be met provides an adequate defence of OCP choices. In this way, separating BRPs from OCPs could allow more complex operating model scenarios into harvest policy design without making a potentially damaging direct connection between highly uncertain BRPs and fishery decision-making. For example, Punt et al. (Reference Punt, Trinnie, Walker, McGarvey, Feenstra, Linnane and Hartmann2013) evaluated MPs for rock lobster (Jasus edwardsii) in the face of non-stationarity in growth, natural mortality, catchability and recruitment. Such complexity would be untenable in a typical best assessment approach, yet these are clearly important issues that could determine overall management performance. Although we did not explicitly consider non-stationary operating model parameters, we did evaluate MPs against autocorrelated recruitment scenarios (Cox et al. Reference Cox, Kronlund and Lacko2011), which may produce the appearance of non-stationarity on timescales of decades. MP performance for these scenarios fell between the posterior-mean and posterior-10th scenarios, so we assumed the main effects were captured. Nevertheless, non-stationarity of sablefish parameters for growth, recruitment and movement rates are important factors to consider in future research. A key issue would be determining the BRPs to be used in fishery objectives because, as we have shown, it is the operating model parameters that determine BRPs. There has been little discussion in the literature about how and whether BRPs should be adjusted when key parameters vary over time.
Even where the roles of BRPs and OCPs are clearly separated, several key questions arise regarding how harvest strategy evaluations should be conducted in accordance with both national and international sustainability standards. For example, what types of irreversibility and serious harm should be included in operating models? What types of evidence should be used to determine whether an evaluation is acceptable for determining MP robustness? How should alternative operating model scenarios and BRPs be weighted in performance evaluations? How should risk be measured and equalized among fisheries or stocks that differ in data quality and quantity? These types of questions are increasingly important as fisheries attempting to enter the global fisheries trade apply for consumer-based sustainability certification, which purports to apply a single standard across fisheries that vary considerably in the quality and quantity of evidence for MP robustness. Without established criteria for judging the quality and performance of MP evaluations, it will be difficult to create an unbiased and non-punitive standard for fishery sustainability. Although BC's sablefish fishery is currently certified under the Marine Stewardship Council (MSC 2012), questions like these have been raised and will likely become relevant to recertification in the future.
The BC sablefish MSE approach benefits from the input of academic researchers, government scientists, the fishing industry, environmental non-governmental organizations and consumer-based certification bodies. The process of academic peer-review provides a critical independent perspective on the scientific research aspects of MP evaluations, which helps to legitimize (or criticize) choices for BRPs, as well as the methods and criteria by which OCPs are evaluated. Review by government science panels provides a complementary context-specific evaluation of the potential reliability and acceptance of OCPs by managers and stakeholders, in addition to a long-term perspective on the fishery. Consumer-based sustainability certifiers have little influence over particular BRP or OCP choices, but they do help to establish the ‘sustainability’ basis by evaluating fishery performance against a common set of generally accepted standards. More importantly, consumer-based sustainability certifiers could help ensure that OCPs are used consistently in fishery decision-making, especially where annual audits are used to verify that MPs are being followed. Finally, we believe that engagement and review by stakeholder groups provides some of the greatest benefits, especially for ensuring that alternative operating model scenarios and MP options are relevant and plausible. One risk involved in MSE is that, among many operating models, the pessimistic ones tend to rise to the top and command debate. The issue of plausibility weighting of operating model scenarios remains one of the most important challenges for MSE practitioners and one that we have not dealt with explicitly in this paper. However, the alternative best assessment model approach typically admits only one structural hypothesis, and hinges all advice on that assumption. Clearly the latter is less palatable from a scientific honesty point of view and from a risk mitigation perspective. Involvement and review by fishery stakeholders provides an important check on this conservatism and, combined with other independent review channels, improves the odds of adopting sustainable harvest policies.
CONCLUSION
The MSE approach has been critical to the successful introduction and implementation of BRPs and OCPs for Canada's sablefish fishery. The conservation and economic stakes do not appear as high for any particular iteration of the MSE process compared to, for example, a best assessment approach. The MSE approach changes the nature of the stock assessment problem, from finding the truth to designing a robust system given knowledge of irresolvable uncertainties. The measure of success lies not in how well a model fits particular data, but in expected management system performance relative to objectives for both fish stocks and fishery stakeholders.
ACKNOWLEDGEMENTS
We especially thank members of the Canadian Sablefish Association for their contributions to this project, Lisa Lacko and Malcolm Wyeth for data and survey support, respectively, and Nathan Taylor, Robyn Forrest, and Dana Hanselman for comments on earlier drafts. Helpful suggestions by the Editor and two anonymous referees greatly improved this manuscript. This work was supported by a Natural Sciences and Engineering Research Council of Canada Discovery Grant (RGPIN 262109) to S. Cox.