I. INTRODUCTION
The eutectoid point is a characteristic of iron carbon alloys. The eutectoid point corresponds to 0.80% wt C; the crystallographic structure is a body-centered cubic (bcc), and the metallurgical structure at the Fe–C equilibrium diagram is 100% pearlite. Steel mechanical and metallurgical properties depend on microstructural changes as a result of the heat treatment. The steel metallurgical microstructure after the softening heat treatment consists of ferrite (Feα) and pearlite (Feα + Fe3C). The pearlite amount depends on the carbon content. As the carbon content increases, hardness, ductility, strength, and toughness properties change. Pearlite can be considered as a composite of ferrite and cementite. Pearlite can be transformed to coarse perlite, fine pearlite, or spheroidized, depending on the cooling rate during the heat treatment. Reference Zhou and Shiflet1–Reference Boswell and Chadwick4
Furthermore, thermal properties as thermal diffusivity and conductivity of carbon steels are modified by structural changes induced by the heat treatment and carbon content. There are different techniques as micro and nanohardness test, tensile test, transmission electron microscopy (TEM), and scanning electron microscopy (SEM) to evaluate mechanical and metallurgical properties of the carbon steel. Photothermal techniques as photothermal radiometry (PTR) and photocarrier radiometry (PCR) are useful to characterize thermal properties. PTR is widely applied in the semiconductor characterization, and it can be applied to more materials to determine thermal properties correlating to metallurgical properties as a nondestructive testing technology (NDT). Reference Lara-Guevara, Ortiz-Echeverri, Rojas-Rodriguez, Mosquera-Mosquera, Ariza-Calderón, Ayala-Garcia and Rodriguez-García5
The development of these nondestructive and noncontact techniques for evaluating metallic materials, mainly steels, is going to be a great value in the steel characterization field. Photothermal techniques in the metal characterization were studied by Busse applying thermal waves. Reference Busse6 Busse and Walther reviewed the photothermal nondestructive evaluation of several materials in a later publication. Reference Busse and Walther7
In the case of the fully pearlite eutectoid steel, the mechanical behavior is controlled mainly by the microstructure developed during the heat treatment. Reference Arai and Harper8,Reference Bailey9 A eutectoid carbon steel was studied in this work, which was modified by three different annealing heat treatment cycles: spheroidizing, isothermal annealing, and normalization (air cooling). These annealing cycles induced changes in the metallurgical microstructure. Steel samples were analyzed by SEM, PTR, X-ray diffraction (XRD), and Vickers nanohardness. Thermal properties as thermal diffusivity and heat capacity were analyzed using photoacoustic and heat relaxation. PTR amplitude and phase images were correlated to metallurgical properties as the metallographic structure and Vickers nanohardness to determine the effect of annealing cycles.
The aim of this study was to determine the correlation among thermal, structural, and metallurgical properties, as a result of the annealing heat treatment. The characterization was done by SEM, XRD, Vickers nanohardness, as well as photothermal techniques such as PTR, photoacoustic, and thermal relaxation time.
II. EXPERIMENTAL
A. Materials
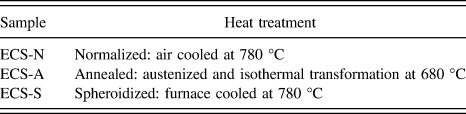
Three samples of eutectoid carbon steel at different annealing heat treatments were studied. Heat treatments were: spheroidized, isothermal annealing, and normalized. Samples were identified according to Table I. The chemical analysis of the studied eutectoid steel was 0.79% Cwt; 0.30% Siwt; 0.59% Mnwt; 0.016% Swt; 0.015% Pwt. Reference Bailey9 Specimens were metallographically prepared with 240, 320, 400, 600, and 1000 sandpapers, then polished with 1 μm diamond paste, finished with 0.3 μm alumina, and etched with 2% nital concentration for 30 s.
Heat treatment conditions of eutectoid steel samples.

B. SEM analysis
Morphologic changes in sample metallurgical microstructures were analyzed by a low-vacuum scanning electron microscope (LVSEM; JSM 5600LV, JEOL Ltd., Tokyo, Japan), 5 nm resolution in LV mode, fitted with an energy dispersive X-ray spectrometer (Model Voyager 4.2.3, NORAN Instruments, Inc., Middleton, Wisconsin). The eutectoid steel was characterized by its metallurgical microstructure 100% pearlite distributed homogeneously corresponding to the eutectoid point located at 0.8% wt C, according to the Fe–C equilibrium diagram. The eutectoid phase was widely studied and reported in handbook. Reference Vander Voort10 SEM images were obtained from a 2 × 2 mm characteristic region.
C. Vickers nanohardness
Vickers nanohardness was tested on polished samples. The test was made by using a nanohardness tester Fischer Model HM 2000 (Fischer Technology, Windsor, Connecticut) applying a 3 μN load. 25 indentations were taken from each eutectoid steel sample.
D. XRD analysis
XRD patterns of studied samples were taken using a Siemens diffractometer Crystaloflex 5000 (Bruker AXS, Karlsruhe, Germany) operating at 35 K, 15 mA with Cu Kα line at room temperature.
E. PTR
Thermal images were obtained by scanning an area of 2 × 2 mm from each sample. SEM images were compared to the PTR images obtained in the same area. Images were taken at 40 lines, 50 points per line, and at 50 µm between points and lines according to the methodology proposed elsewhere. Reference Busse and Walther7,Reference Garcia, Guo, Mandelis and Simmons11,Reference Garcia, Nicolaides, Park, Mandelis and Farahkbahsh12
The PTR method comprises the optical excitation of the sample by a modulated source, as well as the detection of the recombination-induced infrared emission while some Planck-mediated emissions are filtered. PTR completely covers the thermal infrared emission band (1–12 µm). Two information channels were used: PTR amplitude and phase signals obtained from a highly focused laser beam (40 µm), and recently developed theoretical Reference Garcia, Guo, Mandelis and Simmons11 and computational techniques. Reference Garcia, Nicolaides, Park, Mandelis and Farahkbahsh12
PTR process produces a periodic temperature distribution commonly known as a thermal wave. PTR is produced by the frequency modulation of a laser that affects the vibration modes of metal causing different emission infrareds depending on thermal properties and the diffusion length. The thermal wave is spatially damped and it depends on the diffusion length that involves thermal properties of the sample. The PTR principle is the use of a modulated laser beam to scan the sample surface and recording simultaneously the infrared radiation emitted by the metal surface. Thermal property differences lead to measure amplitude and phase variations, allowing the thermal mapping.
The PTR technique allows analyzing subsurface changes in metals and semiconductor materials taking advantages of their thermal properties. The analysis exploits different thermal properties of metallurgical phases in the metallographic microstructure as a result of heat treatment conditions, as well as subsurface defects which depend on thermal properties.
The thermal wave generated by the absorption of laser radiation at the sample surface becomes attenuated at a distance μ. Only the information due to thermal property changes of the sample surface is obtained. The thermal length is defined in the following Eq. (1):
 $$\mu = \sqrt {{\alpha \over {\pi f}}} \quad ,$$
where α is the thermal diffusivity of the samples and f = ω/2π.
The PTR amplitude generated in the sample due to the absorption of modulated laser can be described by the following Eq. (2) Reference Guo, Sivagurunathan, Garcia, Mandelis, Giunta and Milletari13 :
 $$T\left( {x,t} \right) = {{{I_{\rm{0}}}} \over {2\varepsilon \sqrt \omega }}\exp \left( { - {x \over \mu }} \right)\cos \left( {\omega t - {x \over \mu } + {\pi \over 4}} \right)\quad ,$$
where ω is the angular frequency, I 0 is the laser intensity, x is the sample thickness, and ε is the thermal effusivity. Note that the prefactor in Eq. (2) is constant for a fixed modulation frequency f = ω/2π.
In Eq. (1), the thermal diffusion length and thus the thermal diffusivity determine the damping of the thermal wave as well as the phase lag between the excitation and the thermal response of the system. Thus, the measured PTR amplitude signal is at a fixed modulation frequency, proportional to the reciprocal of the thermal effusivity, while the PTR phase lag will be proportional to the x/μ term, Eq. (2). It is well known that the thermal effusivity (the rate at which a material can absorb heat) and the thermal diffusivity are dependent parameters of the thermal wave propagation which determines the material inertia. The thermal effusivity is a significant heating periodic surface and a heat transport parameter because it represents the dissipated heat energy in the solid material (steel) per temperature change unit, starting the periodic warming process; and it is related to Eq. (1) by the diffusivity coefficient (α), as shown in the following Eq. (3):
 $$\varepsilon = {k \over {\sqrt \alpha }} = \sqrt {k\rho c} \quad ,$$
where k is the thermal conductivity, α is the thermal diffusivity, ρ is the material density, and c is the specific heat at a constant volume.
PTR amplitude and phase images were used to analyze thermal changes, to explain the correlation among the PTR signal, the heat treatment effect, Vickers nanohardness, and the structure analyzed by XRD on the eutectoid steel. Reference Lara-Guevara, Ortiz-Echeverri, Rojas-Rodriguez, Mosquera-Mosquera, Ariza-Calderón, Ayala-Garcia and Rodriguez-García5,Reference Rojas-Rodriguez, Velazquez, Jaramillo and Rodriguez-Garcia14
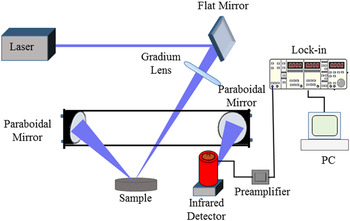
Frequency scans between 10 Hz and 10 kHz were carried out to determine the optimal modulation frequency (OMF) to obtain thermal images. The OMF was chosen and set at 500 Hz. Reference Rojas-Rodriguez, Velazquez, Jaramillo and Rodriguez-Garcia14 The largest changes on PTR amplitude and phase signals were observed at this frequency. Reference Busse and Walther7 The IR emission from each sample was collected by collimating off-axis mirrors and by focusing onto a Judson Model J15D12-M204 HgCdTe detector (1–12 μm; Teledyne Judson Technologies, Montgomeryville, Pennsylvania) which was cooled by liquid nitrogen. The detector signal was amplified by a low-noise preamplifier and then sent to a lock-in amplifier SRS-850 which was interfaced with a PC. PTR amplitude and phase images were obtained by using a set of XYZ micro stages.
PTR technique led to measure amplitude and phase differences on the scanned area of samples allowing the steel thermal mapping.
Figure 1 shows the experimental setup. Samples were mounted on an X–Y translation stage driven by stepping motors.
PTR experimental setup.

F. Thermal diffusivity
The thermal diffusivity determination of studied samples was carried out in an open photoacoustic cell (OPC). Reference Lara-Guevara, Ortiz-Echeverri, Rojas-Rodriguez, Mosquera-Mosquera, Ariza-Calderón, Ayala-Garcia and Rodriguez-García5 The sample thickness was 450 µm. Samples were placed on top of an Electret microphone. A blue laser beam of 450 nm wavelength modulated by a lock-in SR830 model amplifier was used. The laser was focused onto the sample surface. Modulation frequencies from 15 to 400 Hz were used. Data of photoacoustic signals were obtained in two channels amplitude and phase.
The pressure fluctuation at the photoacoustic gas chamber was calculated using Rosencwaig and Gersho thermal diffusion model Reference Rosencwaig and Gersho15 with the respective simplification for the thermally thick and optically opaque regime Reference Dias, Bedeschi, Ferreira da Silva, Nakamura, Castro Meira and Trava-Airoldi16 according to the following Eq. (4):
 $${V_{{\rm{OPC}}}} = {A \over f}{{\rm{e}}^{ - \sqrt {{f \over {{f_{\rm{c}}}}}} }}\quad ,$$
where A contains geometric parameters including factors as gas thermal properties, light beam intensity, and room temperature; f is the frequency used in experimental and f c is the cutoff which separates thick and thin regimens. This cutoff is correlated to thermal diffusivity α and the sample thickness l according to the following Eq. (5) Reference Yao and Wang17 :
 $$\alpha = \pi {l^2}{f_{\rm{c}}}\quad .$$
Sample data were collected by photoacoustic technique using a lock-in amplifier interfaced with a PC to observe amplitude and phase signal behaviors.
G. Heat capacity
The heat capacity per volume unit was determined by the thermal relaxation method. Reference Lara-Guevara, Ortiz-Echeverri, Rojas-Rodriguez, Mosquera-Mosquera, Ariza-Calderón, Ayala-Garcia and Rodriguez-García5 A thermocouple was connected to the back of the sample. A blue laser of 450 nm wavelength was focused onto the sample surface continuous and uniformly. The system was connected to a thermocouple and to a computer to process data. The vacuum was produced to minimize convection and conduction heat losses, thereby, mainly ensuring a radiation heat transfer. Reference Marquenzini, Cell, Mansanares, Vargas and Miranda18 The temperature variation is given by the following Eq. (6):
 $$\Delta T(t) = {{{P_0}} \over \eta }\left( {1 - {{\rm{e}}^{ - {\tau \mathord{\left/ {\vphantom {\tau T}} \right. \kern-\nulldelimiterspace} T}}}} \right)\quad ,$$
τ value is related to the heat capacity by the following Eq. (7):
 $$\rho {C_{\rm{p}}} = {{8\varepsilon \sigma T_0^3} \over l}\quad ,$$
where ε is the thermal emissivity that is considered 1 in this case, σ is the Stefan Boltzmann constant, T 0 is the temperature, and l is the sample thickness. The thermal conductivity is related to the heat capacity and thermal diffusivity, according to the following Eq. (8):
 $$k = \alpha \rho {C_{\rm{p}}}\quad .$$
III. RESULTS AND DISCUSSION
A. SEM analysis
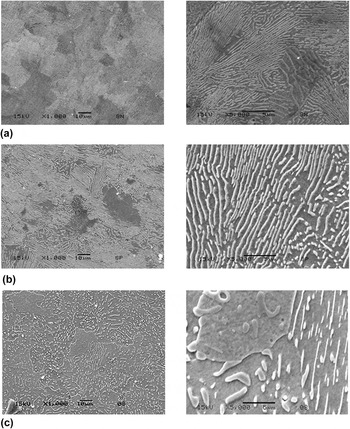
Metallurgical microstructures of eutectoid steel samples were analyzed by SEM. The ECS-N sample was continuously air cooled at austenite temperature; the metallurgical microstructure was fine pearlite homogeneously distributed as shown in Fig. 2(a). The ECS-A sample was heated at austenite temperature and then transferred to a second furnace which was isothermally maintained at 680 °C; the microstructure was a coarse pearlite as shown in Fig. 2(b). The ECS-S sample was continuously cooled in the furnace from the austenite temperature to the transformation temperature 780 °C; the metallurgical microstructure was spheroidized Fe3C relatively large and widely spaced as shown in Fig. 2(c). Reference Bailey9
Metallurgical microstructures of 0.79% Cw eutectoid steel samples, 1000× and 5000× magnifications (a) ECS-N, (b) ECS-A, and (c) ECS-S.

The SEM analysis allowed observing metallurgical microstructure differences between ECS-N and ECS-A samples. The microstructure was pearlite (Feα + Fe3C) which was finer in the ECS-N than in the ECS-A sample. Both samples compared to ECS-S showed a significant difference because the ESC-S consisted of spheroidized carbides (Fe3C) on ferritic matrix. Microstructure differences demonstrated that sample properties were a result of the applied heat treatment. It was expected a lower nanohardness in the ECS-S than in the ECS-N sample due to the cooling rate.
B. Nanohardness
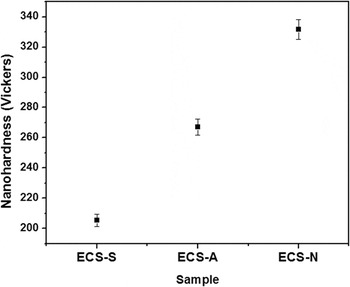
Figure 3 illustrates Vickers nanohardness results of studied samples. The ECS-N sample showed a higher hardness than the ECS-S sample, as it was expected due the cooling rate in the normalizing is higher than in the spheroidizing. Both are diffusion processes which depend on the time and cooling speed. The hardness depends on the cooling speed. As the cooling rate (cut diffusion) is higher, the hardness is higher. As the cooling rate is lower (greater diffusion), the hardness is lower. The intermediate hardness of the ECS-A sample is explained by the cooling rate which is the main factor of steel properties. Reference Hawbolt, Brimacombe and Chau19
Nanohardness profile of eutectoid carbon steel at different softening heat treatments.

C. XRD analysis
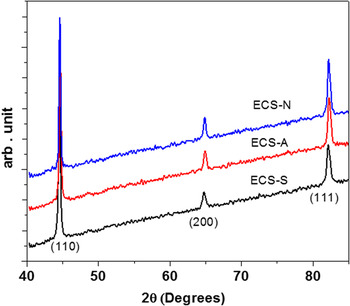
Figure 4 shows XRD patterns of ECS-S, ECS-A, and ECS-N samples. Crystalline orientations (110), (200), and (111) were identified. The orientation (110) showed the highest intensity of the ECS-N sample. Reference Rojas-Rodriguez, Jaramillo-Vigueras, Velásquez-Hernández, del Real, Serroukh, Baños, García and Rodriguez-García20,Reference Ganesh, Nagpure, Gupta and Kukreja21
XRD patterns of eutectic carbon steel at (110), (200), and (111) crystallographic planes. The inset shows the (110) crystallographic plane.

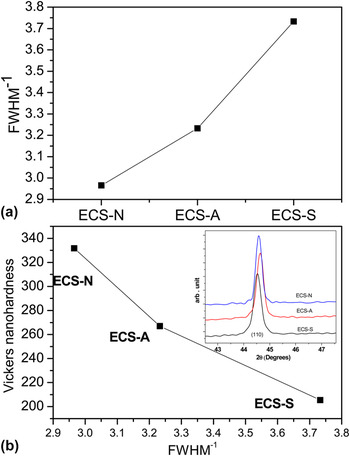
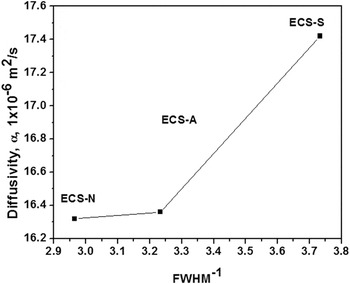
Crystalline quality changes were determined by studying the changes in the full width at the half maximum (FWHM) of each peak. The shift thereof was studied to determine structural change effects as a result of the heat treatment. The eutectoid steel showed a polycrystalline structure which was identified according to the PDF 06–0696 for Fe. Reference Swanson, Gilfrich and Ugrinie22 Results can be summarized by studying FWHM changes. FWHM−1 is an important analysis to determine the crystalline quality whose low values indicate less crystalline quality. Reference Vashista and Paul23
Figure 5(a) shows the crystalline quality values taking the (110) peak for each sample. The highest crystallinity corresponded to the ECS-S sample and the lowest crystallinity to the ECS-N sample, while the ECS-A sample showed an intermediate value. This means that the cooling rate of different heat treatments affected the steel structure, the sample crystallinity, and thermal properties. Reference Vashista and Paul23,Reference Moore and Reynolds24
FWHM−1 characteristic peak changes (110) of eutectoid carbon steel samples (a) FWHM−1 crystalline quality and (b) nanohardness versus FWHM−1.

Figure 5(b) shows the relationship between Vickers nanohardness and FWHM−1 crystalline quality, where a nanohardness increase corresponded to a crystallinity decrease. The inset of this figure shows the (110) peak located at 2θ = 44.5° to 44.6°. It means that the heat process affected the steel structure producing nanohardness changes.
D. PTR thermal images
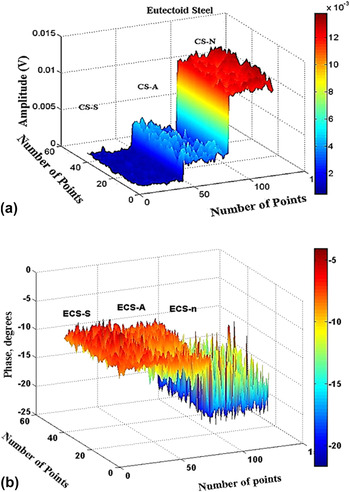
This photothermal technique led to measure amplitude and phase differences on the scanned area, allowing the thermal mapping of studied samples. Figure 6 shows the PTR thermal mapping. Figure 6(a) illustrates the amplitude behavior. The highest amplitude value corresponded to the normalized ECS-N sample, the lowest value belonged to the spheroidized ECS-S, while the ECS-A sample showed an intermediate value. Thermal images were compared to the nanohardness results in Fig. 3. Amplitude results increased as the nanohardness increased. Figure 6(b) represents the phase behavior, where the highest result corresponded to the ECS-S sample and the lowest value belonged to the ECS-N sample. An inverse behavior to the amplitude was observed in the phase signal. Differences depended on optical properties, as the reflectivity; insomuch that the optical properties were modified as a consequence of different heat treatments. The behavior of PTR image changes generated on eutectic carbon steel sample surfaces could be explained by thermal property changes. The PTR signal represents a reference value due to the thermal behavior effect as a result of the heat treatment in steel samples.
PTR images of eutectoid steel samples at different heat treatments: spheroidizing ECS-S, annealing ECS-A, and normalizing ECS-N; (a) amplitude and (b) phase.

E. Diffusivity, heat capacity, and conductivity
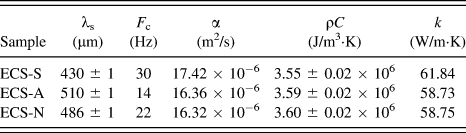
Table II shows thermal diffusivity, heat capacity, and thermal conductivity results of studied samples. The thermal diffusivity is higher in ECS-S than in ECS-A and ECS-N samples. The thermal conductivity behaved similarly to that of diffusivity, as a cooling rate increase corresponded to a conductivity decrease. From thermal relaxation results, the heat capacity decreased as the cooling rate increased. The ECS-N sample showed the highest thermal relaxation value at the fastest cooling rate, while the ECS-S sample showed the lowest heat capacity value at the lowest cooling rate. According to these results, the heat capacity increased as the cooling rate increased.
Results of thermal diffusivity and thermal conductivity of studied samples.

As the crystalline quality decreased, the electron dispersion and the photonic component of the thermal diffusivity increased, according to Fig. 7. Thermal diffusivity and conductivity behaviors could be explained considering that as the cooling rate decreased, the crystallinity increased as a result of the diffusion process in ECS-S and ECS-A samples; while as the cooling rate increased, the diffusion process stopped in the ECS-N sample at a faster cooling rate (not exactly as quenched heat treatment) than in ECS-S and ECS-A samples. Nanohardness and PTR differences were produced by the cooling rate which caused thermal image changes affecting the infrared emission of the metallurgical structure, according to Fig. 6. Reference Guo, Sivagurunathan, Garcia, Mandelis, Giunta and Milletari13–Reference Rosencwaig and Gersho15
Relationship between thermal diffusivity and FWHM−1 of eutectoid carbon steel samples.

IV. CONCLUSIONS
The cooling rate during the heat treatment was the most important parameter in metallurgical properties of the studied eutectoid carbon steel. A direct correlation was found among the heat treatment cooling rate and mechanical, metallurgical, thermal, and structural properties.
Microstructure differences as a result of the heat treatment cooling rate produced significant effects on nanohardness, thermal properties, and crystallinity. It was reflected in PTR images as in thermal conductivity and diffusivity. The amplitude signal increased at the highest cooling rate. It means that as the cooling rate increased, crystallinity, thermal diffusivity, and conductivity decreased.
The cooling rate affected the metallurgical structure directly, and consequently, the Vickers nanohardness because nanohardness decreased due to the solid solution formation and decomposition of the pearlite phase. As the cooling rate increased, the hardness increased modifying structural properties and the steel crystallinity. As the cooling rate decreased, the crystallinity increased.