I. INTRODUCTION
Under-bump-metallization (UBM) plays an important role in developing a reliable connection between semiconductor chip and the package substrate. Most of the printed circuit boards consist of Cu due to its good compatibility with Sn-based lead-free solder.
Reference Kim, Jang, Lee and Tu1
However, Cu as UBM is easy to react with Sn to form a thick layer of brittle Cu–Sn intermetallic compounds leading an inferior mechanical stability. As an alternative, Ni-based UBM such as electroless Ni–P is found to be a promising UBM due to the advantages of good corrosion resistivity, strong adhesion, easy processing, and low cost. Here, the electroless Ni–P is an alloy of Ni and P. The P comes from the hypophosphite-reducing agent,
Reference Park, Gibbons and Arroyave2
and it would cause the complicated interfacial reaction between solder and pad through forming Ni–Sn–P ternary layer.
Reference Chung, Duh and Kao3
Actually, the Ni–Sn–P alloy coating has the superior corrosion resistance, lower porosity, good heat-resistance, and weldability. Therefore, they are widely used in electronic components as leading wire, magnetic recording medium, printed circuit board, and anode material for lithium-ion batteries.
Reference Zhang and Xie4
Nowadays, a great deal of study has been performed on the interaction between the Sn based solder and Ni–P pad.
Reference Kumar, Chen, Mhaisalkar, Wong, Teo and Kripesh5,Reference Lin and Duh6
A ternary Ni–Sn–P compound was reported to form at the solder/Ni–P interface,
Reference Matsuki, Lbuka and Saka7
which would grow not only in the liquid-state aging
Reference Jeon, Nieland, Ostmann, Reichl and Paik8,Reference He, Chen and Qi9
but also in the solid-state aging.
Reference Kumar, He and Chen10
For example, the Ni2SnP layer was formed in the Sn–3.5 wt% Ag–0.7 wt% Cu solder joints with electroless Ni–P interface through the diffusion of Sn into Ni2P.
Reference Kang, Bae, Yoon, Jung, Park and Yang11
Its structure was revealed to be an orthorhombic crystal with the lattice constants of a = 1.2826 nm, b = 0.35943 nm, c = 0.50896 nm, and space group: Pnma.
Reference Furuseth and Fjellvag12
The Ni2SnP formed near the P-rich Ni layer often accompanied with spalling and Kirkendall void in the solder matix.
Reference Kang, Bae, Yoon, Jung, Park and Yang13
The η-Ni3SnP phase was formed between Sn–3.5 wt% Ag solder and Ni–6 wt% P layer.
Reference Hwang, Suganuma, Kiso and Hashimoto14
Zeng prepared the Ni3SnP (a = 0.3915 nm, c = 0.5204 nm, space group: P63/mmc) by melting the constituent element under purified argon.
Reference Zeng15
Keimes et al. reported the hexagonal Ni10SnP3 (a = 0.7674 nm, c = 0.9621 nm, space group:
 $P\bar 3m1$
) in the similar method.
Reference Keimes, Blume, Mewis and Anorg16
Recent years, the ternary Ni–Sn–P phase relations at various temperatures were calculated by Schmetterer et al. through thermo-analytical methods.
Reference Schmetterer, Vizdal, Flandorfer and Ipser17,Reference Schmetterer, Vizdal, Kroupa, Kodentsov and Ipser18
They found that the possible ternary phases were orthorhombic Ni2SnP, hexagonal Ni10SnP3 and triclinic structures of Ni10Sn5P3, Ni13Sn8P3, and Ni10Sn8P3. They also clarified that there was no such intermetallic compound (IMC) as Ni3SnP. So far, controversy about Ni3SnP still exists.
As mentioned above, the ternary Ni–Sn–P phases have been reported in many works. However, as the most important interfacial IMCs, the intrinsic mechanical properties are still unclear. This information is important for the connection of the solder with pad. Moreover, the controversy about the Ni3SnP needs further clarification. From these points of view, the structural, elastic, thermodynamic, and electronic properties of Ni–Sn–P compounds have been studied by performing the first principles calculations based on the density function theory with the view to provide more fundamental interpretation on the physical properties.
Based on the inorganic crystal structure database (ICSD), Ni3SnP crystallizes in a hexagonal structure where Sn and P atom mixed occupied the same position. This structure is failed to calculate by the first-principles method. Chung et al. have calculated the substitution of P for Sn in the hexagonal Ni3Sn2. Reference Chung, Moon, Park, Kim and Choi19 In this work, we use the same method with Chung to perform the first-principle calculation for Ni3SnP. As for the triclinic structures of Ni10Sn5P3, Ni13Sn8P3, and Ni10Sn8P3, it is high cost to perform the first-principles calculation due to the asymmetry of the crystal structure. In addition, as the interfacial IMCs between the Sn based Pb-free solder with the Ni–P pad, there are little reports about the triclinic crystal system, so it is out of our consideration. In present work, we are interested in the crystal structure and mechanical properties of the symmetric structure of the ternary IMCs including Ni2SnP, Ni3SnP, and Ni10SnP3. Meanwhile, Ni2P is also explored for comparison with Ni2SnP. Our findings will provide good reference for the future application of these materials.
II. METHODS AND CALCULATION DETAILS
A. First-principles calculation details
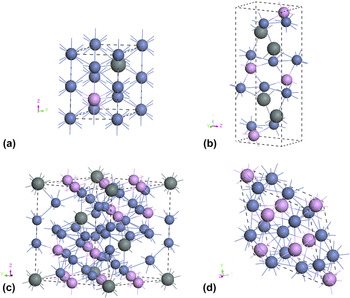
The crystal structures of present work are displayed in Fig. 1. Here, Ni2P, Ni2SnP, and Ni10SnP3 are derived from the ICSD. The structure of Ni3SnP is built by replacing one Sn atom with P in the hexagonal Ni3Sn2 lattice. The equilibrium lattice structures of the Ni–Sn–P IMCs were determined by the ground state calculation through the Vienna ab-initio simulation package (VASP) code. Reference Kresse and Furthmüller20 The exchange-correlation function was treated with the generalized gradient approximation (GGA) of Perdew–Burke–Ernzerhof (PBE). Reference Perdew, Burke and Ernzerhof21 The geometry optimization and total energy calculation were performed using 6 × 3 × 3 Monkhorst–Pack Reference Monkhorst and Pack22 k-point meshes for the hexagonal structure and 6 × 8 × 6 for the orthorhombic structure. Here, tests were carried out using different k-point meshes until the calculated total energy was converged less than 1 × 10⁻⁴ eV/atom. The electronic occupancies were determined according to the Methfessel–Paxton Reference Methfessel and Paxton23 technique with 0.1 eV smearing. The valence atomic configurations were 3d 84s 2 for Ni, 5s 25p 2 for Sn, 3s 23p 3 for P, and the cutoff energy was 400 eV. The convergence threshold of total energy was set to less than 5 × 10⁻⁶ eV/atom. The spin polarized approximation is used on account of the ferromagnetic nature of Ni atoms.
Crystal structures of (a) Ni3SnP, (b) Ni2SnP, (c) Ni10SnP3 and (d) Ni2P (the gray atoms are tins, the navy atoms are nickels and the pink atoms are phosphorus).

B. Structure and elastic properties
To investigate the stability of the Ni–Sn–P IMCs, the formation energies
 $\Delta H$
are calculated according to the following formula:
Reference Yang, Li, Lu, Yu and Chen24
 $$\Delta H = {1 \over N}\left( {{E^{\rm{T}}} - \sum\limits_i {{n_i}{E_i}} } \right)\quad .$$
Here E T represents the calculated total energy of the IMC, n i is the number of atom i contained in the IMC and E i is the per atom energy of atom i in its bulk material, N is the total of n i . In calculation, the structures of the pure metals are adopted a face centered cubic structure of Ni, a tetragonal structure of β-Sn and an orthorhombic structure of black P since the black P are found to appear during the solder process on Ni–P pad. Reference Mei25 It would be energetically favorable from the pure elements to obtain the final compounds if the formation energy is negative.
The single crystalline elastic constants C ij and the polycrystalline elastic properties including the bulk modulus, shear modulus, Young’s modulus, and Poisson’s ratio are important mechanical performance index for the industrial application of material. In present work, a stress–strain approach Reference Shang, Wang and Liu26 is used to the optimized equilibrium crystal structure to calculate the single crystalline elastic constants. The change of the total energy is derived through applying a series of strain δ which ranging from −0.02 to 0.02 at 0.005 intervals. The elastic constants C ij are obtained through a polynomial fit of the strain energy for specific deformation to the crystal structure. There are five independent elastic constants in the hexagonal lattice, namely C 11, C 12, C 13, C 33, and C 44 while nine one in the orthorhombic lattice, namely C 11, C 22, C 33, C 44, C 55, C 66, C 12, C 13, and C 23. For hexagonal crystal system, the elastic constants should meet the following mechanical stability criteria: Reference Cheng, Yu and Chen27
 $${C_{ii}} > 0\left( {i = 1,3,4,6} \right){\rm{;}}\;{C_{11}} - {C_{12}} > 0;\;{C_{11}} + {C_{12}} + {C_{33}} > 0;\;({C_{11}} + {C_{12}}){C_{33}} > 2{C_{13}}^2\quad.$$
For orthorhombic system, it should meet the expressions as below: Reference Du, Wen, Melnik and Kawazoe28
 $${C_{ii}} > 0\left( {i = 1 - 6} \right);\;{C_{11}} + {C_{22}} > 2{C_{12}};\;{C_{22}} + {C_{33}} > 2{C_{23}};\;{C_{11}} + {C_{33}} > 2{C_{13}};$$
 $${C_{11}} + {C_{22}} + {C_{33}} + 2{C_{12}} + 2{C_{13}} + 2{C_{23}} > 0\quad .$$
Now, given that the elastic constants C ij , the upper and lower bounds of the polycrystalline elastic properties such as bulk modulus K and shear modulus G [the subscript V denotes the upper (Voigt) and the subscript R denotes lower (Reuss)] can be obtained by the Voight–Reuss–Hill (VRH) approximation. Reference Cheng, Yu and Chen27
 $${K_{\rm{V}}} = {1 \over 9}\left[ {\left( {{C_{11}} + {C_{22}} + {C_{33}}} \right) + 2\left( {{C_{12}} + {C_{13}} + {C_{23}}} \right)} \right]\quad .$$
 $${K_{\rm{R}}} = {\left[ {{S_{11}} + {S_{22}} + {S_{33}} + 2\left( {{S_{12}} + {S_{13}} + {S_{23}}} \right)} \right]^{ - 1}}\quad .$$
 $${{G_{\rm{V}}} = {1 \over {15}}\left[ {{C_{11}} + {C_{22}} + {C_{33}} - \left( {{C_{12}} + {C_{13}} + {C_{23}}} \right) <$$><$$>+ \,3\left( {{C_{44}} + {C_{55}} + {C_{66}}} \right)} \right]\quad .$$
 $${G_{\rm{R}}} = 15{\left[ {4\left( {{S_{11}} + {S_{22}} + {S_{33}}} \right) - 4\left( {{S_{12}} + {S_{13}} + {S_{23}}} \right) <$$><$$>+ 3\left( {{S_{44}} + {S_{55}} + {S_{66}}} \right)} \right]^{ - 1}}\quad .$$
Here, the S ij is the elastic compliance constants derived through the converse matrix of the elastic constants C ij . We use the Hill’s approximation of the arithmetic average of Voigt and Reuss to assess the polycrystalline bulk module and shear module of the material, namely:
 $$K = {1 \over 2}\left( {{K_{\rm{V}}} + {K_{\rm{R}}}} \right)\quad .$$
 $$G = {1 \over 2}\left( {{G_{\rm{V}}} + {G_{\rm{R}}}} \right)\quad .$$
After that, the Young’s modulus E, Poisson’s ratio ν and hardness H of the ternary IMCs can be calculated through the following expression: Reference Cheng, Yu and Chen27,Reference Du, Wen, Melnik and Kawazoe28
 $$E = {{9KG} \over {3K + G}}\quad .$$
 $$\nu = {{3K - 2G} \over {6K + 2G}}\quad .$$
 $$H = {{\left( {1 - 2\nu } \right)E} \over {6\left( {1 + \nu } \right)}}\quad .$$
C. Elastic anisotropy
The anisotropic factors are important in industrial application of materials since they are usually connected with the micro-cracking in material. To quantitatively describe the degree of anisotropy for the Ni–Sn–P IMCs, the anisotropy factors which account for the elastic stiffness constants are used. Reference Lau and McCurdy29 For hexagonal system, there are two parameters with the following expression
 $${A_1} = {{2{C_{44}}} \over {{C_{11}} - {C_{13}}}},\;{A_2} = {{2{C_{44}}} \over {{C_{33}} - {C_{13}}}}\quad .$$
For orthorhombic crystal system, there are three factors which is expressed as
 $${{A_1} = {{4{C_{44}}} \over {{C_{11}} + {C_{33}} - 2{C_{13}}}},\;{A_2} = {{4{C_{55}}} \over {{C_{22}} + {C_{33}} - 2{C_{23}}}},\;<$$><$$>{A_3} = {{4{C_{66}}} \over {{C_{11}} + {C_{22}} - 2{C_{12}}}}\quad .$$
The nanostructure would be an isotropic material if A i = 1, otherwise, it would be anisotropic, and a larger deviation from one would be representative a higher elastic anisotropy.
A dimensionless coefficient A E also can be used to investigate the degree of anisotropic through the projection of the directional Young’s modulus with the following expression:
 $${A_{\rm{E}}} = {{{E_{\max }} - {E_{\min }}} \over {{E_{\max }} + {E_{\min }}}}\quad .$$
The value of A E is always positive, and its zero value means the elastically isotropic crystals.
D. Thermodynamic properties
Debye temperature which is related with the vibration mode, heat capacity, and interatomic bonding of the crystal is an important thermodynamic parameter of material. Generally speaking, the quantum effect in a solid is more remarkable below the Debye temperature, while it would be neglected above this temperature. A higher Debye temperature often indicates better thermal conductivity ability. The Debye temperature can be derived through the elastic wave velocity. Reference Zhang, Ying and Li30
 $${\theta _{\rm{D}}} = {h \over {{k_{\rm{B}}}}}{\left( {{{3n{N_{\rm{A}}}\rho } \over {4\pi M}}} \right)^{{1 \over 3}}}{v_{\rm{m}}}\quad .$$
In this expression, h is the planck’s constant, k B is Boltzmann’s constant, and N A is Avogadro’s constant, ρ is the density of material, M is the molar mass and n is the total number of atoms in the molecular, v m is the averaged elastic wave velocity which can be derived from the transverse elastic wave velocity v t and longitudinal one v l through the following equation:
 $${v_{\rm{m}}} = {\left[ {{1 \over 3}\left( {{2 \over {\mathop {{v_{\rm{t}}}}\nolimits^3 }} + {1 \over {\mathop {{v_{\rm{l}}}}\nolimits^3 }}} \right)} \right]^{ - {1 \over 3}}}\quad .$$
 $${v_{\rm{t}}} = {\left( {{G \over \rho }} \right)^{{1 \over 2}}}\quad .$$
 $${v_{\rm{l}}} = {\left( {{{3K + 4G} \over {3\rho }}} \right)^{{1 \over 2}}}\quad .$$
The thermal conductivity coefficient is often used to quantify the heat transfer ability of a material so as to make it clear whether the material is an intrinsic thermal barrier coating or not. Since the thermal conductivity will decrease with increasing temperature at high temperatures, it is useful to determine the minimum value at high temperature for exploring the application of materials under extreme conditions. Both of the Cahill’s model and Clark’s model can give the material’s lower limit of the thermal conductivity. For Cahill’s model, the minimum thermal conductivity can be expressed as Reference Cahill, Watson and Pohl31
 $${k_{\min }} = {{{k_{\rm{B}}}} \over {2.48}}{n'^{{3 \over 2}}}\left( {2{v_{\rm{t}}} + {v_{\rm{l}}}} \right)\quad .$$
For Clark’s model, it is Reference Clarke and Levi32
 $${k_{\min }} = 0.87{k_{\rm{B}}}{M_{\rm{a}}}^{ - {2 \over 3}}{E^{\;{1 \over 2}}}{\rho ^{{1 \over 6}}}\quad .$$
Here, n′ is the number of atoms per unit volume. M
a is the average mass per atom. The two parameters can be derived from
 $n' = {{\rho n{N_{\rm{A}}}} \over M}$
and
 ${M_{\rm{a}}} = {M \over {n{N_{\rm{A}}}}}$
, respectively, in which n and M have the same meaning with those in Eq. (15).
III. RESULTS AND DISCUSSIONS
A. Structure and phase stability
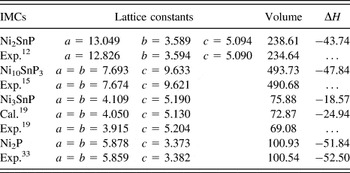
For the Ni–Sn–P IMCs, the optimized lattice constants together with the available experimental and theoretical data are tabulated in Table I. Through comparison, it is found that the calculated lattice parameters of present work have very small errors compared with the experimental results with the biggest deviation of less than 2%, proving the reasonability of our computational method. The calculated formation energies for these Ni–Sn–P IMCs are also displayed in Table I. Chung derived the formation energy of Ni3SnP is −258.566 meV/atom (corresponding to −24.94 kJ/mol atoms) which has an absolute departure of 6.37 kJ/mol atom with our results, demonstrating the rationality of our calculated model. As for the other two ternary phases, there are no any experimental or calculation reports about the formation energy, so our findings can’t be checked. But their more negative formation energies prove the structures of Ni2SnP and Ni10SnP3 are more energetically favorable than Ni3SnP. As for Ni2P, there is a good agreement between the present work and the literature reported value, Reference Zhao, Zhou, Du, Wang, Peng, Kong, Sha, Ouyang and Zhang33 again proved our rational calculation scheme.
The equilibrium structural properties [including lattice constants (Å), volume (Å3) and heats of formation ΔH (kJ/mol atoms)] for Ni-Sn-P IMCs in present work and other references.

B. Elastic stability and polycrystalline elastic modulus
According to the report of Kang, the Ni2SnP layer between Sn–3.5Ag–0.7Cu solder and electroless Ni–P pad was formed through Sn diffusing into Ni2P during annealing in transmission electron microscopy. Reference Kang, Bae, Yoon, Jung, Park and Yang11 To deep understand the mechanical properties of the interfacial IMCs, the elastic properties of Ni2P was also calculated. The obtained single–crystal elastic constants for the interfacial Ni–Sn–P IMCs together with the available theoretical results about Ni2P Reference Zhao, Zhou, Du, Wang, Peng, Kong, Sha, Ouyang and Zhang33 are displayed in Table II.
Calculated elastic stiffiness (C ij ) for Ni–Sn–P IMCs (unit in GPa).

As shown in Table II, the values of the calculated elastic constants meet the corresponding mechanical stability criterion of Eqs. (2) and (3) except Ni3SnP, since it don’t meet the stability criteria of
 ${C_{11}} - {C_{12}} > 0$
and
 ${C_{44}} > 0$
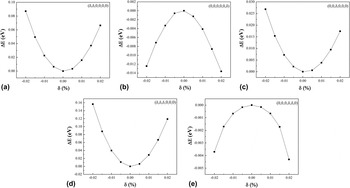
of the hexagonal structure. Actually, the curves of energy difference versus the strain shown in Fig. 2 present an abnormal variation trend when some strain mode is applied for the optimized lattice. For example, the two stain modes of (0,0,0,0,0,δ) and (0,0,0,δ,δ,0) lead to the increase of the absolute energy difference with the increasing strain which results in the highest energy at the zero strain. Thus, the opening direction of the two quadratic function curves is downward. It means the crystal structure of Ni3SnP is elastically instability. Combined with the formation energy, it can be said that Ni3SnP can form as an interfacial IMC but it is theoretically elastically instability. Maybe, it would be formed with the help of external stimuli, for example, the high temperature and high pressure. Thus, what Schmetterer’s clarification of Ni3SnP can’t be formed is an arbitrary decision to some extent. As for the orthorhombic crystal of the Ni2SnP, altogether nine strain modes would be applied to the equilibrium lattice to derive the single elastic constants, namely (δ,0,0,0,0,0), (0,δ,0,0,0,0), (0,0,δ,0,0,0), (0,0,0,δ,0,0), (0,0,0,0,δ,0), (0,0,0,0,0,δ), (δ,δ,0,0,0,0), (0,δ,δ,0,0,0), and (δ,0,δ,0,0,0). All of the strain modes induced an increasing energy difference with the strain, implying the elastic stability of Ni2SnP.
Energy difference versus the strain for Ni3SnP in the stain of (a) (δ, δ,0,0,0,0), (b) (0,0,0,0,0,δ), (c) (0,0,δ,0,0,0), (d) (δ, δ,δ,0,0,0), and (e) (0,0,0,δ,δ,0).

According to the equations of (4) to (12), the polycrystalline elastic modulus are derived and displayed in Table III. Since no available experimental data about the bulk modulus and shear modulus of the ternary IMCs, our calculation results cannot be checked. But for Ni2P, our calculation results are in consistence with Ref. Reference Zhao, Zhou, Du, Wang, Peng, Kong, Sha, Ouyang and Zhang33. Through comparison, the elastic modulus of Ni2SnP has a large difference from Ni2P, especially in the bulk modulus. The bulk modulus reflects the properties of material’s resistance to the external deformation. When Sn atom diffused into Ni2P, the bulk modulus decrease rapidly from 197.4 GPa to 122.8 GPa due to forming Ni2SnP. This would cause the lattice mismatch of Ni2SnP with Ni2P, and lead to the spalling of Ni2SnP which would seriously affect the reliability of solder joint with pad. Reference Kang, Bae, Yoon, Jung, Park and Yang11
The bulk modulus, shear modulus, Young’s Modulus, Poisson’s ratio ν, ratio of bulk modulus to shear modulus K/G and micro hardness parameters H for the polycrystalline Ni–Sn–P IMCs; all in GPa except for v, A Z and K/G (dimensionless).

To estimate the ductile or brittle properties of these interfacial IMCs, the Poisson’s ratio ν and Pugh’s criterions (K/G) are used. Based on the Poisson’s ratio ν, a very larger or smaller than 0.26 is associated with ductility or brittleness, respectively. Reference Lau and McCurdy29,Reference Li, Zeng and Chen34 In view of Pugh’s criterion, Reference Pugh35 a value of higher or lower than 1.75 is connected with ductility or brittleness. It can be seen from Table III that the Poisson’s ratio ν are all above 0.26, and the K/G are all higher than 1.75, which means these Ni–Sn–P IMCs are all ductile materials. However, the brittleness increases after Sn diffusion into Ni2P due to the lower of ν and K/G of Ni2SnP. As aforementioned in the section of introduction, the formation of Ni2SnP often accompanied with spalling and Kirkendall void in the solder matrix. It is necessary to believe that the grain boundaries were existed between the solder and the interfacial compounds. It is the reason of the brittle performance.
The microhardness parameter H is used to estimate the stiffness of the polycrystalline structures. The calculated microhardness values are also tabulated in Table III. It is found that the microhardnesss values are all lower than 7 GPa, indicating the lower stiffness of the materials. Among them the ternary IMCs have a higher hardness especially for Ni2SnP.
C. Anisotropic properties
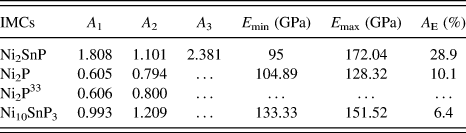
According to Eq. (13), the anisotropic factors are derived and listed in Table IV. The Ni–Sn–P IMCs are all elastic anisotropic but Ni10SnP3 phase is more close to be isotropic since the value of A 1 is close to one. As for Ni2SnP, it has a larger degree of elastic anisotropic factors than Ni2P, meaning the more anisotropic properties of Ni2SnP.
Calculated elastic anisotropic factors (dimensionless) together with the projected minimum and maximum Young’ modulus.

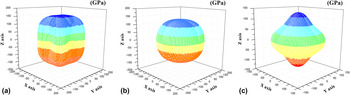
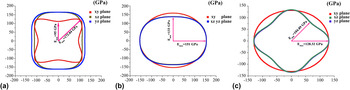
The degree of anisotropic can be reflected by a three-dimensional (3D) graphic of the directional elastic modulus because an isotropic crystal system would be a spherical in shape while an anisotropic crystal system often accompanies with a large deviation from sphere. To visualize the elastic anisotropy of the Ni–Sn–P IMCs, a 3D graphic of the directional elastic modulus are shown in Fig. 3. It can be seen that the 3D shape of the Ni10SnP3 is very close to be a spherical. However, it is formed several convex sections for Ni2SnP and some concave parts for Ni2P, denoting the anisotropic properties of the two IMCs to some extent. To further investigate the direction anisotropy of these IMCs, the projections on the major planes are collected which are shown in Fig. 4. Through it, the maximum and minimum Young’s modulus of the crystal can be derived. The calculated A E is 6.4%, 10.1%, and 28.9% for Ni10SnP3, Ni2P, and Ni2SnP, respectively. So it can be said that the Ni2SnP is the most anisotropic one among the three IMCs which is in agreement with the finding from the anisotropy factors.
Direction dependence of Young’s modulus for Ni-Sn-P IMCs (a) Ni2SnP, (b) Ni10SnP3, and (c) Ni2P (unit: GPa).

Projection of the directional dependence of Young’s modulus for Ni–Sn–P IMCs (a) Ni2SnP, (b) Ni10SnP3, and (c) Ni2P (unit: GPa).

D. Heat transfer properties
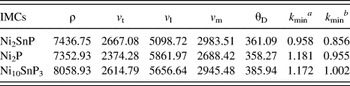
To estimate the heat transfer properties of these Ni–Sn–P IMCs, the density, elastic wave velocity, Debye temperature, and minimum thermal conductivity parameters are tabulated in Table V. We notice that both of the Ni–Sn–P IMCs have the higher Debye temperature, meaning the better thermal conductivity of the ternary IMCs. In addition, the Debye temperature of Ni2SnP is slightly higher than Ni2P, meaning the preferably thermal conductivity of Ni2SnP at the lower temperature. The Debye temperature also serves as a proof to characterize the strength of covalent bonds in solids. Thus, it can be deduced that the covalent bond in Ni2SnP is stronger than that of Ni2P.
The density (in kg/m3), elastic wave velocity (in m/s), Debye temperature (in K) and minimum thermal conductivity (in W/m K) at 0 K and 0 GPa for the polycrystalline Ni–Sn–P IMCs.

k min a denote the Cahill’s model.
k min b denote the Clarke’s model.
Generally speaking, the Clark’s model gives the lower estimate for the thermal conductivity than Cahill’s model since the contribution from the optical phonon can’t be considered. Reference Duan, Sun and Lu36 Our results give a strong evidence since all of the values of the Clark’s model listed in Table V are lower than Cahill’s model. Although the higher Debye temperature often accompanies with higher minimum thermal conductivity through the reported literature, Reference Deng37 it is not always the case. For example, Ni2SnP possesses the higher Debye temperature but lower minimum thermal conductivity than Ni2P. In fact, the minimum thermal conductivity manifests the materials properties at the temperature of higher than Debye temperature, and it would be independent of temperature since the phonon mean free path tends to the lattice parameter. Reference Cahill, Watson and Pohl31 Through browsing the literature, we found some materials also present in the same trend with our present work. For instance, the L12-TiAl3 has a higher Debye temperature but a lower minimum thermal conductivity than L12-Ti(Al, Pt)3 in Duan’s work. Reference Duan, Sun and Lu36 It can be said that a thin and continuous of Ni2SnP would be helpful to the reliability of the solder with pad at lower temperature. However, the ternary compound would form at a faster rate during the aging treatment so that the heat is not easy to transfer from the solder to pad. Thus, the aggregation of the heat is formed and most of fractures occurred at the interface.
E. Electronic structure
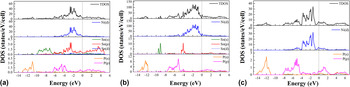
The total density of state (TDOS) and partial density of state (PDOS) of the Ni–Sn–P IMCs presented in Fig. 5 are obtained by the density functional band-structure calculation so as to further illustrate the basic feature of the chemical bonding. All of the compounds are nonmagnetic due to the calculated zero magnetic moments. Through Fig. 5, Ni2SnP, Ni10SnP3, and Ni2P are all metallic due to the nonzero of the TDOS at the Fermi level. It is obviously that the densities of states of the three IMCs are mainly contributed by the Ni-d electrons. Below the Fermi level, the valence band of the two ternary IMCs can be roughly separated into three parts due to the different contribution of electrons from the PDOS. For Ni2SnP, the density of state at the lowest range of −13.2 eV to −10.6 eV is mainly dominated by P-s band, Sn-s state becomes the main donator from −9.8 eV to −6.7 eV, and the weak hybridization of Ni-d, Sn-p and P-p electrons can be observed at the higher energy range of −6.5 eV to Fermi level. For Ni10SnP3, the separate region beneath the Fermi level is more obvious due to the discontinuous of the PDOS. Through comparison of the density of state of Ni2SnP with that of Ni2P, we can find the hybridization of Ni-d, Sn-p and P-p electrons at the range of −4 eV to Fermi level become obvious after Sn diffused into Ni2P, meaning the stronger interatomic bonding of Ni, Sn, and P.
TDOS and PDOS of (a) Ni2SnP, (b) Ni10SnP3 and (c) Ni2P (the dashed lines at 0 eV are denoted the Fermi level E f).

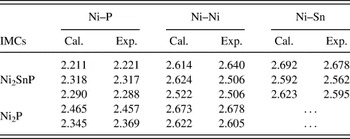
In fact, there is a mixture of Ni–P, Ni–Ni, and Ni–Sn bonding in the lattice of Ni2SnP as presented in Fig. 1(b), and both of the bond lengths of Ni–P and Ni–Ni are shorter than those in Ni2P. To make it clear of the bond character, the bond lengths of Ni2SnP and Ni2P are displayed in Table VI. It is known to us all that the short length means the strong bond strength. Thus, the bond strength of Ni–P and Ni–Ni in Ni2SnP is stronger than in Ni2P which agree with the deduction from Debye temperature. The structure of Ni2SnP shown in Fig. 1(b) can be roughly described as two stagger arrangement layers along the 〈1 0 0〉 direction. One layer contains interconnected polyhedron formed by a center Ni atom and its two nearest neighbors Ni and one nearest neighbor P and Sn atoms, another layer contained a center Ni atom and its neighbor Ni, P, and Sn atoms. Thus, a mixture of Ni–Ni and Ni–P bonding exists in each layer, and the neighbor layers are coupled with Ni–Sn bonding. The directional bonding makes the uniaxial strain along the 〈1 0 0〉 and its perpendicular plane difficult in the lattice of Ni2SnP and results in the relative high degree of elastic anisotropy as discussed in Sec. III. C.
Bond length of Ni2SnP and Ni2P (unit in Å).

Here, the experimental values of Ni2SnP and Ni2P are derived according to the experimental structures given in Refs. Reference Furuseth and Fjellvag12 and Reference Zhao, Zhou, Du, Wang, Peng, Kong, Sha, Ouyang and Zhang33, respectively.
IV. CONCLUSIONS
The IMCs of Ni3SnP, Ni2SnP, Ni10SnP3, and Ni2P are computed by the first-principles calculations to obtain the mechanical, thermodynamic, and electronic properties of these materials. The calculated lattice parameters of the four IMCs have a good agreement with the reported experimental data. They are all thermodynamic stable but Ni3SnP is elastically unstable. The bulk modulus decreases but shear modulus, Young’s modulus, and hardness increases after Sn diffuses in Ni2P. The Ni2P, Ni2SnP, and Ni10SnP3 are all ductile materials. However, Ni2SnP is more brittle relative to Ni2P. A 3D surface directional dependence of Young’s modulus was used to show the variation of the elastic modulus with the crystallographic direction. The Ni10SnP3 is more close to be elastic isotropic while Ni2SnP has the largest degree of anisotropic among the three IMCs. The thermal conductivity is investigated through the Debye temperature, Cahill’s model and Clark’s model. The Debye temperature follows the sequence of Ni10Sn5P3 > Ni2SnP > Ni2P. According to the Clark’s model, the minimum thermal conductivity is ranked as Ni10Sn5P3 > Ni2P > Ni2SnP, which means the heat transfer property of Ni2SnP becomes lower than Ni2P when the temperature is higher than Debye temperature. The origin of the elastic anisotropy of Ni2SnP is analyzed by the electronic density of states. These findings will provide a good reference for the future application of these materials.
ACKNOWLEDGMENTS
This work was supported by the National Natural Science Foundation of China (51572190), and the super computing resources were supported by High Performance Computing Center of Tianjin University, China.