





Double burden of malnutrition in children
The double burden of malnutrition (DBM), characterised by the coexistence of undernutrition (stunting, wasting and micronutrient deficiencies) alongside overweight and obesity, represents a critical global health challenge(Reference Demekas, Prytherch and Bayisenge1–Reference Franco and Fajó-Pascual5). This dual burden is a leading risk factor for diet-related non-communicable diseases and contributes significantly to global morbidity and mortality(Reference Demekas, Prytherch and Bayisenge1,Reference Venegas Hargous, Strugnell and Allender6,Reference Iannotti, Kleban and Fracassi7) . The rise in the DBM is closely linked to the ongoing nutrition transition, where dietary patterns shift from traditional diets to processed, calorie-dense and nutrient-poor foods(Reference Nel and Steyn8). Urbanisation, sedentary lifestyles, reduced physical activity and limited access to affordable, nutritious food exacerbate this complex landscape(Reference Nel and Steyn8).
Although the DBM affects individuals across life stages, children and adolescents are particularly vulnerable(Reference Pehlke, Letona and Hurley4). Childhood and adolescence are critical phases of growth and development, marked by heightened macro- and micronutrient needs to support rapid physical and mental growth(Reference Choedon, Brennan and Joe9). Inadequate nutrition during these periods can lead to lifelong health risks(Reference Choedon, Brennan and Joe9). Malnutrition, encompassing both overweight/obesity and undernutrition, in children is associated with increased susceptibility to communicable and non-communicable diseases, weakened immune function, delayed motor development, impaired cognition, compromised reproductive health and elevated mortality rates(Reference Iannotti, Kleban and Fracassi7,Reference Roothaert, Mpogole and Hunter10,Reference Nhlapo, Lues and Kativu11) . Undernutrition manifests as stunting (low height-for-age), underweight (low weight-for-age) and wasting (low weight-for-height), typically caused by insufficient protein-energy intake(Reference Iannotti, Kleban and Fracassi7,12) . Micronutrient deficiencies, which result from inadequate intake of essential vitamins and minerals, affect over half of preschool-aged children worldwide(Reference Iannotti, Kleban and Fracassi7).
While the prevalence of undernutrition has declined globally over the last 30 years, particularly in low- and middle-income countries, the rates of childhood overweight (BMI-for-age greater than 1 sd above the WHO Growth Reference median) and obesity (BMI-for-age greater than 2 sd above the WHO median) have continued to rise(Reference Pehlke, Letona and Hurley4,12) . From 1990 to 2022, the prevalence of overweight among children and adolescents surged from 8 % to 20 %, with over 390 million children and adolescents overweight in 2022(12). Overweight and obesity primarily result from an imbalance between energy intake and expenditure, influenced by obesogenic environments, psychosocial factors, genetic predispositions and structural barriers, such as limited access to healthy, affordable foods and opportunities for physical activity(12). These conditions often persist into adulthood, significantly increasing the risk of developing non-communicable diseases, including CVD, diabetes, chronic respiratory diseases, digestive disorders, neurological disorders and certain cancers(12–Reference Jeruszka-Bielak and Górnicka14). Additionally, childhood obesity increases the risk of developing psychosocial and emotional problems and disorders, which adversely influence school performance and quality of life(12,Reference Jeruszka-Bielak and Górnicka14) .
Role of school meal programmes
These adverse effects associated with the DBM highlight the need for comprehensive, scalable programmes that support adequate nutrient intake during childhood. Children spend a significant portion of their waking hours at school, and school meal programmes, which can provide 20–70 % of children’s daily energy needs, are uniquely positioned to shape dietary habits and preferences(Reference Cohen, Hecht and McLoughlin15–Reference Eustachio Colombo, Elinder and Patterson17). School meal programmes have been recognised as essential safety nets with documented impacts across social protection, educational, health and nutritional dimensions(Reference Wineman, Ekwueme and Bigayimpunzi18,Reference Fernandes, Galloway and Gelli19) . These programmes can serve as double-duty actions for addressing the DBM(Reference Giancola, Hauerslev and Ndinda2,Reference Choedon, Brennan and Joe9,Reference Fernandes, Galloway and Gelli19) . Double-duty actions, grounded in the notion that under- and overweight/obesity share common drivers, encompass cross-sector actions that target all forms of malnutrition simultaneously(Reference Demekas, Prytherch and Bayisenge1). Reaching at least 408 million children in 148 countries, school meal programmes can be leveraged as meaningful opportunities to improve dietary quality, enhance child nutrition and reduce the global DBM(Reference Cohen, Hecht and McLoughlin15,Reference O’Mahony, Kerins and Murrin16,Reference Bryant, Burton and O’Kane20–Reference Górnicka, Keser and Kaleta22) .
Gaps in school meal quality data
The effectiveness of school meal programmes depends on the quality of their food baskets (the collection of food items and ingredients included in planned menus provided to schoolchildren)(23). School meal programmes are incredibly complex and diverse, differing across and within countries(Reference O’Mahony, Kerins and Murrin16,Reference Gelli and Suwa24) . Programmes vary by scope (national, regional and local), geographic setting (urban, suburban and rural), modality (in-school meals, in-school snacks and take-home rations), meal frequency and type (breakfast, lunch, snack and dinner), procurement sources (local farms, school gardens, community provision and private suppliers), inclusion of fortified or biofortified foods and costs(Reference Franco and Fajó-Pascual5,Reference O’Mahony, Kerins and Murrin16,25) . Therein, school food basket contents are also diverse. School food baskets are typically set by menus – a defined list of one or more dishes planned as a vehicle to ensure that school meals meet their proposed aims(Reference Cupertino, Maynard and Queiroz26).
However, data on school menu quality remain limited, hindering efforts to design and implement effective programmes tailored to diverse populations and nutritional needs. Existing studies primarily focus on school feeding coverage or qualitative aspects of meal quality, such as assessments of frequency or variety, with few rigorously evaluating meal or menu quality(Reference Cupertino, Maynard and Queiroz26,Reference Sabinsky, Toft and Andersen27) . This study provides a cross-country review of the quality of school meal programme menus, focusing on nutrient composition and menu quality. Specifically, this research addresses the following questions:
-
How does the nutritional quality of school meals and menus compare across countries?
-
How does school meal and menu quality vary by age group (preschool, primary and secondary) and meal type (breakfast, lunch and snack)?
-
What factors contribute to variations in school meal and menu quality?
To our knowledge, this is the first study to jointly apply nutrient composition analysis and food-based quality assessment to a cross-country school menu dataset, offering a multidimensional lens for evaluating school meal quality and addressing the DBM. It is also among the first to apply the Global Diet Quality Score (GDQS)-Meal and -Menu metrics to real-world cases and the first to apply these metrics to school menus across a wide range of country income levels.
Methods
Data collection
Data on school meals were collected from the Global Child Nutrition Foundation’s (GCNF) 2024 Global Survey of School Meal Programs (GSSMP), supplemented by a grey literature search drawing from in-country stakeholders and programme websites to identify additional menus. The grey literature search followed a structured protocol involving multilingual Google searches using country and programme names and exploration of relevant ministry websites. Launched in 2019 and repeated in 2021 and 2024, the GSSMP collects detailed information on national- or large-scale school meal programmes(Reference Wineman, Ekwueme and Bigayimpunzi18,25,Reference Ferrero, Wineman and Mitchell28) . The 2024 GSSMP also gathered sample menus or guidelines, providing a direct look at the food baskets planned for schoolchildren. The 2024 survey received a response from 142 country governments, with 125 reporting large-scale school feeding activities and sharing detailed information on 207 individual school meal programmes(21). A total of twenty-one quantitative programme menus with adequate menu data were identified from the survey responses, and an additional ten menus were identified through the grey literature search.
An extraction sheet was developed to systematically analyse survey responses. Responses were reviewed to identify age groups served (preschool, primary and secondary), menu type (menu – a set of meals served over a specified time period, meal – breakdown of a single eating occasion which may include multiple dishes and foods or food – an unstructured list of food items served), meal types (breakfast, lunch and snack), data type (quantitative/qualitative) and the number of days of information. Age group classifications and meal types varied from country to country, but, generally, preschool corresponded to approximately 3–5 years, primary to 5–9 years and secondary to 10 years or older(25). Country focal points were contacted for missing information or additional clarification as needed. Menus not in English, German or French were translated using Google Translate, and programme-level quantitative menu and recipe data were extracted.
Data analysis
Food basket items were matched to the United States Department of Agriculture’s (USDA) food composition table (FCT) (SR Legacy) using Excel, which retrieved the relevant USDA food codes and nutritional values(29). FCT provide the nutrient composition of commonly available and consumed foods(Reference Fernandes, Galloway and Gelli19,29) . USDA’s FCT is among the most widely used and internationally recognised nutrient databases, offering standardised and comprehensive nutrient profiles of a wide variety of foods(Reference Merchant and Dehghan30). While region-specific FCT are often ideal, they do not always offer complete or standardised data(Reference Merchant and Dehghan30). Additionally, cross-country comparisons are prone to error when different FCT are used to estimate nutrient intake(Reference Merchant and Dehghan30). The matched FCT-food basket items were analysed using statistical software R (version 4.3.1).
Nutritional content was compared to a combination of Nutrient Reference Values (NRV). Primary comparisons used Harmonized Average Requirements – harmonised NRV by nutrient, age group and sex designed for global intake assessments across populations(Reference Allen, Carriquiry and Murphy31). However, Harmonized Average Requirements do not include energy or macronutrient references, so energy content was assessed using FAO/WHO/UNU Expert Consultation Human Energy Requirements, and macronutrients compared to the Dietary Reference Intakes and WHO guidelines, which offer age- and sex-specific guidance widely used in both research and policy(Reference Allen, Carriquiry and Murphy31–34). One challenge in establishing universal nutrient requirements for school meals is the variation in age groups served, making it difficult to apply a single cut-off across all students. Although there is no universally accepted standard for school meal nutrient contributions, most national and global school meal frameworks recommend that meals contribute at least 30 % of children’s daily nutrient intake(Reference Fernandes, Galloway and Gelli19,Reference Lagarde, LeBlanc and McKenna35–38) .
The GDQS-Meal and -Menu metrics were applied to assess meal and menu quality based on the intake of twenty-five food groups (sixteen healthy food groups, seven unhealthy food groups and two food groups that are healthy when consumed in moderation but unhealthy when consumed in excess), the presence of fortification and/or biofortification and the diversity of healthy food groups(Reference Bell, Blakstad and Milani39). These food-based metrics, designed for global school meal programmes applications, offer comprehensive standardised assessments of meal and menu quality across different countries and regions(Reference Bell, Blakstad and Milani39). By evaluating both healthy and unhealthy components, this dual perspective reflects both sides of the DBM(Reference Bell, Blakstad and Milani39).
The GDQS-Meal awards points for the presence of healthy foods (GDQS-Meal+), the absence of unhealthy foods (GDQS-Meal-), the inclusion of fortified and biofortified foods considering sixteen different micronutrients (GDQS-Meal Fortification/Biofortification) and the diversity of healthy food groups (GDQS-Meal Food Group Diversity). The total score is calculated by adding all the sub-metrics (GDQS-Meal+, GDQS-Meal-, GDQS-Meal Fortification/Biofortification and GDQS-Meal Food Group Diversity) for a maximum raw score of 83 and a maximum scaled score of 100. All raw scores are translated into a scaled score, which is used for reporting and benchmarking purposes(Reference Bell, Blakstad and Milani39). The GDQS-Menu extends this assessment to multiple meals over a defined period (2–7 d, defined by user)(Reference Bell, Blakstad and Milani39). It calculates the average GDQS-Meal+ and GDQS-Meal- scores across the menu period and adds points based on the total number of distinct fortificants/biofortificants and healthy food groups included across days (GDQS-Menu+, GDQS-Menu-, GDQS-Menu Fortification/Biofortification and GDQS-Menu Food Group Diversity).
Both GDQS-Meal and -Menu metrics are age-specific, with gram-based food group thresholds for three age groups: 24–59 months, 5–9 years and 10+ years. Meals and menus are not expected to achieve a full 100 points, as the scoring is not designed to prescribe ideal meals or menus. Rather, it is designed to evaluate the healthiness of diverse meals and menus, achievable through various combinations of foods, food groups and fortificants/biofortificants considering cultural preferences and contextual factors. Nutritional quality is interpreted using GDQS-specific benchmarks: scores below 22 reflect low nutritional quality, scores between 22 and 35 reflect medium quality and scores of 35 or higher indicate high nutritional quality(Reference Bell, Arsenault and Deitchler40).
Since some programmes serve multiple meals per day (breakfast, lunch and snacks), modified versions of the GDQS-Meal and -Menu metrics were developed to generate a more comprehensive daily nutritional profile. These Modified GDQS-Meal and -Menu metrics were calculated by including all meals and food items served on a given day across all meal types to create aggregate daily scores by programme. All GDQS-Meal and -Menu metrics, including the Modified GDQS-Meal and -Menu metrics, were calculated using the GDQS-Meal and -Menu Metric Data Collection and Tabulation Excel Tool, which is designed to ensure easy and efficient collection and tabulation of the metrics(41).
Several assumptions were made when matching food baskets to the FCT and GDQS food lists. For programmes with multiple weeks of data, it was assumed each week was nutritionally comparable, so the first week was used for analysis. Additionally, it was assumed that fortified foods, when listed, would be fully implemented, regardless of the scale of implementation. For ambiguous food item matches, the most common variant was selected based on context. Approximate equivalents were used when items had no GDQS or USDA FCT match. When not specified, foods were assumed cooked unless typically served raw (i.e. fruits and salads).
Results
Descriptive statistics
In total, thirty-one programme menus were included in the analysis across twenty-nine countries. Countries with more than one programme had distinctions based on age group or meal type; for instance, one country operated separate programmes for preschool and primary students, while another had distinct programmes for breakfast and lunch. Although some countries, including India, Canada and the USA, have decentralised school meal programmes with state- or province-level variations, only identified subnational programme menus were included. Descriptive statistics for each country are presented in Table 1. Additional information on programme universality and targeting criteria is provided in Appendix A. School meals and menus were evaluated across three age groups (preschool, primary and secondary) and three meal types (breakfast, lunch and snack).
Characteristics of school meal programmes by country

* LIC, low-income country; UMIC, upper-middle-income country; LMIC, lower-middle-income country; HIC, high-income country.
† GSSMP, Global Survey of School Meal Programs.
‡ Programmes may serve meals to additional child age groups; however, only those with identified menus for specific age groups are included.
§ Programmes may serve additional meal types; however, only meal types with identified menus are included.
The majority of countries represented were from Europe and Central Asia (n 6), followed by Latin America and Caribbean (n 5), sub-Saharan Africa (n 5), South Asia (n 5), East Asia and& Pacific (n 3), Middle East and North Africa (n 3) and North America (n 2). The income distribution of countries (based on the World Bank classification) included three low-income countries (LIC), twelve lower-middle-income countries (LMIC), seven upper-middle-income countries (UMIC) and seven high-income countries (HIC).
Primary-age meals were the most common (found in 100 % of programmes), followed by preschool (45 %) and secondary-age meals (41 %). Most countries (79 %) offered lunch, while breakfast (28 %) and snacks (21 %) were less common. A majority of countries (76 %) had a 5-d menu, four reported 6-d menus, two reported 4-d menus and one provided a 7-d menu. Two countries provided 1-d menus but indicated that meals were provided 5 d a week; in these cases, the 1-d menu was extrapolated to represent a typical 5-d offering.
Overall quality of school meals
Nutrient composition analysis
Table 2 presents the mean daily nutritional composition of school meals across the twenty-nine countries, averaged across age groups, alongside the NRV percentage achieved for each nutrient. Appendix B provides a complete table of the total daily nutritional composition of school meals disaggregated by day, age and meal type. Figure 1 presents boxplots of the distribution of NRV percentages for each nutrient overall and disaggregated by age group and meal type.
Mean daily nutritional composition of school meals by country averaged across age groups with percentage of Nutrient Reference Value (NRV) achieved

* RAE, Retinol Activity Equivalents; DFE, Dietary Folate Equivalent.
Distribution of Nutrient Reference Value (NRV) percentage achieved by each nutrient overall and disaggregated by age and meal type.

Across all meals and age groups, most nutrients met or exceeded 30 % of the NRV, aligning with global standards recommending meals provide at least one-third of daily nutritional needs(Reference Fernandes, Galloway and Gelli19,Reference Lagarde, LeBlanc and McKenna35–38) . Certain micronutrients were consistently provided in abundance: folate had the highest average contribution (124 %), followed by vitamin B12 (85 %) and vitamin C (82 %). Protein (61 %) and total sugar (43 %) also exceeded 30 % of daily recommended values. Energy (25 %), saturated fat (24 %), fibre (23 %), total fat (22 %) and Na (22 %) achieved the lowest NRV contributions. Ca was also comparatively low, with a mean NRV of 35 %.
By age group, preschool-aged children received the most nutrient-dense meals relative to their needs, averaging 70 % of NRV, followed by primary schoolchildren (62 %), with secondary schoolchildren faring less well (43 %). Among preschool meals, the highest contributions came from folate (182 %), vitamin C (111 %) and vitamin B12 (110 %), while fibre was the lowest at 26 %. Primary school meals also had strong contributions from folate (118 %) and vitamin B12 (107 %). In contrast, secondary school meals had lower contributions overall, with vitamin C at 63 %, Ca at 29 % and Fe at 38 %. Secondary school lunches and snacks were less frequently fortified, resulting in lower nutrient density relative to needs, particularly for micronutrients. Concurrently, secondary school meals had lower total sugar (30 %) and saturated fat (22 %) contributions than primary and preschool meals (39 % and 41 % for sugars; 30 % and 41 % for saturated fat, respectively).
Lunches (n 45) were the most nutrient-rich meals across all groups, averaging 63 % of NRV. They provided particularly high levels of vitamin B12 (107 %), vitamin A (105 %), folate (105 %) and vitamin C (100 %). Snacks (n 12) followed, with an average contribution of 55 % across nutrients. Despite offering lower macronutrient content (20 % energy, 36 % protein and 7·0 % fibre), they often exceeded 100 % of the NRV for some micronutrients like folate, especially in preschool (334 %) and primary (164 %) age groups. This pattern reflects the smaller portion sizes but higher micronutrient density in snacks like fortified biscuits. Breakfasts (n 14) had the lowest overall nutrient contribution at 53 %, though they performed relatively well in micronutrients such as thiamin, folate and riboflavin. Snacks and breakfasts also showed relatively higher NRV percentages for total sugars (46 % and 52 %, respectively), compared with lunches (31 %).
When disaggregated by age and meal type, preschool lunches delivered the highest nutrient contribution (77 % of NRV), followed by preschool snacks (65 %). In contrast, secondary school snacks were the least nutrient-dense, contributing 31 % on average, followed by secondary school lunches (43 %).
Global Diet Quality Score-Meal and -Menu analysis
Figure 2 illustrates variability in GDQS-Meal and -Menu scores by country, disaggregated by age and meal type, with validated nutritional quality benchmarks(Reference Bell, Blakstad and Milani39). GDQS-Meal and -Menu scores varied widely across age groups, meal types, meal days and countries. Among preschool students, the lowest GDQS-Menu score was recorded in Djibouti (13) and the highest in Uruguay (49). Primary-age GDQS-Menu scores ranged from 13 (Djibouti) to 60 (USA). Secondary-age menus followed a similar pattern, with Djibouti recording the lowest snack score (13) and the USA recording the highest lunch score (60), driven by a high food group diversity score (16). Across all age groups, snacks consistently had the lowest GDQS-Menu scores.
GDQS-Meal and -Menu scores by age and meal type. GDQS, Global Diet Quality Score.

Across all age groups and meal types, most menus (57 %) achieved high nutritional quality for their GDQS-Menu scores, while 37 % fell into the medium category and 6 % were classified as low. When disaggregated by age, preschool menus (n 15) were evenly split between high (47 %) and medium (47 %) nutritional quality, with 7 % falling into the low category. Among primary-age menus (n 37), 57 % were high quality, 38 % medium and 5 % low. Secondary-age menus (n 16) had the highest proportion (69 %) of high nutritional quality scores, with 25 % classified as medium and 6 % as low. The higher proportion of high-quality secondary-age menus may reflect that 75 % of these meals were lunches, which generally received higher GDQS-Menu scores, compared to 67 % of preschool meals and 65 % of primary meals.
Across all age groups, lunches generally scored higher than breakfasts and snacks, typically driven by higher food group diversity. Although lunches had the highest proportion of meals rated as high nutritional quality (70 % high and 30 % medium), they also exhibited the widest GDQS-Menu score range (27 in Djibouti to 60 in the USA). Lunch compositions varied considerably across countries; for example, Uruguay offered multiple dishes within a single lunch, such as salad, a main dish like lentil-meatloaf, bread and fruit, while Djibouti provided a single main dish composed of rice or fortified flour, pulses, vegetable oil and iodised salt.
Breakfasts had a narrower GDQS-Menu score range (22 in South Africa to 44 in Belize), with 64 % of breakfasts achieving high nutritional quality, 27 % medium and 9 % low. Breakfast composition also varied, with South Africa offering alternating single-component meals such as instant flavoured maize meal or sorghum porridge, while Belize provided breakfasts with multiple components such as egg breakfast wraps and chicken sandwiches. Snacks had the lowest GDQS-Menu scores overall, ranging from 13 in Djibouti to 34 in Bangladesh, and none achieved high nutritional quality. Most snacks (73 %) achieved medium nutritional quality, while 27 % had low nutritional quality.
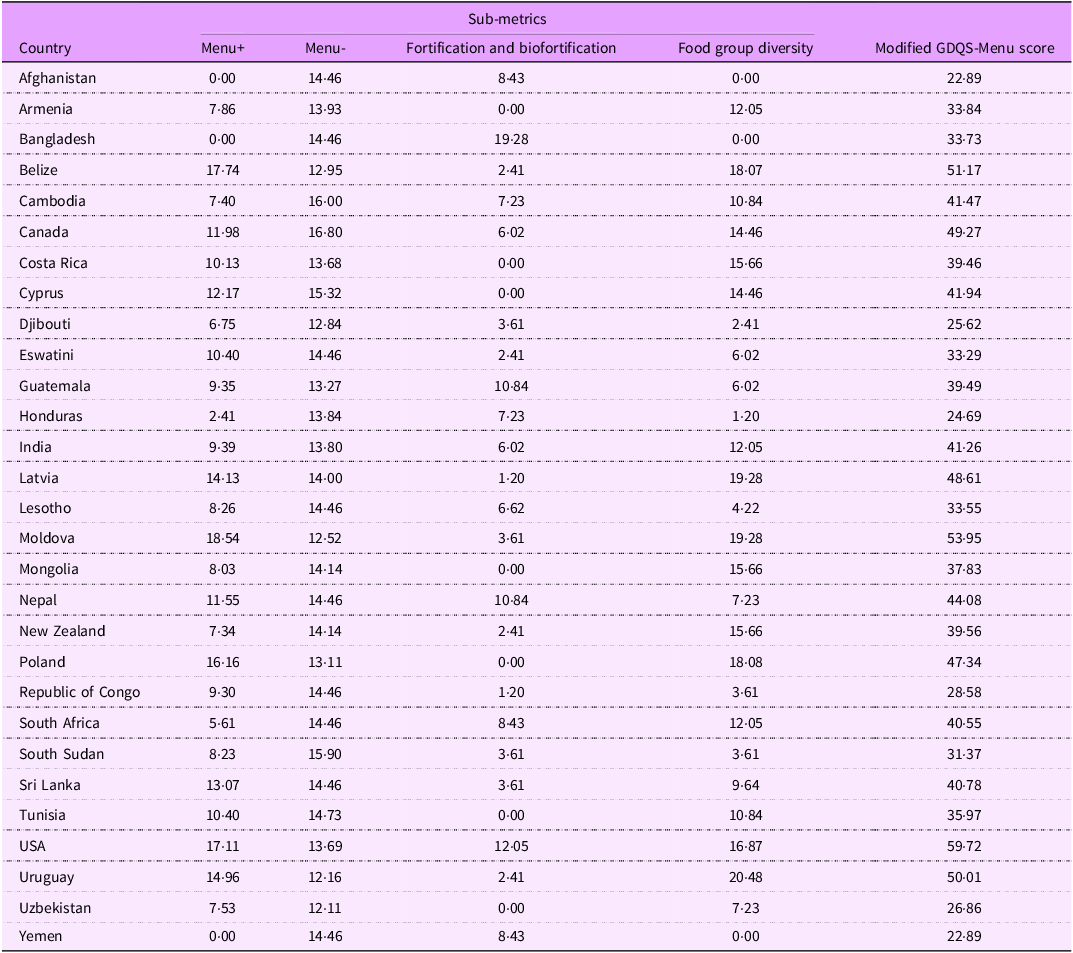
Table 3 presents Modified GDQS-Menu scores, averaged across age groups. Appendix C provides a complete table with GDQS-Meal and -Menu scores disaggregated by day, age and meal type. Modified GDQS-Menu scores ranged from 23 for both Afghanistan and Yemen to 60 for the USA. Countries with higher scores typically served multiple meals per day and multiple dishes within each meal, contributing to higher food group diversity sub-metrics. Additionally, higher-scoring countries generally exhibited more balanced sub-metric distributions, whereas lower-scoring countries earned points primarily from one or two sub-metrics.
Modified GDQS-Menu scores by country, averaged across age groups

GDQS, Global Diet Quality Score.
Factors influencing meal and menu quality
Modified GDQS-Menu scores were generally associated with economic status, with higher-income countries tending to achieve higher scores (Figure 3). However, considerable score variability within income groups revealed that GDP per capita is not a definitive predictor of meal quality. Figure 4 presents a breakdown of Modified GDQS-Meal and -Menu sub-metrics by income group (Panel A), country (Panel B) and day (Panel C).
Modified GDQS-Menu scores by log-transformed GDP per capita. GDQS, Global Diet Quality Score.

Percentage contribution of Modified GDQS-Menu and -Meal sub-metrics by income group, country and day. Multiple rows per country in Panel C reflect different meal days. GDQS, Global Diet Quality Score.

HIC generally exhibited more balanced distributions across GDQS-Menu sub-metrics, with the largest portion of the score (36 %) coming from food group diversity, followed by the absence of unhealthy foods (30 %), the presence of healthy foods (28 %) and fortification (7 %). UMIC followed a similar pattern, with 33 % of the score from food group diversity, 33 % from the absence of unhealthy foods, 25 % from healthy foods and 9 % from fortification. In contrast, LIC and LMIC derived most of their points from the absence of unhealthy foods (59 % for LIC and 43 % for LMIC), with smaller contributions from food group diversity (4 % for LIC and 18 % for LMIC). LMIC showed a modest contribution from the presence of healthy foods (23 %) and limited use of fortification (16 %), whereas fortification played a more substantial role in LIC (28 %). LMIC and LIC countries such as Afghanistan, Yemen and Bangladesh, which rely on fortified biscuits as school meal snacks, recorded the lowest food group diversity scores (0 %). Across all income groups, the absence of unhealthy foods consistently encompassed a large portion of the score. Additionally, while broader patterns exist, variability can also be seen within income groups (Panel B) and within countries across different days (Panel C).
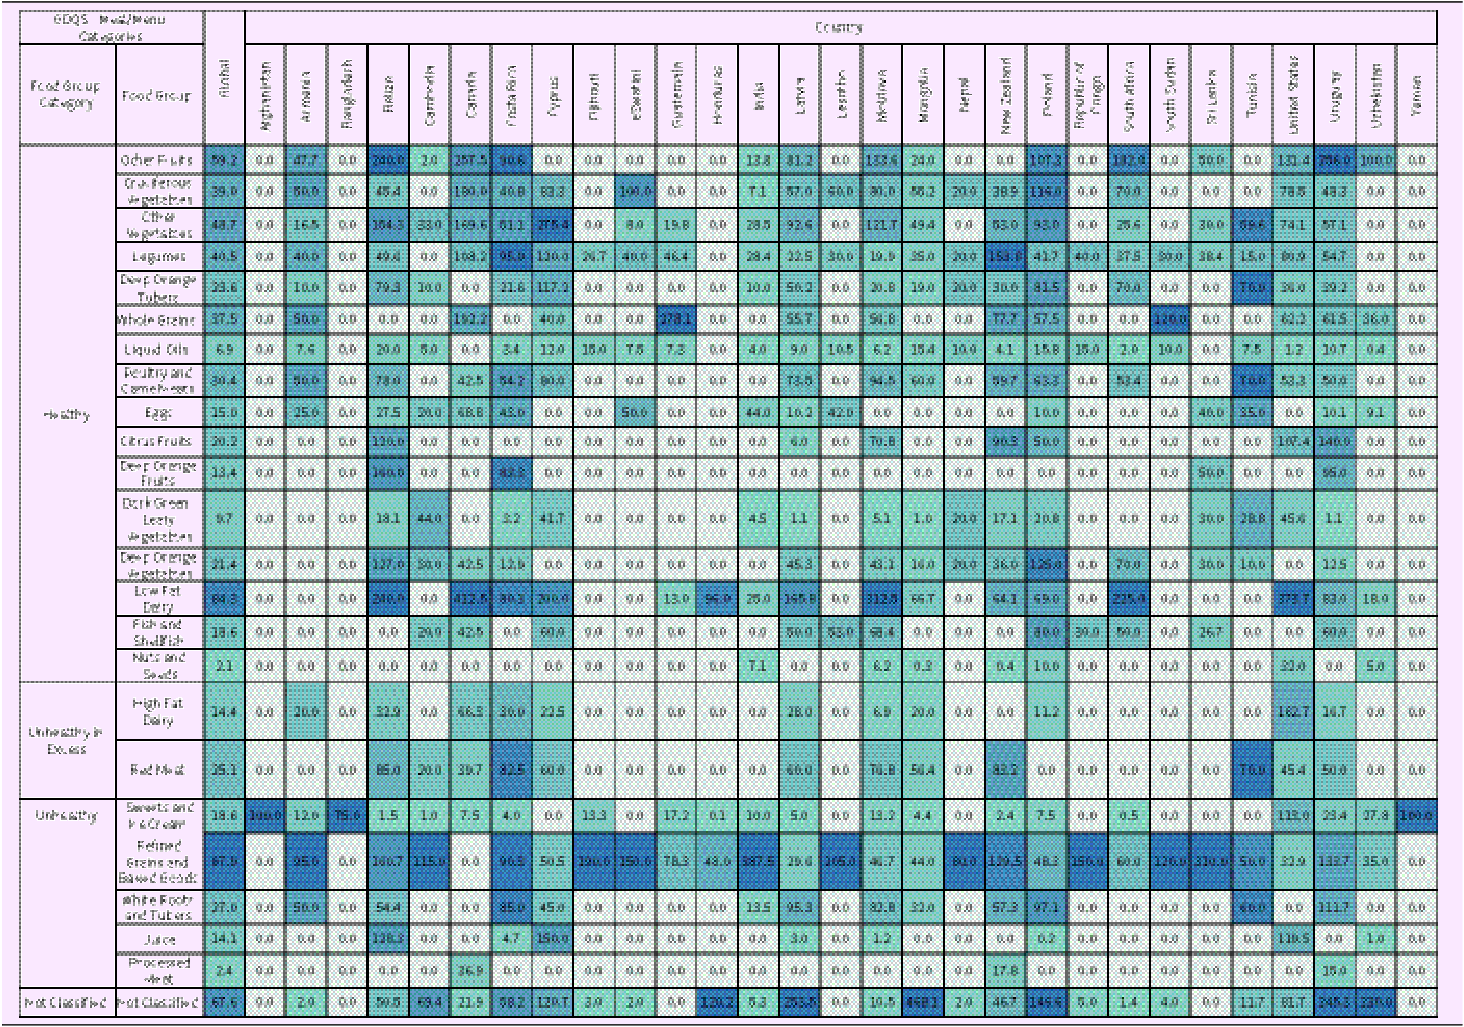
Table 4 presents the mean daily intake (in grams) of GDQS food group across all age groups globally and at the country level. The most consumed food group globally was Refined Grains and Baked Goods (98 g/d), classified as unhealthy, followed by Low-Fat Dairy (84 g/d) and Other Fruits (59 g/d), both considered healthy. In contrast, several nutrient-dense healthy food groups were minimally consumed, including Nuts and Seeds (2 g/d), Liquid Oils (7 g/d), and Dark Green Leafy Vegetables (10 g/d). Additionally, 68 g/d of food intake fell into the Not Classified category (i.e. spices, butter and water), which, while important for taste, palatability and hydration, do not contribute substantially to nutrient diversity.
Mean daily grams consumed per GDQS food group (global level and country level). Cells are shaded using a relative gradient, where lighter shades indicate lower intake values and darker shades indicate higher intake values. Shading is applied within each country column

GDQS, Global Diet Quality Score.
Food group consumption varied widely across countries. Meals in Canada, Costa Rica and the USA featured high intakes of dairy products, especially low-fat varieties. In contrast, India, Sri Lanka, Lesotho and Djibouti had the highest intakes of Refined Grains and Baked Goods. Countries offering greater food group diversity, particularly within healthy food groups, tended to achieve higher Modified GDQS-Menu scores (Table 3). For instance, school meals in the USA, Moldova, Belize and Uruguay included a broad range of food groups and a high representation of healthy items. In contrast, countries with lower scores reported limited food group variety and relied on fortified products to meet nutritional needs; in Afghanistan, Bangladesh and Yemen, meals primarily consisted of fortified biscuits, while meals in other countries, like Djibouti, Honduras and South Sudan, were generally based on staples such as cereals or rice, pulses and vegetable oils.
Discussion
This study provides a cross-country assessment of school meal and menu quality as planned. While existing research on school meal programmes has focused on coverage, this analysis makes a unique contribution by systematically evaluating the nutritional quality of meals through a complementary approach combining nutrient composition analysis with GDQS-Meal and -Menu metrics. This dual emphasis on nutrient- and food-based quality, as well as the inclusion of healthy and unhealthy food components, offers actionable insights for school meal programme design and addressing the multiple dimensions of the DBM.
Key takeaways
School meals are a critical source of nutrition for children
On average, school meals provided a substantial share of daily nutrient needs. Across age groups and meal types, most nutrients met or exceeded 30 % of NRV. Certain micronutrients, such as folate (124 %), vitamin B12 (85 %) and vitamin C (82 %), had high contributions to daily needs, underscoring the role school meals can play in preventing micronutrient deficiencies. Concurrently, the analysis highlights opportunities for strengthening nutrient delivery. For example, fibre (23 %) and Ca (35 %) were less consistently provided.
GDQS-Menu scores affirmed overall quality: 57 % of menus achieved high nutritional quality, 37 % had medium nutritional quality and only 6 % had low nutritional quality. Higher GDQS-Meal and -Menu scores reflect a diverse, balanced and nutrient-rich combination of foods(Reference Bromage, Batis and Bhupathiraju42). Importantly, few menus lost points for unhealthy components, highlighting a shared objective to design school meal programmes in pursuit of nutrition goals. This finding reinforces the potential for school meals to not only address micronutrient deficiencies but also reduce the rising burden of diet-related non-communicable diseases.
Parallel NRV and GDQS analyses reveal paths for improvement. Fibre intake could be enhanced by replacing some food items in the Refined Grains and Baked Goods food group, the most consumed food group globally, with alternatives from the Whole Grains, Dark Green Leafy Vegetables or Nuts and Seeds groups. These alternative high-fibre foods are also rich in folate, B vitamins, Fe and Ca(Reference Pastorino, Hughes and Schultz43). Budget-neutral substitutions, like those promoted by the Fortified Whole Grains Alliance, may support scalable, cost-effective and nutritious improvements(Reference Pastorino, Hughes and Schultz43). Rwanda’s Fortified Whole Grain Program, for example, produced fortified whole-grain maize at the same cost as refined maize, with high student acceptance(Reference Pastorino, Hughes and Schultz43).
Substantial variability in meal and menu quality exists
School meal quality varied across age groups, meal types and countries. Preschool-aged children received the most nutrient-dense meals relative to their needs (70 % of NRV), followed by primary (62 %) and secondary students (43 %). GDQS-Menu scores showed less variation: 69 % of secondary menus were high quality, compared to 57 % for primary and 47 % for preschool. This discrepancy may reflect differences in fortification and meal types by age group: preschool and primary children more often received fortified snacks or breakfasts, while secondary students typically received lunches with more food diversity but less fortification. Ca was consistently low across age groups, suggesting a need for more dairy products or other Ca-rich foods. In many contexts, fortified milk could provide Ca and additional micronutrients like Fe(Reference Drewnowski44). Lower nutrient adequacy in secondary meals also reflects the challenge of meeting adolescents’ higher dietary needs when standard meals are served across all age groups, which can result in under-provision for older students. These findings reinforce the importance of aligning meal design with age-specific needs and addressing identified gaps, including Fe for adolescents (particularly adolescent girls) to support healthy growth and reduce long-term health risks(38).
Within-country variation may reflect budget constraints, staggered nutrient delivery across the week or efforts to tailor meals to children’s preferences. This variability is not inherently negative; it presents opportunities to replicate well-performing meal structures and strengthen weaker components. These differences may also map onto cost variations: more nutrient-rich, diverse menus, particularly those incorporating fresh components, may be costlier to procure and prepare, whereas meals based on fortified or shelf-stable products may be more affordable but offer less variety(Reference Gelli and Suwa24).
There are multiple paths to achieving quality
The diversity among high-quality school meals illustrates the multitude of context-specific pathways to achieving quality. While some countries achieved high scores through diverse food group combinations, others met nutrient targets through fortification. Greater diversity of healthy food groups, often driven by multiple daily meals, was associated with higher Modified GDQS-Menu scores. However, achieving this diversity can be difficult in low-resource settings due to cost, availability and infrastructure challenges. Within these resource-constrained contexts, fortification and biofortification can serve as critical strategies for enhancing nutritional quality. Nevertheless, reliance on fortified food vehicles, such as biscuits or other processed snack items, entails trade-offs, as these foods may also contribute higher sugar content. This pattern underscores the importance of shifting towards greater dietary diversity as food system capacities grow.
Additionally, while GDP per capita had a modest relationship with Modified GDQS-Menu scores, substantial variability remained among countries with similar incomes. These findings suggest the value of identifying aspirational peers – programmes operating in comparable socio-economic and food system contexts that perform well on nutrient adequacy and GDQS metrics. Learning from peer programmes can help countries identify feasible, context-specific pathways for improving school meal quality aligned with cultural preferences, food environments and national nutrition goals(Reference Pastorino, Backlund and Bellanca45). Designing and implementing school meal guidelines or policies is critical for developing these context-specific strategies. Countries with school meal policies tend to have broader programme coverage and higher-quality meals(38,46) . Evidence-based guidance, supported through technical cooperation with aspirational peers, can help countries design and tailor school meal standards that address the unique complexities of country-specific DBM landscapes(38).
Next steps
Future research could examine differences between planned and as-delivered menu quality to better reflect real-world programme implementation. Research could also use longitudinal data to track trends in school meal quality over time, particularly as food systems evolve. Additionally, research should position school meals within children’s broader consumption patterns. Without data on what children consume outside of school, it is difficult to determine how well their daily nutritional needs are being met and how school meals can best complement broader dietary behaviours. Future studies can also adopt a broader lens, extending beyond a focus on nutrition to simultaneously consider the environmental sustainability of school meals, given the role that school meal programmes can play in transforming food systems. Context-specific procurement models, such as Home-Grown School Feeding and Farm-to-School, and the incorporation of underutilised, nutrient-rich Indigenous foods could be explored as pathways for meaningful, multi-sectoral food systems change. Within this realm, research should explore trade-offs among nutritional quality, cost and environmental impact and identify pathways for meal optimisation. Notably, this analysis can include an application of the forthcoming GDQS Environmentally Sustainable Healthy-Meal and -Menu metrics to evaluate food baskets on both nutritional and sustainability dimensions(Reference Deitchler, Poore and Bell47).
Limitations
Despite standardisation of the GSSMP, different menu formats, terminologies, cut-off points and irregular data complicated comparability between countries. Meal types and age ranges also vary across countries, complicating nutritional adequacy assessments for children at different developmental stages. Only a subset of programmes provided sufficiently detailed quantitative menus for inclusion in this review, limiting the representativeness of the sample. Programmes with available quantitative menus may also be more established or better resourced, and findings, therefore, may not be generalisable to all school meal programmes. Additionally, subnational programme variations were not captured. The assumptions of comparability by week, complete biofortification, common variants and cooked status may not hold true in all cases. Most importantly, these data provide a cross-sectional view of a dynamic school meal landscape.
Conclusion
This study addresses a critical evidence gap in the nutritional quality of school meal programmes by combining nutrient composition analysis with GDQS-Meal and -Menu metrics, offering a holistic assessment of both nutrient adequacy and overall meal quality. School meals contribute significantly to children’s daily nutrient needs, and most menus achieve high nutritional quality. However, significant variability across countries, age groups and meal types highlights opportunities for improvement through age- and context-specific strategies. While achieving greater diversity, especially of healthy foods, can be challenging in low-resource settings, fortification remains a promising pathway for enhancing meal quality. Substantial variability among countries with similar income levels also suggests learning from well-performing peer programmes to tailor feasible, context-specific improvements. Future research should examine differences between planned and as-delivered menu quality, trends over time and children’s overall diets. Research should also explore trade-offs among nutritional quality, cost and environmental sustainability to inform actionable, multi-sectoral improvements in school meal programmes.
Supplementary material
For supplementary material accompanying this paper visit https://doi.org/10.1017/S1368980026102456
Acknowledgements
The authors are grateful to Alice Farrer for assistance in conducting a grey literature search for school meal menus. Additionally, the authors thank Dr. Andrew Thorne-Lyman and Dr. Yeeli Mui for their insightful feedback on an earlier version of this manuscript, provided as part of a master’s capstone draft.
Financial support
The 2024 Global Survey of School Meal Programs©, implemented by the GCNF, received financial support from the United States Department of Agriculture (USDA) and The Rockefeller Foundation. This work was supported by The Rockefeller Foundation (AG, grant no.: 2024 FOD 043), (AW, grant no.: 2023 FCW 016), (WB, grant no.: 2023 FOD 031) and the USDA Foreign Agricultural Service (AW, grant no.: FX22TA-10960G001). Financial support for this study was also provided by the International Food Policy Research Institute (IFPRI). IFPRI had no role in the design, analysis or writing of this article.
Authorship
Conceptualisation and methodology: A.K., A.G., W.B. and A.W.; data collection: A.K., A.G., W.B. and A.W.; data analysis: A.K.; writing – original draft preparation: A.K.; writing – reviewing and editing: A.K., A.G., W.B. and A.W.
Conflict of interest
There are no conflicts of interest.
Ethics of human subject participation
Not applicable: no human participants.






 Open access

