


Case report
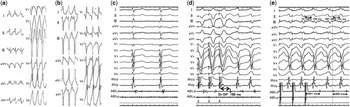
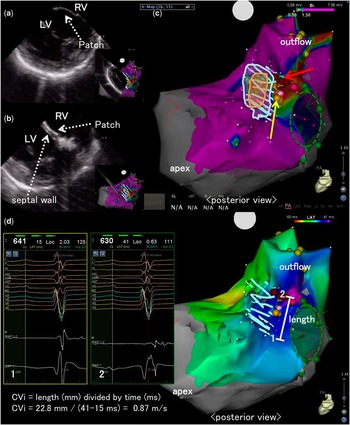
A 14-year-old male patient with double-outlet right ventricle was referred for electrophysiological study of ventricular tachycardia. After pulmonary artery banding at the age of 2 months, he underwent surgery including an arterial switch operation and patch closure of a ventricular septal defect. His electrocardiography showed a ventricular tachycardia with a left bundle branch block-like QRS morphology and an axis of 0° (ventricular tachycardia 1) (Fig 1a). Following intravenous administration of lidocaine, ventricular tachycardia 1 changed to a different ventricular tachycardia (ventricular tachycardia 2) and terminated. The QRS morphology of ventricular tachycardia 2 was a right bundle branch block-type with a superior axis (Fig 1b). Previous surgical procedures made no incisional lines in both ventricles except for a suture line at the ventricular septum for patch closure. Therefore, we presumed that the mechanism of these ventricular tachycardias was related to the ventricular septal defect patch and suture line. Using an intra-cardiac ultrasound technique (Sound-Star with CARTO Sound; Biosense Webstar Inc., Diamond Bar, California, United States of America), the ventricular septal defect was detected as one piece of a Gore-Tex patch (Fig 2a), and the suture between the patch and the interventricular septum was seen as two layers (Fig 2b). As shown in Figure 2c, the intra-cardiac ultrasound technique enabled us to recognise the margin of the suture where the myocardium from the left ventricular side was present. During sinus rhythm, we detected the delayed fragmented potential (Fig 1c)outside the margin of the suture (a red arrow in Fig 2c). Ventricular pacing from the right ventricular apex induced ventricular tachycardia 1 with prolongation of time from stimulus to delayed fragmented potential, which converted to mid-diastolic potential (Fig 1d). Pacing during ventricular tachycardia 1 from an ablation catheter (Thermocool, SmartTouch, 3.5 mm-tip; Biosense Webster Inc., Diamond Bar, California, United States of America) demonstrated entrainment with concealed fusion (Fig 1e). Radiofrequency catheter ablation (25 W, 60 seconds) at this site terminated ventricular tachycardia 1 within 3 seconds. After two additional deliveries of radiofrequency energy around this point, both ventricular tachycardias (1 and 2) were no longer induced.
( a ) The 12-lead electrocardiograms of ventricular tachycardia 1. The QRS morphology of ventricular tachycardia 1 was left bundle branch block type and its axis was about 0°. During tachycardia, the rate was 235 bpm, and the QRS width was 150 ms. ( b ) The 12-lead electrocardiograms of ventricular tachycardia 2. The QRS morphology of ventricular tachycardia 2 was right bundle branch block type and superior axis, with a rate of 210 bpm and width of 150 ms. ( c ) The delayed fragmented potential during sinus rhythm recorded by the distal pair of bipolar electrodes of the ablation catheter. ( d ) Induction of ventricular tachycardia 1. Ventricular tachycardia 1 was induced by double extra-ventricular pacing from the right ventricular apex. The time from stimulus to delayed fragmented potential was remarkably prolonged (St-DP=188 ms), thereby inducing ventricular tachycardia 1. The delayed potential was converted to mid-diastolic potential during ventricular tachycardia 1. ( e ) The entrainment pacing for ventricular tachycardia 1 from an ablation catheter placed at the site where the delayed fragmented potential was recorded during sinus rhythm. The post-pacing interval and the cycle length of ventricular tachycardia 1 were 321 and 302 ms, respectively. Time interval from the pacing stimulus to onset of QRS (St-QRS) was 159 ms, which was close to that from mid-diastolic potential to onset of QRS (DP-QRS=141 ms). Therefore, we were convinced that the mid-diastolic potential was on the central (near exit) region of the ventricular tachycardia 1 circuit and contributed to the critical slow conduction during ventricular tachycardia 1. ABL=ablation catheter; d=distal; DP=diastolic potential; p=proximal; RV=right ventricle; St=stimulus.

( a ) Image of the ventricular septal defect as one piece of a Gore-Tex patch using the intra-cardiac ultrasound technique, Sound-Star with CARTO Sound ( b ). The image of the margin of the suture of the ventricular septal defect patch using the intra-cardiac ultrasound technique, Sound-Star with CARTO Sound. Note that the two layers consisted of the patch (Patch) and the ventricular septum (septal wall). ( c ) The location of the ventricular septal defect patch and its suture area superimposed on the substrate map during sinus rhythm. Low-voltage was defined as <1.5 mV. The voltages in the red and purple areas indicate <0.50 mV and >1.50 mV, respectively. Orange circle=ventricular septal defect; white circle=ventricular septal defect patch; green circle=tricuspid annulus; yellow arrow=the His-bundle; red arrow=the location of delayed fragmented potential. ( d ) Electroanatomical assessment of the anatomical isthmus between the tricuspid annulus and the ventricular septal defect patch. Left panel: electrocardiograms recorded through the isthmus (sites 1 and 2) are shown. Right panel: activation map during sinus rhythm. The conduction velocity index (CVi) was calculated according to the method by Kapel et alReference Kapel, Sacher and Dekkers 4 . LV=left ventricle; RV=right ventricle.

Discussion
A previous report recommended linear ablation for re-entrant ventricular tachycardia in patients after surgical repair for CHD;Reference Zeppenfield, Schalij and Bartelings 1 moreover, the strategy to confirm conduction block across the anatomical isthmus has recently been underscored for ablation of ventricular tachycardia in patients with repaired CHD.Reference Van Zyl, Kapa and Padmanabhan 2 In contrast, this is the first case report to demonstrate the effective use of intra-cardiac ultrasound technique for successful point ablation of re-entrant ventricular tachycardia in a patient with a ventricular septal defect patch.
The ventricular defect patch was sewed from the right ventricular side through the tricuspid valve. If the optimal ablation site had been an inner portion of the suture, the appropriate approach for effective ablation would have been from the left ventricular side – for example, left-sided catheter ablation for ventricular tachycardias improved outcome in patients following repaired Tetralogy of Fallot when septal anatomic isthmuses were hampered by hypertrophied myocardium or prosthetic material.Reference Kapel, Reichlin and Wijnmaalen 3 As shown in Figure 2c, most of the suture area, which is delineated between white and orange circles, showed normal electrical potential (>1.5 mV) when we performed substrate mapping from the right ventricle. On the other hand, the intra-cardiac ultrasound technique identified that the location of target potential was just outside the suture area. Therefore, we could perform this point ablation from the right ventricular side with confidence.
Recently, Kapel et alReference Kapel, Sacher and Dekkers 4 reported that the anatomical isthmuses related to ventricular tachycardia had slow conducting property, characterised as a conduction velocity index <0.5 m/second during sinus rhythm. In contrast, the conduction velocity index was ⩾0.5 m/second in 98% of the anatomical isthmuses in patients without ventricular tachycardia. On the basis of their data, the negative predictive value and specificity of the anatomical isthmuses with a conduction velocity index ⩾0.5 m/second to exclude anatomical isthmuses-related ventricular tachycardia were 100 and 98%, respectively. As shown in Figure 2d, the conduction velocity index of the anatomical isthmuses in our case was 0.87 m/second; therefore, the point ablation for localised area with delayed fragmented potentials could be effective in patients with re-entrant ventricular tachycardia related to a ventricular septal defect patch, if the ventricular myocardium, with normal voltage and sufficient conduction velocity, spreads around the ventricular septal defect patch.
Acknowledgements
None.
Financial Support
This research received no specific grant from any funding agency or from commercial or not-for-profit sectors.
Conflicts of Interest
None.
Ethical Standards
The author assert that all procedures contributing to this study comply with the ethical standards of relevant guidelines on human experimentation and with the Helsinki Declaration of 1975, as revised in 2008, and has been approved by the institutional committee (Hokkaido University Graduate School of Medicine).