INTRODUCTION
The goal of this paper is twofold: first, to revise the classical model of laser ablation of solids, in order to show what are the hidden physical assumptions, and, second, to remove and extend such assumptions in order to develop a model of laser-ablation, which is valid at higher laser intensities.
In the first section, we introduce the basic physical quantities related to laser ablation (evaporation heat, conduction length, ablation threshold). We also show that the usual logarithmic expression for ablated depth vs. incident laser flux is simply the result of assuming an exponential penetration of energy into the material (and not a heuristic assumption supported by experiments, as it is often stated).
In the second section, we revise the standard model of laser ablation, the so-called two-temperature model (Nolte et al., Reference Nolte, Momma, Jacobs, Tunnermann, Chichkov, Wellegehausen and Welling1996). Although the basic physical picture of the model is correct, the problem of choosing the physical quantities, which enter into the model, is often underestimated and misunderstood. The choice is based on solid-state physics (cold solid approximation). In this regime, the transport of energy inside the material is described by using laws, which are really valid at room temperature or close to it.
At high laser intensities, the transition to a plasma state is fast enough to impose the transition to a plasma regime. The surface plasma, which is created by the laser pulse, reaches high temperatures, i.e., typically temperatures above the Fermi energy of the material E F. The new regime, described in the third section, is characterized by a much larger energy penetration depth into the material, and therefore by larger ablated depths.
In the following section, the new model is compared to several experimental measurements performed at high laser intensities in our laboratory (here by “high” we mean higher than what is usually used in ablation experiments, i.e., laser intensities on target larger than 1012 W/cm2).
In the final section, we describe the possible contribution to laser ablation, which is deriving from the presence of fast electrons. Again, to avoid confusion, let's notice that we are not speaking of the really-fast electrons generated in today's experiments with ultra-high-intensity lasers. At the highest intensities used in laser ablation (≤1014 W/cm2), the generated fast electrons are typically in the 10 keV range. Nevertheless they are characterized by a penetration depth in matter, which may be larger than the typical energy penetration depth (in either the cold-solid approximation or the plasma regime). Therefore, in some situations, they can effectively contribute to the penetration of energy inside the material and to the process of laser ablation.
Let's notice that we will limit ourselves, both from the theoretical and experimental point of view, to the case of metals. In metals, laser absorption and thermal conduction are mediated by the “free electrons” already present in the conduction band. The effect of the laser beam is first to heat such electrons. In the case of dielectrics instead, we must consider an initial phase in which the material is relatively transparent to the incoming laser light, and free electrons are created by the laser beam itself (through non-linear absorption processes). However this is an unnecessary complication in the framework of the work described in this paper.
In all cases, the condition of dealing with short pulses (ps and fs) here is essential because it implies that the laser irradiated target does not undergo any hydrodynamics expansion, which is of course not the case with ns and sub-ns laser pulses. In a way therefore, this situation can be described as “isochoric” ablation. By “plasma effects” therefore here we do not mean effects related to the presence of the plasma plume around the target, but to effects related to the surface plasma becoming hot enough to drastically alter the ionization degree in the material and the characteristics of thermal transport in the target.
Finally, let's notice that the use of high laser intensity in ablation may not be advantageous from the point of view of practical applications. Indeed higher intensities usually imply larger collateral effects at the edge of the focal spot, degrading the quality of the desired machining path. Also, due to the logarithmic dependence of ablated depth vs. laser flux, one can get a faster working operation by increasing the laser repetition frequency (i.e., the number of accumulated laser shots), rather then by increasing the laser flux (i.e., the laser intensity) on target. Nevertheless, studying this case is very interesting for understanding the different phenomena involved in laser ablation. Also, it is of practical interest because many of the works reported in the literature are indeed using such high intensities. Finally, let's notice that we should not intend laser ablation only as connected to micromachining: understanding laser ablation (in particular at high intensities) is indeed useful for our comprehension of the damage mechanisms of materials and, in particular optics, under the effect of laser radiation. Recently, this is a particularly relevant topic being related to the construction of very large laser systems like NIF and LMJ.
IMPORTANCE OF SHORT-PULSE LASER ABLATION
Laser ablation is a very active subject of theoretical and experimental investigation, which has been widely studied in the last 20 years, both for its intrinsic physical interest and for its widespread applications ranging from basic physics to medical and technical applications (Alti & Khare, Reference Alti and Khare2006a, Reference Alti and Khare2006b; Ballard & Bonin, Reference Ballard and Bonin2001; Bashir et al., Reference Bashir, Shahid Rafique and Ul-Haq2007; Batani et al., Reference Batani, Stabile, Ravasio, Lucchini, Ullschmied, Krousky, Juha, Skala, Kralikova, Pfeifer, Kadlec, Mocek, Präg, Nishimura and Ochi2003; Beilis, Reference Beilis2007; Di Bernardo et al., Reference Di Bernardo, Batani, Courtois, Cros and Matthieussent2003; Fazio et al., Reference Fazio, Neri, Ossi, Santo and Trusso2009; Fernandez et al., 2006; Gordillo-Vaquez, Reference Gordillo-Vázquez2002; Lam et al., Reference Lam, Tran and Zheng2007; Miller, Reference Miller1994; Schade et al., Reference Schade, Bohling, Hohmann and Scheel2006; Thareja & Sharma, Reference Thareja and Sharma2006; Trusso et al., 2006; Trtica et al., Reference Trtica, Gakovi, Maravic, Batani and Redaelli2006; Veiko et al., Reference Veiko, Shakhno, Smirnov, Miaskovski and Nikishin2006; Wang et al., Reference Wang, Xu, Zhou, Chu and Fu2007, Wieger et al., Reference Wieger, Strassl and Wintner2006).
The recent advances in laser technologies have offered new regimes to investigation, namely in the short-pulse high-intensity regime, which is available thanks to the introduction of chirped pulse amplification technique. Short-pulse lasers (ps and fs) lasers have also been used for the fabrication of debris free microstructures with high precision (Preuss & Stuke, Reference Preuss and Stuke1995; Chichkov et al., Reference Chichkov, Momma, Nolte, von Alvensleben and Tunnermann1996). Indeed, they can provide optimum energy deposition in a minimized volume of the target because energy spreading from the heated zone and plasma shielding due to vaporization occur on a time scale significantly longer than the laser pulse duration.
Due to ultra short duration, fs lasers offer several advantages for material processing: (1) laser energy is rapidly deposited on the target surface due to inverse Bremsstrahlung because of high collision frequency at solid density; (2) hydrodynamic expansion of the material ablated from the target surface is negligible during the laser pulse; (3) thermal diffusion to the surrounding is negligible leading to lower ablation threshold and absence of molten material (Lenzer et al., 1998; Kanavin et al., Reference Kanavin, Smetanin, Isakov, Afanasiev, Chichkov, Wellegehausen, Nolte, Momma and Tünnermann1998). After the laser pulse has finished, damage and ablation take place in a volume primarily determined by the energy penetration depth (Kautek & Kruger, Reference Kautek, Kruger, Lenzner, Sartania, Spielmann and Krausz1996).
PRINCIPLES OF LASER ABLATION
Ablation is the removal of matter from the target (i.e., of atoms), but atoms are heavy and inertial. Therefore the laser light preferentially interacts with the electrons in the material, while the atoms are heated later due to energy exchange processes. Therefore, first we need to characterize the electrons in the materials and their interaction with light, and then the energy transfer to ions.
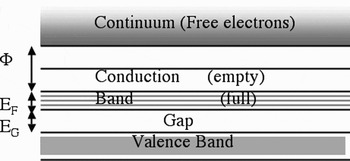
Let's consider the case of metals (we will not speak about the case of insulators). As it is well known, electrons are packed in the conduction band and only electrons at the top of the band can effectively exchange energy (the others being constrained by Pauli's exclusion principle). Electrons in the conduction band are characterized by the value of the Fermi energy. In practical units

where n e is the density of free electrons in the conduction band. Usually E F is a few eV, for instance, for aluminum it is 11.63 eV, for copper it is 7 eV. Another important value is the extraction work Φ, i.e., the energy difference between the most energetic electrons in the conduction band and the continuum.
As for the atoms in the material, they are bonded to the lattice with energies that are characteristics of the materials, but typically E bond ≈ 1 eV to a few eV. This defines an ablation (evaporation) heat:

where n i is the atom (ion) density in the material, ρ is the material density, N A ≈ 6 × 10²³ is the Avogadro number, A is the atomic weight of the material. For instance, in the case of aluminum, ρ/A ≈ 0.1 and assuming E bond ≈ 1 eV = 1.6 × 10⁻¹⁹ J we get ρΩ ≈ 9000 J/cm3. The corresponding value per unit mass is Ω ≈ 3300 J/g or, in general Ω ≈ N AE bond /A.
Let's also notice that the density of ions and free electrons in the material are related by n e = Z*n i, where Z* is the ionization degree or the average number of electrons in the conduction band per ion.
Finally, we will need to describe thermal conduction in the material and its own time scale τth. Since τth is finite and on the order of a few 10 ps (as it will be described later), we can infer that a fast deposition of laser energy (short pulse τ, fs and ps) will not allow spreading and penetration of energy to large volumes. In this regime, therefore, ablation will be characterized by direct evaporation of the matter and negligible thermal effects to the surrounding material, resulting in high precision. On the contrary, for very long pulses (ns or sub-ns) ablation will take place at low laser intensities and evaporation will be accompanied by fusion of material resulting in low precision. To this we must add the fact that in general short pulse lasers are also characterized by a better beam quality, as compared to longer pulse ones.
Although of course laser ablation in the fs regime is recent, following the introduction of fs lasers, its description is also clearer that the process of laser ablation in the ns regime, which is dominated by hydrodynamics. Moreover, the description also applies fairly well to the few ps regime.
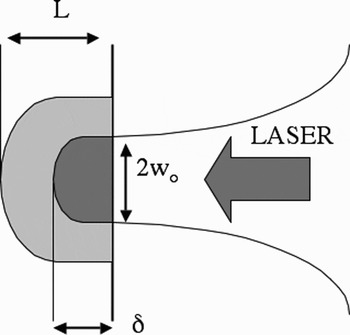
Laser ablation in the short pulse regime is a multi step process. First, energy is deposited in a region of thickness δ (which, as we'll see soon, can be identified with the skin depth) being absorbed by the free electrons in the material (electrons in the conduction band). Second, energy is transported by electrons to a thickness l (electron thermal conduction, diffusion process). Third, we have the interaction with the atomic lattice, heating of the atoms, breaking of the chemical bonds, and finally ablation of the material and the formation of a plasma plume. In order for this third step to take place, after thermalization, ion energy must exceed the bonding energy: this condition can be expressed as C iT i > ρΩ where the thermal capacity is classically C i = 3/2n i i.e., is proportional to the number of atoms per unit volume (ionic density).
The steps are qualitatively illustrated in Figure 2. In the following, we will illustrate the basic physical mechanisms determining the depths δ and l. Before that, however, let's notice one important point. Let's assume that energy is deposited with an exponential profile in the material with a typical scale-length l, i.e., the energy flux (energy per unit surface) is F (J/cm2) = F 0 exp (−x/l). Then the energy deposited between x 0 and x 0 + dx over a surface S is

Electronic structure in the material.

Schematic of the ablation process. Energy is absorbed to a thickness δ and then diffuses to a larger penetration depth l.

For ablation to take place, this deposited energy this must exceed the ablation heat ρΩ in the volume dV = S dx
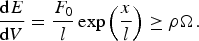
The distance x = L at which the two quantities are equal defines the depth of ablated material. By solving for L we get

where the quantity F th (J/cm2) = ρΩl is the threshold flux for ablation. This must be corrected for the absorption coefficient of laser light A = 1-R, so that F th (J/cm2) = ρΩl/A. This is the well-known formula, which gives the logarithmic dependence of ablation threshold, and we see how it is related only to an (approximately) exponential penetration of energy in the material.
Let's notice two important consequences of the logarithmic dependence of L over F 0:
(1) below F th there is no ablation, but L = l when the logarithm is 1, i.e., when F 0 = eF th ≈ 3F th;
(2) when working with a high repetition frequency laser and above the threshold flux, increasing the inward energy flux F 0 (therefore the laser intensity I) is not advantageous. Indeed with N shots at a given laser intensity I, the total ablation depth is ≈ NL, while if we increase the intensity N times, the ablation depth only increases as ln(N) (Moreover increasing the intensity may increase unwanted “collateral” effects).
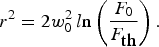
Let's finally observe that this model is one-dimensional. However neglecting two-dimensional dynamics and flows and assuming a radial Gaussian profile of the energy source we can also use the above law in order to derive an equation for the radial size of the ablated region:

from which
As we have already written, the initial distance δ over which the laser energy is absorbed is determined by the penetration of light in the material, i.e., for a metal, the skin depth. The free electrons in the conduction band form a plasma with electronic density n e = Z*n i and the dispersion relation of the electromagnetic wave (laser) in the plasma, in the collisionless approximation is
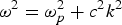
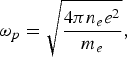
where ωp is the plasma frequency, which defines the plasma refractive index
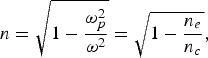
where n c is the critical density at which the (angular) frequency of laser light equals the plasma frequency. Usually ωp >> ω and then the refraction index n becomes imaginary. Therefore, the wave is evanescent in the material, penetrating only over a skin depth δ ≈ c/ωp. For instance, for aluminum, Z* ≈ 3 and n i ≈ 6 × 1022 cm−3. Then ωp ≈ 2.4 × 10¹⁶ Hz and δ ≈ 12 nm. In reality, in a real case, the plasma will be collisional (even strongly collisional) and the plasma frequency may not be much higher than the laser frequency. Therefore, determining the skin depth may become a complex problem (an example of more detailed calculation, performed in the framework of laser ablation, can for instance be found in Gamaly et al., Reference Gamaly, Rode, Luther-Davies and Tikhonchuk2002).
Finally, from δ we can calculate the average energy per electron in the initial plasma contained in the volume πw02δ, which is, as an order of magnitude
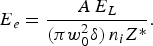
Now, as said before, electrons in the conduction band are characterized by the value of the Fermi energy. As a guiding rule, we can assume that if E e ≤ E F then the characteristics of the material are not affected. We call this “cold solid approximation”. On the contrary, if E e > E F, which happens at high laser intensities, then we will need to take into account modifications in the target characteristics and, in particular, to include plasma effects. Finally, the case E e << E F practically corresponds to no ablation (notice that E F, E bond, Φ are all on the same order, i.e., a few eV).
THE TWO-TEMPERATURE MODEL
The next step is the description of the penetration of the absorbed energy in the material at a distance l, from the initially heated region of dimension δ. This step is classically described by the so-called “two temperature model.” This has been introduced in the works by Nolte et al. (Reference Nolte, Momma, Jacobs, Tunnermann, Chichkov, Wellegehausen and Welling1996) and Kanavin et al. (Reference Kanavin, Smetanin, Isakov, Afanasiev, Chichkov, Wellegehausen, Nolte, Momma and Tünnermann1998) and despite several refinements still remains the “standard model” of laser ablation.
There are several quantities involved in the model: the relaxation time for electrons τe, the relaxation time for the ions τi, the laser pulse duration τ, the equilibrium temperature T eq i.e., the common temperature finally reached by ions and electrons in the volume of thickness l, the thermal diffusivity that is classically given by D = (1/3)v 2τe, the laser source flux S, and the heat flux Q(z) at a certain depth z inside the material. The presence of the electron-lattice coupling constant γ reflects the fact that the single ion in a solid is bounded to the crystal lattice, which may bring to a much larger effective mass (i.e., the inverse of γ can be thought as an ionic relaxation time in the case of electron-lattice interaction).
The equations of the 2T model are simply the energy conservation equations for ions and electrons
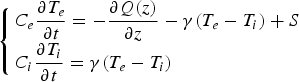
In the electron equation, energy balance is given by heat propagating inside the material, by the relaxation toward ions (the lattice) and the flux of energy from the initially heated region. The ion equation only contains exchange with electrons (which is now positive acting as a source term). Initially, electron temperature will increase due to the term S, then heat will propagate inside; at the same time ions will remain substantially cold. Finally, due to relaxation electron temperature decreases as ion temperature increase until they approach the same limiting value:

Finally, the heat penetration length will be calculated as  . The square root dependence is not a surprise this being a diffusion process, and also it is maintained by the laser pulse, therefore, unless it is too short, the time that appears here is just the laser duration.
Also notice that the relation  only holds for long enough laser pulses. When the laser pulse is very short, one should instead use the expression
 where

again as suggested by Nolte et al. (Reference Nolte, Momma, Jacobs, Tunnermann, Chichkov, Wellegehausen and Welling1996), which is typically several tents ps. This is the well-known “saturation” of ablation threshold observed for very short laser pulses. Let's also notice that in the “usual” case l >> δ, we get the expression:
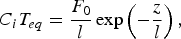
which we have written before, which yields the value of the flux ablation threshold F th (J/cm2) = ρΩl. If instead case δ >> l then we get
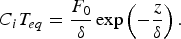
Penetration of energy is still exponential but it is now governed by optical propagation, yielding a value of ablation threshold F th (J/cm2) = ρΩδ.
In order to get quantitative predictions or allow for comparison with experimental data, clearly the key point of the 2T model is the calculation of various atomic parameters. Let's consider as an example the case of copper irradiated by laser light at 532 nm, second harmonic of Nd:YAG (this refers to the experiments described in this paper later). Copper has a density of atoms n i = 8.5 × 1022 cm−3 and Z* = 1, therefore n e = n i. This corresponds to ωp = 1.6 × 10¹⁶ Hz, and δ = 1.8 × 10⁻⁶ cm = 18 nm. Also such electronic density gives E F = 7 eV and v F = 1.57 × 108 cm/s. This is the velocity of the electrons at the top of the conduction bands, those with energy E F and the only ones that can exchange energy. Therefore, it seems appropriate to substitute v = v F in the expression for the thermal diffusivity D.
The calculation of the electronic relaxation time, τe, requires some specifications. Such time is related to the direct current electrical conductivity σ by the well-known expression
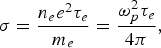
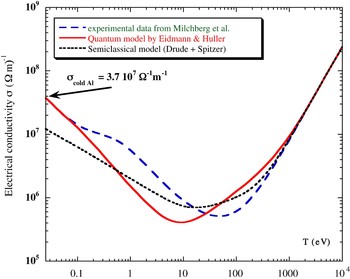
therefore, it is a function of material density and temperature. Figure 3 reports the behavior of σ for solid density aluminum for temperatures between room temperature and 10 keV. Experimental measurements have been made by Milchberg et al. (Reference Milchberg, Freeman, Davey and More1988) by measuring the reflectivity of fs-heated aluminum and calculating resistivity. These are compared to the classical Drude model and to a simplified quantum calculation (Eidmann-Huller model (Eidmann et al., Reference Eidmann, Meyer-ter-Vehn, Schlegel and Huller2000)). All curves give the same behavior: first conductivity decreases and then increases again when the material temperature becomes so large that the plasma regime is reached. In this case, conductivity scales with temperature according to the Spitzer's model, i.e., σ ≈ T e3/2 (Spitzer, Reference Spitzer1962). Let's notice that the simple classical Drude model, although quantitatively wrong, gives the correct qualitative behavior. All curves show a minimum value of conductivity, called “saturated” conductivity. It is possible to show that this minimum corresponds to τe = a/v F, where a is the inter-ionic distance in the material (Ioffe-Regel's limit). In other terms, in this limit, the electrons moving at velocity v F make a collision with every atom they meet on their path. In the case of copper, we get a = n i−1/3 = 2.3 × 10⁻⁸ cm = 2.3 Å and τe = a/v F = 2.2 × 10⁻¹⁶s = 0.22 fs. This is an incredibly fast time, much shorter than even the shortest laser pulses used in ablation.
(Color online) Behavior of electrical conductivity vs. temperature for solid state aluminum.

Using these values we get for the thermal diffusivity D = (1/3) v F2 τe = 1.8 cm2/s. Now, assuming as an example τ = 40 ps (at the very upper limit of the validity range for the present model of laser ablation in the short-pulse regime) we get l = (Dτ)1/2 ≈ 85 nm. Finally we can calculate the threshold flux for ablation as F th = ρΩl/A = 1.2 J/cm2 where we have taken into account that A = 0.3 at 532 nm. Of course this is the value calculated for a polished and clean copper surface, which will certainly be very different from a real rough and oxidized surface; however, this is not too important: A appears inside a logarithmic term and hence small differences in A will not drastically affect the value of F th.
Coming back to the cold solid approximation, we therefore see that in such approximation (E e ≤ E F) no characteristics of the material are strongly affected: the electronic relaxation time remains the same, there is no ionization above the normal value of Z* therefore the electronic density doesn't change; the values of ωp, δ, A, E F, v F don't change significantly. On the other end, as already said, if E e ≪ E F, practically there is no ablation
PLASMA EFFECTS AT HIGH INTENSITY
At higher laser intensities (>1012 W/cm2) and short pulses, we easily get E e > E F. This result in strong heating of the material and in plasma effects: (1) ionization of material above the normal value Z*: the electronic density changes inducing changes in ωp, δ, A, E F, v F; (2) high temperature of the initial plasma. Formulas for heat transfer derived from solid-state physics are no longer applicable.
In particular, there is an increase in the velocity of electrons (v F should then be replaced by electronic thermal velocity v th) and there is an increase in τe for which we must now use Spitzer's law giving τe in a plasma
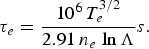
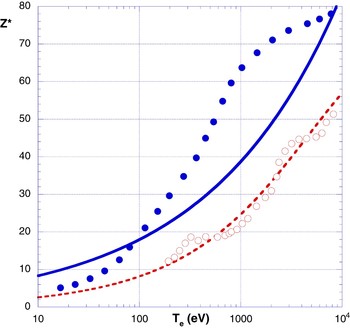
The plasma ionization degree should also be calculated in a self-consistent way. Figure 4 shows the average ionization degree Z* for gold at density ρ = 0.1 g/cm3vs. temperature in various approximation or using different formulas.
(Color online) Average ionization degree Z* for gold at density ρ = 0.1 g/cm3. Squares: Coronal limit; Circles: Thomas Fermi model (Lee & More, Reference Lee and More1984); Solid lines: analytical formula for coronal equilibrium (CE) (Hughes, Reference Hughes1975); Dashed line: analytical formula by Colombant and Tonon (Reference Tonon and Colombant1973) (valid in collisional radiative equilibrium, CRE).

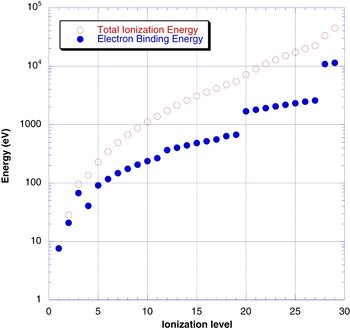
In principle, we should also calculate the energy lost to ionization by summing over the different ionization energies for each electron. For instance, again in the case of copper, this is shown in Figure 5. However, it is possible to show that usually the total energy lost to ionization ΣE ion is negligible with respect to the thermal energy.
(Color online) Ionization energy of each electron for copper ions.

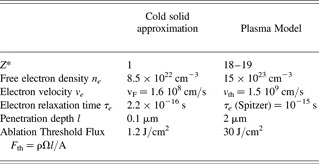
Table 1 shows a comparison of the ablation parameters calculated in the cold solid approximation and in plasma model. The pulse duration is 40 ps. In the plasma case, values are calculated for an intensity I ≈ 1014 W/cm2 giving a temperature T e ≈ 500 eV. The main striking feature of the “plasma regime” is that it brings to penetration depths of the order of microns, instead of tens of nanometers as the “cold solid” regime.
Comparison of ablation parameters calculated in the cold solid approximation and taking the plasma effects into account

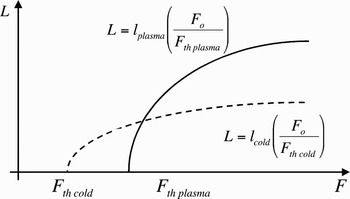
The transition between the cold solid approximation and the plasma case is qualitatively illustrated in Figure 6. The plasma case onset corresponds to a higher ablation threshold flux, but gives larger ablation depths L.
The transition between the cold solid approximation and the plasma case. The plasma case onset corresponds to a higher ablation threshold flux, but gives larger ablation depths L.

LASER ABLATION EXPERIMENTS
As an illustration of ablation measurements in the plasma regime, let's consider the following measurements performed at Milano Bicocca. A Nd:YAG (Quanta System) laser system was used, capable of delivering up to 120 mJ p-polarized 1064 nm laser radiation (the system is described in Faenov et al., Reference Faenov, Magunov, Pikuz, Batani, Lucchini, Canova and Piselli2004) In the present experiment, the laser frequency was up-converted to 532 nm using KD*P crystal giving a maximum energy ≤50 mJ per pulse in the green (532 nm) at 10 Hz repetition frequency. The minimal focal spot radius was w0 = 25 µm (full width at half maximum) and pulse duration τ = 40 ps giving a maximum intensity on target I = 1014 W/cm2.
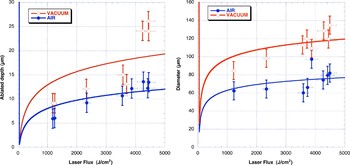
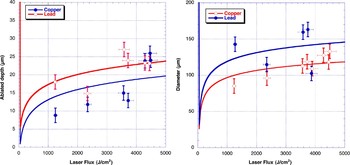
Figure 7 shows the depth and diameter of the ablation region on copper targets in air and vacuum (interaction chamber was evacuated to a residual pressure of ≈ 10−3 torr), as a function of energy flux. Figure 8 instead compares results obtained in vacuum for copper and lead. In both cases, results were obtained by analyzing the irradiated samples with optical microscopy. First, data show that the presence of air decreases the ablation depth of about 40%: which is due to the re-deposition of the ablated material (while the threshold flux is not affected). From available data, we know that for copper, ρ = 8.96 g/cm3 and Ω = 4723 J/g, while for Lead, ρ = 11.35 g/cm3 and Ω = 859 J/g. Then interpolation of data yields the following penetration depths and ablation threshold: copper, l ≈ 5 µm and F th ≈ 70 J/cm2. This is in qualitative agreement with the result reported in Table 1. For Lead, we get l ≈ 4 µm and F th ≈ 7 J/cm2. The ablation rate for lead is larger than for copper, but this is due to the different in the evaporation rate while the heat penetration distance is practically the same (indeed this is mainly a function of plasma conditions, including electron temperature, which are mainly fixed by the characteristics of the laser pulse). Also, we see that in this experiment, the penetration lengths are on the order of couple of µm, as indeed it should happen in the plasma case, and not of several 10 nm, as in the cold solid approximation.
(Color online) Depth and diameter of the ablated region on copper vs. energy flux on target. Data have been interpolated with the formulas introduced in Section 4.

(Color online) Depth and diameter of the ablated region for copper and lead vs. laser flux in vacuum.

Alternatively, the ablation depth per shot can be measured by counting the number of shots, which is needed to drill a clear hole in a foil with a given thickness. For instance, in the same experiments, we measured that 53 shots at the maximum energy flux are needed to drill a hole in a copper foil 1-mm thick. This implies an ablation depth per shot of 19 µm, in fair agreement with the measurements reported in Figure 8. In the same conditions, the measured hole diameter was 120 µm.
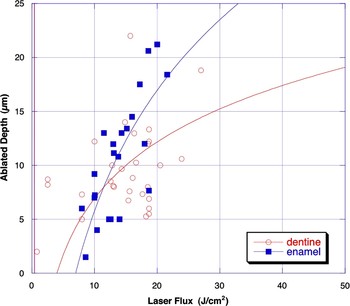
As said before, such experiments were performed at rather high laser intensities (I ≈ 1013 W/cm2) but really the onset of the plasma regime takes place at lower intensity (I ≈1012 W/cm2 or even lower). Therefore Figure 9 shows the results of experiment conducted with the same laser system but using a larger focal spot (w 0 = 400 µm) and lower laser fluxes on target. In this case, the irradiated materials were dentine and enamel (of practical importance for tooth laser ablation and related applications).
(Color online) Ablated depth data obtained for dentine and enamel and logarithmic interpolation to find the ablation threshold and conduction length.

The logarithmic interpolations of experimental data yielded ablation threshold and conduction length of F th ≈ 7 J/cm2 and l ≈ 14 µm for enamel and F th ≈ 4 J/cm2 and l ≈ 7 µm for dentine (detailed results will be presented in a specific paper). Again, we see that even in this case, and lower irradiation intensities, the penetration lengths are on the order of a couple of µm, as expected in the plasma regime, and not of several 10 nm, as in the cold solid approximation.
POSSIBLE EFFECTS FROM FAST ELECTRONS
It is well known that laser-matter interactions can bring to the generation of hot electron tails in the distribution functions. Such “fast electrons” may be approximately described as having their own distribution with a “fast electron temperature,” which in most cases can be expressed by using the so-called Beg's empirical formula (Beg et al, Reference Beg, Bell, Dangor, Danson, Fews, Glinsky, Hammel, Lee, Norreys and Tatarakis1997). [This model is here preferred to the one by Wilks et al. (Reference Wilks, Kruer, Tabak and Langdon1992) because at this low intensity range it better describes the relation between laser intensity and fast electron energy.]

The topic of fast electrons has recently gained a lot of attention, in particular in connection with ultra-high-intensity laser-matter interactions and the possible applications for the “fast ignition” of fusion targets (Atzeni, Reference Atzeni1995; Tabak et al., Reference Tabak, Hammer, Glinsky, Kruer, Wilks, Woodworth, Campbell, Perry and Mason1994; Batani, Reference Batani2002). In this case, the generation of MeV electrons is envisaged at intensities exceeding 1018 W/cm2. In our case, with short pulse lasers and at intensities below 1014 W/cm2, the energy of fast electrons is only a few 10 keV. Nevertheless, they can penetrate at deeper depth than the typical heat penetration length, thereby increasing the penetration of energy in the material (but possibly also dispersing the energy on a larger material volume).
The other difference with studies related to fast ignition is that, due to the lower energy of fast electrons, they are much more strongly influenced by scattering; therefore practically propagating in a hemisphere rather than in a directed beam. For this reason, we turned our attention to one of the first model developed to describe fast electron propagation in matter. This is the model developed by Harrach and Kidder (Reference Harrach and Kidder1981) when the typical energy of fast electrons was on the order of a few keV only. In this model, rather than being characterized by an exponential decay (as it is the case of a energetic fast electron “beam”), the deposition of energy as a function of the transversal distance z from the electron “semi spherical cloud” is characterized by the functional dependence
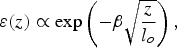
where l 0 is the curvilinear penetration range calculated from the stopping power (in terms of area mass we must consider the penetration range r 0 = ρ l 0). The parameter β is characteristics of the material and dependent on the atomic number Z β ≅ 0.59 ln(Z/0.3).
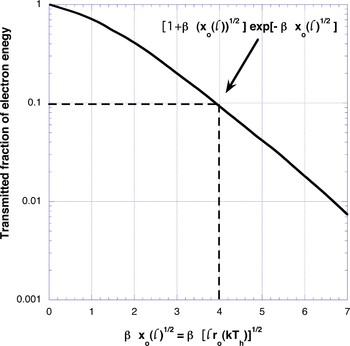
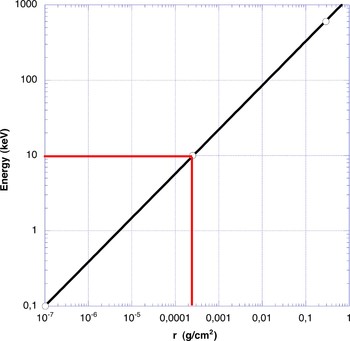
Figure 10 describes the energy deposition of fast electrons in matter while Figure 11 describes the penetration range of electrons vs. their energy. For instance, let's assume we are working at an experimental flux of 10 J/cm2 giving, with a short pulse laser, intensity on target ≈ 3 × 10¹⁴ W/cm2, and a fast electron temperature of T h ≈13 keV. Then the model by Harrach and Kidder (Reference Harrach and Kidder1981), we see that the penetration at which 90% of the energy is absorbed corresponds to β(x/r 0)1/2 = 4 (see Fig. 10). For a typical low-Z material (let's for instance assume the case of sapphire) we have β ≈ 2 and then we then get (x/r 0)1/2 = 2 or x = 4r 0. The penetration range r 0 in terms of area mass for sapphire is given by Figure 11 and corresponds to r 0 ≈ 0.0005 g/cm2. With a density of sapphire of 4 g/cm3, we then get x ≈ 1.25 µm.
(Color online) Energy deposition curve for fast electrons.

(Color online) Electron penetration range vs. the energy of fast electrons.

We should also consider that a few percentage of the laser energy can be transferred to fast electrons. In some experimental conditions, this can be sufficient to induce ablation of the material over a penetration depth again of a few microns. Therefore, such phenomenon should be carefully considered in the interpretation of some laser ablation phenomena with short pulses and at high intensity.
CONCLUSIONS
In this paper, we have studied plasma effects, which are present in laser ablation at relatively high intensity (I ≥ 1012 W/cm2). The model, which is developed, is basically an extension of classical “two temperature model” of laser ablation to include laser-induced heating and laser-induced changes in the background material. The plasma regime implies much longer penetration lengths (of the order of microns as compared to few tens of nanometers expected in the cold solid approximation) bringing to higher laser ablation threshold and larger ablation rates. Finally the model was compared to experimental results on laser ablation of solid targets from short pulse lasers at high intensities (up to 1014 W/cm2) yielding a fair qualitative agreement.
ACKNOWLEDGMENTS
The author acknowledges the useful discussions with Dr. Federico Canova (Amplitude Tech.) and the experimental help of Dr. Stefano Rossetti, Dr. Balsam Mardan, and Dr. Davide Bigoni.