There is considerable evidence that socioeconomic disadvantage (e.g., low educational attainment, economic hardship, limited occupational achievement) has negative consequences for adults and children. For instance, low socioeconomic status (SES) is associated with poorer physical health, emotional well-being, and cognitive functioning for both children and adults (e.g., Berkman & Kawachi, Reference Berkman and Kawachi2000; Bradley & Corwyn, Reference Bradley and Corwyn2002; Conger et al., Reference Conger, Wallace, Sun, Simons, McLoyd and Brody2002). Although the overwhelming weight of empirical evidence indicates that lower SES is associated with reduced health and well-being, previous research has suggested that SES has a greater effect on young children's academic and cognitive achievement than on their emotional and behavioral development (Duncan & Brooks-Gunn, Reference Duncan, Brooks-Gunn, Duncan and Brooks-Gunn1997; Haveman & Wolfe, Reference Haveman and Wolfe1994). Yet, SES still appears to be an important predictor of problem behaviors in childhood and adolescence, such as delinquency, aggression, conduct problems at school, and other externalizing behaviors (Brody et al., Reference Brody, Stoneman, Flor, McCrary, Hastings and Conyers1994; Dodge, Pettit, & Bates, Reference Dodge, Pettit and Bates1994; D'Onofrio et al., 2009; Kahn, Wilson, & Wise, Reference Kahn, Wilson and Wise2005; Keenan, Shaw, Walsh, Delliquadri, & Giovannelli, Reference Keenan, Shaw, Walsh, Delliquadri and Giovannelli1997; McCoy, Frick, Loney, & Ellis, Reference McCoy, Frick, Loney and Ellis1999; McLeod & Shanahan, Reference McLeod and Shanahan1993; McLoyd, Reference McLoyd, Taylor and Wang1997; Samaan, Reference Samaan2000; Sampson & Laub, Reference Sampson and Laub1994). Furthermore, research has linked child and adolescent problem behavior to adverse outcomes later in life, including school drop-out, forgoing postsecondary education, long-term unemployment in adulthood, and time spent in correctional facilities (Caspi, Wright, Moffitt, & Silva, Reference Caspi, Wright, Moffitt and Silva1998; Cohen, Reference Cohen1998; Kokko & Pulkkienen, Reference Kokko and Pulkkinen2000; McLeod & Kaiser, Reference McLeod and Kaiser2004). Thus, uncovering the reasons for these associations is crucial to understanding how SES influences individual lives.
The majority of the research linking SES with developmental outcomes stems from a social causation perspective; that is, the view that social conditions lead to variations in social, emotional, cognitive, and physical functioning. The antithesis to this viewpoint is the social selection argument, which proposes that the associations between SES and child outcomes are spurious; that both are caused by individual differences in parental characteristics. The selection perspective argues that the traits and dispositions of parents influence their social status and the health and well-being of their children (e.g., Mayer, Reference Mayer1997). According to this view, if these parental characteristics are taken into account, the relation between SES and child development should be markedly reduced or eliminated.
Thus, social causation and social selection perspectives suggest that very different causal processes account for the associations among SES, socialization, and child and adolescent development. However, although the two perspectives appear contradictory, combining the social selection and social causation perspectives may aid in our understanding of the relation between SES and developmental outcomes, and problem behaviors in particular. The interactionist model of socioeconomic influence on child development (IMSI; Conger & Dogan, Reference Conger, Dogan, Grusec and Hastings2007; Conger & Donnellan, Reference Conger and Donnellan2007) proposes that the association between SES and human development involves a dynamic interplay between social causation and social selection. That is, the model argues that earlier parental attributes originating during childhood and adolescence affect later SES, family characteristics, and child outcomes, as the social selection perspective suggests. However, the IMSI also proposes that SES influences family stress processes and parental investments in children, which in turn, affect the next generation of children. Consistent with other developmental models (e.g., Gottlieb, Reference Gottlieb and Magnusson1996; Magnusson & Stattin, Reference Magnusson, Stattin, Damon and Lerner1998; Sameroff, Reference Sameroff, Cicchetti and Cohen1995), this theoretical argument hypothesizes that individual attributes and socioeconomic conditions will be reciprocally interrelated across time and generations.
The IMSI is also consistent with developmental cascade models, especially when extended across two or more generations (Masten et al., Reference Masten, Roisman, Long, Burt, Obradović and Riley2005). Developmental cascades can take many forms, but generally they involve functions at one level, domain, or generation meaningfully shaping functions at other levels, domains, or generations. Cascade models aid understanding across a broad array of developmental outcomes, in part because they capture the complexity of development better than traditional models by modeling associations among multiple domains across time or generations. Further, they are applicable to a wide array of subjects: from modeling the interconnections among externalizing behaviors, academic achievement, and internalizing problems across multiple developmental periods (Masten et al., Reference Masten, Roisman, Long, Burt, Obradović and Riley2005) to examining how biological dispositions early in life affect and are affected by social phenomena (Dodge & Pettit, Reference Dodge and Pettit2003). Especially important, understanding developmental cascades may aid prevention research by better identifying the best points at which to interrupt negative cascades.
In this study, we view the intergenerational transmission of SES and behavior as a type of developmental cascade, consistent with predictions from the IMSI. The study links three generations of families, as well as linking SES and problem behaviors across the generations. Specifically, we examine how SES in an earlier generation (G0) affects the next generation's (G1) SES and problem behavior, as well as how problem behavior cascades across generations to affect the next generation's (G2) problem behavior. Thus, we examine a developmental cascade of SES and problem behavior across generations.
In this report we evaluate predictions from the IMSI focusing on problem behaviors in two generations of parents and children from the Family Transitions Project (FTP; e.g., Conger & Conger, Reference Conger and Conger2002). The FTP is an ongoing, longitudinal study that has followed a cohort of participants (G1) from early adolescence into adulthood. The FTP is uniquely positioned to evaluate the IMSI and the argument that the relation between a family's SES and a child's adjustment may be spurious, because it includes extensive information on the characteristics of the G1 adolescent participants before they enter the world of work and before they become parents. Thus, these characteristics can be used to predict both later SES in G1's family of procreation as well as the development of their children (G2).
SES and Child Development
One of the exciting innovations in research on SES and families during the past decade has come in the form of randomized experiments involving intervention programs for low-income families. In these studies families are randomly assigned to either an intervention or a control group, and comparisons are made between the groups after intervention. These experimental tests provide the best evidence for a causal relationship between SES and child development. The results from these studies have produced evidence that these programs can have a positive influence on parents' well-being and on developmental outcomes for children and adolescents. Although these findings are quite complex and tend to be contingent on a number of factors, such as the age or gender of the child, there is a growing body of evidence suggesting that improvements in family SES may have beneficial effects for parents and children (Gennetian & Miller, Reference Gennetian and Miller2002; Huston et al., Reference Huston, Duncan, McLoyd, Crosby, Ripke and Weisner2005; Leventhal & Brooks-Gunn, Reference Leventhal, Brooks-Gunn, Bornstein and Bradley2003; Leventhal, Fauth, & Brooks-Gunn, Reference Leventhal, Fauth and Brooks-Gunn2005; Morris, Duncan, & Clark-Kauffman, Reference Morris, Duncan and Clark-Kauffman2005). Particularly relevant to this study, Costello, Compton, Keeler, and Angold (Reference Costello, Compton, Keeler and Angold2003) reported the results from a quasiexperimental study that demonstrated that, after a casino opened in a poor community, increases in parental employment and family income were associated with decreases in behavioral problems for children in the study.
Although results from these types of experimental and quasiexperimental investigations increase confidence in causal inferences about the influence of economic status on child development, they do not directly address the mechanisms that account for this association. Thus, research and theory on SES and children's development that seeks to understand the processes through which SES influences adolescent and child well-being is critically important so that appropriate steps can be taken to help improve the lives of families, parents, and children. The IMSI provides a theoretical framework that attempts to identify important mechanisms connecting SES and child development. The IMSI combines two social causation theoretical frameworks, each of which focuses almost exclusively on family SES, the family stress model (FSM) and the family investment model (FIM). The IMSI also hypothesizes that processes of social selection will be involved in the relationship between SES and human development across time and generations (see Conger & Donnellan, Reference Conger and Donnellan2007; Gershoff, Aber, Raver, & Lennon, Reference Gershoff, Aber, Raver and Lennon2007; Yeung, Linver, & Brooks-Gunn, Reference Yeung, Linver and Brooks-Gunn2002). In the next sections we describe the social causation and selection perspectives in more detail, as well as the research on each with regard to problem behaviors in children and adolescents.
Social Causation Views of Socioeconomic Influence
The FSM
The FSM proposes that financial difficulties have an adverse influence on parents' emotions, behaviors, and relationships that in turn negatively affect their parenting and socialization strategies (Conger & Conger, Reference Conger and Conger2002). These disruptions in parenting practices are expected to reduce emotional, behavioral, cognitive, and physical well-being for children. Thus, when childrearing is threatened by this hypothesized economic stress process, successful development of the child is placed in jeopardy.
There has been broad empirical support for the economic stress processes proposed by the FSM based on results from studies involving (a) rural, White families, and children (Conger et al., Reference Conger, Conger, Elder, Lorenz, Simons and Whitbeck1992, Reference Conger, Conger, Elder, Lorenz, Simons and Whitbeck1993), (b) African American families living in urban and rural locations (Conger et al., Reference Conger, Wallace, Sun, Simons, McLoyd and Brody2002; Mistry, Vandewater, Huston, & McLoyd, Reference Mistry, Vandewater, Huston and McLoyd2002), (c) early adolescent boys and girls living in two-parent families in Finland (Solantaus, Leinonen, & Punamäki, Reference Solantaus, Leinonen and Punamäki2004), (d) Hispanic families and children (Mistry et al., Reference Mistry, Vandewater, Huston and McLoyd2002; Parke et al., Reference Parke, Coltrane, Duffy, Buriel, Dennis and Powers2004), and (e) nationally representative samples of young children and their families (Gershoff et al., Reference Gershoff, Aber, Raver and Lennon2007; Yeung et al., Reference Yeung, Linver and Brooks-Gunn2002).
Moreover, all of these studies have included some measure of problem behaviors among their outcomes. Although half of the studies included antisocial behavior, externalizing problems, or other problem behaviors only as indicators of an overall adjustment problems construct (Conger et al., Reference Conger, Conger, Elder, Lorenz, Simons and Whitbeck1992, Reference Conger, Conger, Elder, Lorenz, Simons and Whitbeck1993; Gershoff et al., Reference Gershoff, Aber, Raver and Lennon2007; Parke et al., Reference Parke, Coltrane, Duffy, Buriel, Dennis and Powers2004), the other half have examined problem behavior directly and found support for the FSM when examining outcomes such as externalizing symptoms and teacher-reported conduct problems. For instance, using data from a sample of African American families, Conger and colleagues (2002) found that economic hardship was positively related to economic pressure in families. This economic pressure was related to the emotional distress of caregivers, which in turn, was associated with problems in the caregiver relationship. These problems were related to disrupted parenting practices, which predicted higher externalizing symptoms. Mistry and colleagues (2002) also found that family stress processes were an important mediator of the relationship between economic hardship and teacher ratings of child behavior problems in a sample of low-income, ethnically diverse children. Likewise, Solantaus and colleagues (2004) found support for the FSM in their study of early adolescents living in Finland. They found that parental mental health, marital interaction, and parenting quality mediated the association between economic pressure and externalizing symptoms, consistent with the FSM. Finally, using data from the Panel Study of Income Dynamics, Yeung and colleagues (2002) found that economic pressure was associated with young children's (ages 3–5) externalizing behaviors through maternal distress and parenting practices, also consistent with the FSM. Thus, wide support has been found for the FSM and its relevance in explaining problem behaviors in youth.
The FIM
The FIM takes a very different approach to SES effects (Conger & Donnellan, Reference Conger and Donnellan2007). The FIM is rooted in economic principles of investment and proposes that families with greater socioeconomic resources are able to make significant investments in the development of their children, whereas more disadvantaged families must invest in more immediate family needs (Becker & Thomes, Reference Becker and Thomes1986; Bradley & Corwyn, Reference Bradley and Corwyn2002; Corcoran & Adams, Reference Corcoran, Adams, Duncan and Brooks-Gunn1997; Duncan & Magnuson, Reference Duncan, Magnuson, Bornstein and Bradley2003; Haveman & Wolfe, Reference Haveman and Wolfe1994; Linver, Brooks-Gunn, & Kohen, Reference Linver, Brooks-Gunn and Kohen2002; Mayer, Reference Mayer1997). These investments involve several different dimensions of family support, such as having learning materials available in the home, the family's standard of living (adequate food, housing, clothing, medical care, etc.), and residential location that fosters a child's competent development. According to the FIM, greater SES will be positively related to parental material investments and childrearing activities expected to foster positive developmental outcomes of children.
Although the traditional investment model from economics is primarily limited to the influence of material investments on families and children, we extend the basic model by proposing that SES will be similarly related to behavioral and emotional investments by parents in their children. For example, sociologists have long argued that greater occupational status affects parents' values and priorities in a fashion that positively influences their strategies of childrearing (Kohn, Reference Kohn1959, Reference Kohn1963, Reference Kohn1969, Reference Kohn, Moen, Elder and Lüscher1995). Moreover, recent research is consistent with a long history of empirical findings that relate parental education to socialization practices and priorities (Hoff, Laursen, & Tardif, Reference Hoff, Laursen, Tardif and Bornstein2002; Huston & Aronson, Reference Huston and Aronson2005; Tamis-LeMonda, Paasch, Day, & Carver, Reference Tamis-LeMonda, Shannon, Cabrera and Lamb2004). Consistent with these ideas, the FIM proposes that parents with greater SES will be more likely to adopt parenting goals, behaviors, and emotional attachments that foster children and adolescents' well-being. These emotional and behavioral investments in their children may take many forms, such as time spent with the child, warm and nurturing parenting, and positive child-rearing strategies (e.g., consistent discipline), all of which have been tied to problem behaviors in children.
A number of studies have confirmed the most basic propositions of the investment model; that is, family SES affects the types of investments parents make in the lives of their children (Bradley & Corwyn, Reference Bradley and Corwyn2002; Bradley, Corwyn, McAdoo, & Garcia Coll, Reference Bradley, Corwyn, McAdoo and García Coll2001; Davis-Kean, Reference Davis-Kean2005; Mayer, Reference Mayer1997) and family income during childhood and adolescence is positively related to academic, financial, and occupational success during the adult years (Bradley & Corwyn, Reference Bradley and Corwyn2002; Corcoran & Adams, Reference Corcoran, Adams, Duncan and Brooks-Gunn1997; Mayer, Reference Mayer1997; Teachman, Paasch, Day, & Carver, Reference Teachman, Paasch, Day, Carver, Duncan and Brooks-Gunn1997). As noted, family SES promotes competent child development by increasing both the financial (e.g., purchasing educational materials such as books) and also the personal (e.g., time spent reading to a child) investments that parents make in their children (Gershoff et al., Reference Gershoff, Aber, Raver and Lennon2007; Linver et al., Reference Linver, Brooks-Gunn and Kohen2002; Yeung et al., Reference Yeung, Linver and Brooks-Gunn2002). However, most research on the FIM has focused on academic achievement and cognitive outcomes, with little research focused directly on problem behaviors as an outcome.
One exception is a study by Linver and colleagues (2002) who used data from the Infant Health and Development Program. One outcome they examined was maternal report of child behavior problems when the children were 3 and 5 years of age. As with previous research, they found that low income was associated with problem behavior among children. They then examined possible mediators, including the preschool version (ages 3–6) of the Home Observation for Measurement of the Environment (Bradley & Caldwell, Reference Bradley and Caldwell1980), and found that this measure of parental investments in children played a role in the mediation of the relationship between income and problem behavior (Linver et al., Reference Linver, Brooks-Gunn and Kohen2002). Thus, at least one study has found direct evidence of the FIM's relevance to problem behaviors, and many others suggest its possible usefulness in explaining the association between low SES and problem behavior.
Social Selection and Socioeconomic Influence
The major alternative explanation to the social causation argument is that connections between parental SES and child development result from a process of social selection (e.g., Becker, Reference Becker1981; Lerner, Reference Lerner, Bornstein and Bradley2003; Mayer, Reference Mayer1997; Rowe & Rodgers, Reference Rowe and Rodgers1997). According to the social selection perspective, individual differences in traits such as intelligence and personality facilitate the development of social advantages (e.g., SES) and are transmitted from parents to children. That is, certain parental characteristics help account for both their economic success and the adjustment of their children. For example, Mayer (Reference Mayer1997) notes that parents pass on a range of endowments to their children that include not only the kinds of economic investments discussed earlier but also genes, behavioral dispositions, and values.
The most commonly invoked mode of transmission is genetic (e.g., Rowe & Rodgers, Reference Rowe and Rodgers1997), but the exact mechanisms are not essential to this argument. What is critical is the proposition that observed associations between parental SES and child and adolescent outcomes are actually caused by a third variable. That is, both parental SES and children's development are hypothesized to originate from certain parental characteristics. For example, Mayer (Reference Mayer1997) proposed that, “parental characteristics that employers value and are willing to pay for, such as skills, diligence, honesty, good health, and reliability, also improve children's life chances, independent of their effect on parents' income. Children of parents with these attributes do well even when their parents do not have much income” (pp. 2–3).
Almost no research has directly addressed this counterproposal to the social causation argument. However, evidence from longitudinal studies shows that early emerging individual differences in personality and cognitive ability predict income, occupational status, and bouts of unemployment in adulthood (e.g., Feinstein & Bynner, Reference Feinstein and Bynner2004; Judge, Higgins, Thoresen, & Barrick, Reference Judge, Higgins, Thoresen and Barrick1999; Shiner, Masten, & Roberts, Reference Shiner, Masten and Roberts2003). Similarly, problem behaviors appear to develop early and predict later outcomes in adulthood. For instance, McLeod and Kaiser (Reference McLeod and Kaiser2004) found that externalizing problems as early as ages 6–8 significantly decreased high school completion, as well as subsequent college enrollment for those who did finish high school. Other research has found that children exhibiting antisocial behavior had an increased risk of unemployment in adulthood, even after controlling for educational attainment (Caspi et al., Reference Caspi, Wright, Moffitt and Silva1998). Kokko and Pulkkinen (Reference Kokko and Pulkkinen2000) found that teacher reports of aggression at age 8 predicted school maladaptation in early adolescence, which in turn was related to long-term unemployment in adulthood. Furthermore, traits of this nature, and antisocial behavior itself, have been shown to be heritable to a significant degree (e.g., Bouchard, Reference Bouchard2004). Thus, consistent with the social selection perspective, there are parental individual differences that seem to influence both SES and child development, including problem behavior.
The IMSI
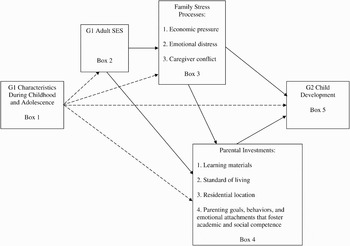
The preceding review demonstrates that there is empirical support for both the social causation and social selection perspectives, and that both are relevant to explaining problem behavior, yet the two are at odds with one another. On the one hand, the social selection perspective tends to minimize the role that socioeconomic circumstances such as economic catastrophes and windfalls may play in the lives of parents and children. On the other hand, the social causation explanation places too little emphasis on the role of individual differences and human agency. Thus, a comprehensive model that incorporates both social causation and social selection processes would seem to hold promise for future research, as illustrated in Figure 1. The IMSI incorporates an interactionist perspective on SES, family interaction processes, and child development. The model represents one variation in a family of theoretical perspectives on development that go by various labels such as interactionist (e.g., Magnusson & Stattin, Reference Magnusson, Stattin, Damon and Lerner1998), transactional (e.g., Sameroff, Reference Sameroff, Cicchetti and Cohen1995), or systems (e.g., Gottlieb, Reference Gottlieb and Magnusson1996).
The interactionist model of socioeconomic influence on child development (IMSI); G1 and G2, Generations 1 and 2; SES, socioeconomic status. Solid arrows represent predictions consistent with the social causation perspective. Dashed arrows represent predictions consistent with the social selection perspective.

All of the dashed lines in Figure 1 represent predictions from the social selection perspective; the solid lines represent predictions from a social causation view. To address the social selection approach, the model begins with characteristics of future parents (G1) during adolescence (Box 1). The selection framework proposes that these characteristics are related to G1 SES in adulthood (Box 2), family stress processes (Box 3), and parental investments (Box 4). The model also proposes a direct association between earlier characteristics of the parent and developmental outcomes for children in the next (G2) generation (Box 5). This direct pathway could occur biologically or via social learning processes whereby offspring emulate G1 characteristics that demonstrate continuity from childhood to the adult years. The social causation aspects of the interactionist model are reflected in pathways from SES (Box 2) to family stress processes (Box 3), and in turn to G2 child outcomes (Box 5) along the lines specified by the FSM. Pathways from SES (Box 2) to parental investments in their offspring (Box 4) reflect hypotheses proposed by the FIM. This model also proposes that SES will have an indirect influence on investments and child development through family stress processes. Thus, the IMSI merges two of the primary approaches to understanding the social influence of SES on parents and children.
The most important aspect of the IMSI, however, is that it incorporates the competing hypotheses from both the social selection and social causation perspectives. The model in Figure 1 describes a reciprocal dynamic according to which G1 attributes during childhood and adolescence affect SES and family characteristics during G1's adult years. In a reciprocal process, the model proposes that G1 SES also influences G1 characteristics as a spouse and parent in a process that ultimately cascades to the next generation of children. Empirical evaluation of the model will clarify the degree to which this reciprocal dynamic actually occurs. For example, if careful intergenerational studies demonstrate that SES has little influence on family processes or investments after G1's early characteristics are taken into account, then the weight of the evidence would favor a social selection argument. Conversely, if G1 characteristics play only a limited role in either SES or the later constructs in the model after SES is taken into account, then the evidence would favor a social causation view. A third alternative is that all of the elements in the model will prove to be important, consistent with the IMSI.
The Present Study
The overall purpose of the present study is to evaluate the IMSI's utility in explaining problem behaviors across generations. To do this, we use data from the FTP (Conger & Conger, Reference Conger and Conger2002), an ongoing, longitudinal study that has followed a cohort of participants from early adolescence into adulthood. Tests of the model depicted in Figure 1 require special types of studies conducted over long periods of time. Data must be collected during childhood or adolescence on future parents, and this G1 generation must be followed long enough into adulthood to evaluate the competing theoretical processes proposed in Figure 1. Fortunately, the FTP meets these criteria, allowing us to disentangle the degree to which the relations among SES, family interactions, and child development represent processes of social selection, social causation, or a combination of the two, as proposed by the IMSI.
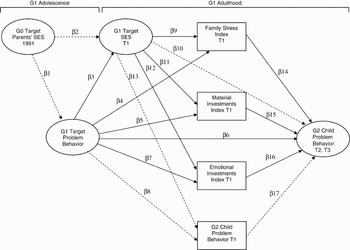
We evaluated the IMSI by testing the analytic model depicted in Figure 2. The G1 target is the original cohort member in the FTP. Because the FIM involves different types of parental investments, we include both material and emotional investments in our analytic model. For example, Yeung and colleagues (2002) found that the family's investments in learning environments was important for mediating the relation between income and a cognitive outcome, but that parenting practices and maternal emotional distress were important for a behavioral outcome. Thus, material investments and emotional investments may operate differently across different types of child developmental outcomes. To consider this possibility, we examine both material and emotional parental investments in our model.
The analytic model; G0–G2, Generations 0–2; T1 and T2, Times 1 and 2; SES, socioeconomic status. Solid arrows represent predictions consistent with the interactionist model of socioeconomic influence on child development. Dashed arrows represent additional paths to be tested (i.e., control variables). The family stress, parental investment, and child problem behavior variables at T1 are expected to be correlated.

Embedded in the analytic model are hypotheses derived from the IMSI that include hypotheses from a selection perspective, represented by paths from the G1 target's problem behavior during adolescence to their adult SES (β3), family stress (β4), material investments by G1 parents (β5), emotional investments by G1 parents (β7), and the G2 child's problem behavior (β6). Hypotheses from the FSM are illustrated by paths from the G1 target's adult SES to family stress (β9) and from family stress to the G2 child's problem behavior (β14). Hypotheses from the FIM are shown in paths from the G1 target's adult SES to material investments (β11) and emotional investments (β12) and from parental investments to the G2 child's problem behavior (β15 and β16). In addition to hypotheses derived from the IMSI, we also tested for the possibility of a direct effect of SES on G2 child problem behavior (β10). To control for the SES of G1's family of origin, we include paths from G0 SES to G1 SES (β2) and G1 problem behavior (β1).
Finally, we also include G2 child problem behavior at the same time (T1) as the investment and family stress variables to control for continuity within the domain of G2 child problem behavior over time, with paths from G1 SES and G1 problem behavior to the control (β13 and β8) and a path from the control to G2 child problem behavior (β17). Because family stress and parental investments are measured at the same time, we cannot predict from stress to investments as proposed by the IMSI (Figure 1), so we simply allow these measures to correlate with one another. Inasmuch as G1 SES refers to income and educational status during the past year, we allow it to predict the other T1 variables consistent with theoretical expectations.
Method
Participants
Data for the present study were drawn from the FTP, an ongoing, longitudinal study of 558 target youth and their families. Interviews were first conducted with members of this cohort of adolescents (G1) and their parents (G0) between 1989 and 1991, when they were in either the seventh (1989) or ninth (1991) grade. Participants were interviewed annually through 1995 (with the exception of 1993), and thereafter interviewed in alternating years, with a retention rate of about 90% through 2005. Of the original 558 families, 107 came from single-mother families and the remainder of these youth lived with both their biological parents. Participants were drawn from rural counties in north central Iowa. Because this area has a minority population of only about 1%, all the participants were European Americans from primarily lower middle and middle-class families. Additional information about the initial recruitment and the families involved is available in Conger and Conger (Reference Conger and Conger2002) and Simons and Associates (Reference Simons1996).
Beginning in 1997, the oldest biological child (G2) of the G1 target was recruited for study. To be eligible for participation the child had to be at least 18 months of age and the G1 target parent must have been in regular contact with the G2 child. The current study focuses on the 271 G1 targets who had at least one G2 child eligible for participation by 2005. Our study used data from the G1 targets' adolescent years (1991, 1993, and 1994; 9th and 10th grade and their final year of high school). These years occurred prior to the time they became parents. We also used data from the first (T1), second (T2), and third (T3) annual assessments of each G2 child. The year of these assessments (T1, T2, and T3) is dependent upon the timing of the birth of their eligible child and ranges from 1997 to 2005. On average, 90% of the G1 target parents with eligible children agreed to participate.
Our sample of 271 G1 targets with G2 children consisted of 112 G1 males and 159 G1 females. The G1 targets averaged 25.59 years of age at T1. Almost 81% of the G1 targets were living with the other biological parent of the G2 child at the time of the G2 child's first assessment (T1). The G2 children averaged 2.31 years old at their first assessment (T1), 3.30 years at their second assessment (T2), and 4.35 at their third (T3). Across the three assessment points considered in this study, the children ranged in age from 1.5 to 8.83 years old. There were 149 G2 boys and 122 G2 girls.
Procedure
G1 targets and their G0 parent(s) were recruited from public and private schools in rural areas of Iowa during G1's early adolescent years. Letters explaining the project were sent to eligible families, who were then contacted by telephone and asked to participate. Seventy-eight percent of the two-parent families, and over 90% of the single-parent families agreed to be interviewed. During each assessment period, professional interviewers made home visits to each family for approximately 2 hr on two occasions. During the visits, each family member completed a set of questionnaires covering an array of topics related to work, finances, family life, mental and physical health status, friends, and a broad range of personal characteristics.
Beginning as early as 1997 the G1 target and G2 child were visited at home once each year by trained interviewers. Data were collected from G1 targets and their G2 children, as well as from the romantic partners (married or cohabiting) of the G1 targets (when they had one), following procedures similar to those described for G1's family of origin. During the annual visits, the G1 target and participating partner (when applicable) completed a series of questionnaires on parenting beliefs and behaviors and the characteristics of the G2 child during the annual home visits. Other questionnaires on a broader array of topics, including economic circumstances and mental and physical health status also were administered.
In addition to questionnaires, the G1 participants and their G2 child participated in two separate videotaped interaction tasks: the puzzle completion task and the clean up task. Observational codes derived from these tasks were used in this study. In the puzzle completion task, G1 parents and their G2 children were presented with a puzzle that was too difficult for children to complete alone. G1 parents were instructed that children should complete the puzzle alone, but parents could provide some assistance if necessary. The task lasted 5 min. Puzzles varied by age group so that the puzzle slightly exceeded the child's skill level.
The clean-up task began with the child playing with various developmentally appropriate toys alone. An interviewer then joined the child in play. The interviewers were instructed to dump out all of the toys to set up the task. Interviewers then retrieved the parent and instructed the parent that their child needed to clean up the toys alone, but parents could provide some assistance if necessary. The task lasted 5 min for 2-year-olds and 10 min for 3- to 5-year-olds.
Both interaction tasks created a stressful environment for both parent and child and the resulting behaviors indicated how well the parent handled the stress and how adaptive the child was to an environmental challenge. We expected that skillful, nurturing, and involved parents would remain warm and supportive toward the child, whereas less skillful parents were expected to become more irritable and short-tempered as the child struggled with each task. Each interaction task was coded by a trained, independent observer who rated the quality of interactions during the task using the Iowa Family Interaction Rating Scales (Melby et al., Reference Melby, Conger, Book, Rueter, Lucy and Repinski1998).
Measures of G1 and G2 problem behavior
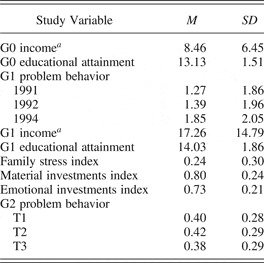
G1 adolescent problem behavior was assessed in 1991, 1992, and 1994 using 15 self-report items adapted from the National Youth Survey (Elliott, Huizinga, & Ageton, Reference Elliott, Huizinga and Ageton1985; Elliott, Huizinga, & Menard, Reference Elliott, Huizinga and Menard1989). G1 targets were asked to indicate whether they had engaged in a variety of antisocial behaviors during the past 12 months. The scale included items such as, “During the past 12 months, have you thrown objects such as rocks or bottles at people to hurt or scare them?” and “During the past 12 months, have you purposely damaged or destroyed property that did not belong to you?” Scores were summed across the 15 items to create a delinquency variety score for each of the 3 years. These variety scores were used as indicators of the G1 adolescent problem behavior latent variable; all three had positive and significant loadings (1991 = .79, 1992 = .90, and 1994 = .43). Descriptive statistics for all study indicator variables are presented in Table 1.
Means and standard deviations for study indicator variables

Note: G0–3, Generations 0–3; T1–3, Times 1–3.
aFamily per capita income in thousands of dollars.
The mother and father of the G2 child completed the Child Behavior Checklist for ages 1.5–5 or for ages 6–18 (CBCL; Achenbach, Reference Achenbach1994) depending on the age of their G2 child. Ten items measuring externalizing behaviors from the aggression subscale were common across both versions of the CBCL. These 10 items include behaviors such as physically attacking people and destroying things that belong to others. G1 parents rated the items on a 3-point scale (0 = not true of my child; 1 = sometimes/somewhat true of my child; 2 = very true/mostly true of my child). The G2 problem behavior latent variable was created in the same manner as it was for the G1s: mothers' reports of the 10 items were averaged to assess G2 problem behavior at T2 and T3, and used as indicators of the G2 problem behavior latent variable, with loadings of 0.94 (T2), and 0.71 (T3). The average of the father report of the 10 items was used to assess G2 problem behavior at T1 and is used as a control variable in our analyses.
Measures of G0 and G1 SES
We measure G0 and G1 SES using educational attainment and income as indicators of an SES latent construct, with loadings of 0.63 (education) and 0.52 (income) for G0, and 0.76 (education) and 0.42 (income) for G1. To assess G0 educational attainment in single-mother households, we used G0 mother's self-reports of years of schooling completed by 1991, and an average of G0 mother's and father's self-reports of years of schooling completed by 1991 was used in two-parent families. To assess G0 income, we used 1991 G0 family per capita income in thousands of dollars (i.e., per capita income divided by 1000). Per capita family income includes all wages, salaries, and other sources of income, such as self-employment income, farm net income, and supplemental security income, summed and divided by the number of family members living in the home. G1 educational attainment was assessed using the G1 target's self-report of years of schooling completed by the time of G2's first assessment (T1). To assess G1 income at T1, we used G1 family per capita income in thousands of dollars.
Measures of G1 family stress
Most studies that simultaneously examine multiple risk and protective factors generally treat each factor as independent, when that is often not the case (Rauer, Karney, Garvan, & Hou, Reference Rauer, Karney, Garvan and Hou2008). Most children do not experience risk and protective factors independently, but as constellations of risky or protective environments; that is, multiple risk factors tend to co-occur (Appleyard, Egelund, van Dulmen, & Sroufe, Reference Appleyard, Egeland, van Dulem and Sroufe2005; e.g., Grych, Jouriles, Swank, McDonald, & Norwood, Reference Grych, Jouriles, Swank, McDonald and Norwood2000; Osofsky, Wewers, Hann, & Frick, Reference Osofsky, Wewers, Hann and Fick1993; Spaccarrelli, Sandler, & Roosa, Reference Spaccarelli, Sandler and Roosa1994). To truly understand how these factors affect child development research must also examine how the cumulative impact of those factors affect child outcomes.
One way to do this is through the use of cumulative risk indices. Cumulative risk indices are based on the idea that individuals with dissimilar sets of risk and protective factors may still experience parallel outcomes, and thus, what is important is not whether a specific factor is present, but the number of risk and protective factors that are present (Rauer et al., Reference Rauer, Karney, Garvan and Hou2008; Rutter, Reference Rutter, Kent and Rolf1979). This approach predicts a linear relationship between risk and outcomes: Individuals with more risk factors are more likely to experience negative outcomes than those with fewer risk factors, whereas those with more protective factors are less likely to experience negative outcomes than those with fewer protective factors; thus, risk is described as cumulative (Rauer et al., Reference Rauer, Karney, Garvan and Hou2008).
Cumulative risk indices involve identifying a set of risk factors, dichotomizing the risk of each factor (i.e., present = 1, absent = 0), and summing or averaging across the dichotomized risk indicators to create a continuous index of risk for an individual (Rauer et al., Reference Rauer, Karney, Garvan and Hou2008). Of course, because data are dichotomized there is a loss of information on the variability of each factor; however, it is advantageous over other approaches in capturing the covariation of the factors within individuals and the variables are not required to be treated as independent when they may overlap substantially (Rauer et al., Reference Rauer, Karney, Garvan and Hou2008).
This approach is similar to approaches Sameroff (Sameroff, Reference Sameroff1998; Sameroff, Seifer, Barocas, Zax, & Greenspan, Reference Sameroff, Seifer, Barocas, Zax and Greenspan1987) and Furstenburg (Furstenberg, Cook, Eccles, Elder, & Sameroff, Reference Furstenberg, Cook, Eccles, Elder and Sameroff1999) have used, and the approach we take in these analyses. We used measures related to the FSM (i.e., family economic pressure, parental psychological distress, and marital conflict) to construct a cumulative risk index of family stress. Items were constructed by dichotomizing six measures of family stress (cannot make ends meet, financial cutbacks, parental anxiety, parental depression, parental hostility, and marital hostility) so that the quarter of the sample reporting the most family stress was assigned to the high family stress category (coded 1), and the remaining 75% of the sample was assigned to the low family stress category (coded 0). These scores were averaged to generate the family stress index score for each family. Most measures did not allow for an exact 25% and 75% split, which resulted in from 22.5% to 27.7% of the sample being assigned to the high stress category across different items. A brief description of each of the six measures, the percentage of the sample in the high and low family stress groups for each item, and the mean score for the high and low family stress groups for each measure can be found in Appendix A.
The G1 target's self-report was used to assess all measures in single-parent homes, and an average of G1 target's and partner's self-reports were used for all measures in two-parent families. Because single parent families were missing hostile marital interaction scores, scores were averaged rather than summed across the six components to produce indices with the same range of values for both single- and two-parent families. The family stress index had a mean of 0.24 with a standard deviation of 0.30. Approximately 46% of the sample fell into the low family stress category on all six items, whereas about 5% of the sample was in the high family stress category for all items.
G1 measures of parental investments
We used the same cumulative index strategy to create measures of parental investments. The FIM's conceptualization of parental investments includes both material investments and emotional investments (parenting goals, behaviors, and emotional attachments that foster positive developmental outcomes, see Figure 1). Our material investments index includes information on the family's standard of living, their residence and neighborhood, and learning materials in the household, and our emotional investments index incorporates information on beliefs about parenting, positive childrearing strategies, and warm and nurturing parenting.
To assess material investments we constructed an index similar to the family stress index. Each family's score on the material investment index was calculated by averaging seven dichotomous material investments items: adequate material resources, books in the home, newspapers in the home, items to promote learning in the home, quality of residence, health insurance, and neighborhood quality (details provided in Appendix B). For each item, 75% of the sample was assigned to the high material investments category, which are those families making the most material investments in the G2 child (coded 1). Some measures, however, did not allow for this 75% split, which resulted in 73.4% to 89.3% of the sample being assigned to the high investments category across items. The material investments index had a mean of 0.80 with a standard deviation of 0.24. One family (0.4%) was in the low material investments category for all seven items, whereas about 43.1% of the sample was in the high investments category for all items.
For parents' emotional investments, we constructed a cumulative investments index to assess the G1 target's, and when applicable, their partner's emotional investments in the G2 child. Each family's score on the emotional investments index was calculated by averaging 10 dichotomous emotional investment items: childrearing enjoyment, parental monitoring, consistent discipline, punitive parenting, observed harsh parenting from the videotaped observation tasks, observed warm parenting (also from the observation tasks), time spent with child, parenting learned, coparenting, and parental happiness (details provided in Appendix C). For each item, 75% of the sample was assigned to the high emotional investments category, which are those families making the most emotional investments in the G2 child (coded 1). Some measures, however, did not allow for this 75% split, which resulted in from 63.1% to 78.2% of the sample being assigned to the high investments category across items. The emotional investments index has a mean of 0.73 and a standard deviation of 0.21. About 12% of the sample was categorized as highly emotionally invested on all items; none fell into the low emotional investment category on all 10 items.
Results
Correlations
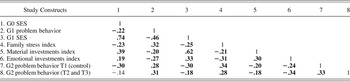
Table 2 displays correlations among the study constructs, which provide support for predictions derived from the IMSI. G1 problem behavior was significantly correlated in the expected directions with G1 SES, family stress, material investments, emotional investments, and G2 child problem behavior (e.g., r = −.46 between G1 problem behavior and G1 SES). G1 SES was negatively and significantly associated with the family stress index and G2 problem behavior, and the family stress index was positively and significantly correlated with G2 problem behavior, providing some support for the FSM portion of the IMSI. Consistent with the FIM, G1 SES was positively correlated with the material and emotional investment indices, which in turn were both significantly and negatively correlated with G2 problem behavior. The family stress index was significantly correlated with both investment indices, which is also consistent with the IMSI. Finally, our control variables, G0 SES and G2 problem behavior at T1, were significantly associated with all other study constructs, with the exception of the correlation between G0 SES and G2 problem behavior (T2 and T3), which was not significant.
Correlations among study constructs (full information maximum likelihood estimation, N = 271)

Note: Correlations in bold were statistically significant at p < .05 (direction predicted). G0–3, Generations 0–3; SES, socioeconomic status; T1–3, Times 1–3.
Structural equation models
Structural equation models were estimated using Mplus 5.1 (Muthén & Muthén, Reference Muthén and Muthén2008) and full information maximum likelihood. The latter provides more consistent, less biased estimates than ad hoc procedures for dealing with missing data such as listwise deletion, pairwise deletion, or imputation of means (Arbuckle, Reference Arbuckle, Marcoulides and Schumacker1996; Schafer, Reference Schafer1997). Four families were missing reports of G2 problem behavior at all three assessments (T1, T2, T3) and missing data on most of the other variables included in this study. Thus, these four cases were excluded from analyses, resulting in a sample size of 267 for the following analyses.
Table 3 displays model fit statistics for the selection model, the social causation model, and the IMSI. For the selection model coefficients for paths from G1 problem behavior to G1 SES (β3 in Figure 2), family stress (β4), material investments (β5), emotional investments (β7), and G2 problem behaviors (β6) were estimated, as well as coefficients for paths involving the control variables (β2, β8, and β17). Paths from G1SES to the family stress index (β9), material investments (β11), emotional investments (β12), and G2 problem behavior (β10), and paths from family stress to G2 problem behavior (β14), from material investments to G2 problem behavior (β15), and from emotional investments to G2 problem behavior (β16) were estimated for the social causation model, in addition to paths involving the control variables (β1, β2, β13, and β17). All paths from both the selection and social causation model were estimated for the IMSI (see Figure 2).
Model fit statistics and comparisons

Note: RMSEA, root mean square error of approximation; TLI, Tucker–Lewis index; CFI, comparative fit index.
As displayed in Table 3, the selection model had the worst fit of the three models, with a root mean square error of approximation (RMSEA) of 0.070 and a comparative fit index (CFI) of 0.880. The social causation model had an RMSEA of 0.049 and CFI of 0.944, suggesting it fit the data better then did the selection model. However, the model fit statistics indicate that the IMSI fit the data the best, with an RMSEA of 0.029 and a CFI of 0.982, both indicators of good model fit. Furthermore, as displayed in Table 3, differences in model fit between the models are significant. That is, the social causation was a significantly better fit to the data than was the selection model, and the IMSI fit the data significantly better than either the selection or the social causation model.
Gender differences in problem behaviors
Our model contains measures of G1 target problem behavior during their adolescence, as well as their children's problem behavior during childhood. Research on both has consistently found that males exhibit significantly higher levels of antisocial, conduct, and other externalizing behaviors than do females. Furthermore, it is not clear that trajectories of problem behavior across time, the factors that influence the development of problem behaviors, or the consequences of those behaviors operate in the same manner for males and females (Crick & Zahn-Waxler, Reference Crick and Zahn-Waxler2003; Daigle, Cullen, & Wright, 2009; Loeber & Stouthamer-Loeber, Reference Loeber and Stouthamer-Loeber1998; McFadyen-Ketchum, Bates, Dodge, & Pettit, Reference McFadyen-Ketchum, Bates, Dodge and Pettit1996; Miller, Reference Miller1994; Moffitt, Caspi, Rutter, & Silva, Reference Moffitt, Caspi, Rutter and Silva2001; Nichols, Graber, Brooks-Gunn, & Botvin, Reference Nichols, Graber, Brooks-Gunn and Botvin2006). For that reason, we performed multiple group analyses by both G1 and G2 gender on all our models.
To determine if any of the paths differed by G1 target gender, equality constraints were placed on sets of parameters in a cumulative fashion. Chi-square values for competing nested models were compared, and a nonsignificant difference in chi-square values indicated that the constrained parameters were not statistically different in magnitude for G1 females and males. Our results indicated there were significant differences between G1 target males and females, and thus models were estimated allowing separate estimates on parameters that differed significantly by G1 gender. We also tested for differences by G2 child gender in paths directly linked to G2 problem behavior, but found no significant differences between G2 males and females.
Controlling G0 SES for G1 and G2 problem behavior
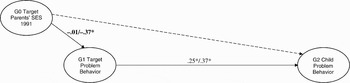
The IMSI proposes that G1 SES, family stress processes, and parental investments should intervene in relations between G1 and G2 characteristics. Thus, as a first step in these analyses, we estimated a model linking G2 problem behavior to G1 problem behavior controlling for G0 SES to evaluate the direct association between G1 and G2 characteristics. The results indicated that the path from G0 SES to G2 problem behavior was not significant. This finding is consistent with the expectation that relations between G0 SES and G2 characteristics would be indirect through attributes of G1, as proposed in Figure 2. The findings reported in Figure 3 indicate that the model demonstrated adequate fit with the data; that is, the RMSEA is <0.06 and the CFI is >0.95 (Hu & Bentler, Reference Hu and Bentler1999).
Full information maximum likelihood estimation of the model evaluating the relationship between Generations 1 and 2 (G1 and G2) problem behavior (N = 267); SES, socioeconomic status. Standardized estimates for G1 females are left of the slash and for G1 males are to the right (female/male). Coefficients in bold indicate significant differences between females and males; χ2 = 38.954, df = 34, comparative fit index = 0.985, Tucker–Lewis index = 0.981, root mean square error of approximation = 0.033; *p < .05 (direction predicted).

As noted previously, significant differences between G1 target males and females were found. G0 SES predicted adolescent problem behavior for G1 males (βmales = –0.37), but not for G1 females (Figure 3). In addition, the results indicated there was significantly greater variance for males in G0 SES variance and G1 problem behavior's residual variance. When no significant gender differences were found in a parameter, that parameter was constrained to equality across groups. However, it is important to note that even when a path coefficient is constrained equal across groups, the standardized estimates may differ for females and males because of differences in variances, such as just described. As expected, G1 problem behavior predicted G2 problem behavior, with standardized path values of 0.25 for females and 0.37 for males. This parameter did not differ significantly for males and females, although the standardized coefficients vary because of differences in variances in the measures.
Evaluating the full IMSI
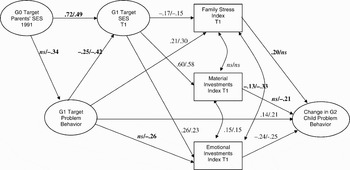
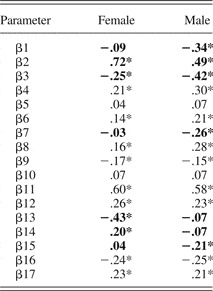
We first estimated a model with all the paths depicted in Figure 2, allowing differences between G1 males and G1 females. Following the procedures set out previously, we tested for gender differences in a cumulative fashion. Table 4 displays the standardized path estimates for the full model evaluating the IMSI and problem behavior with coefficients differing significantly by G1 gender displayed in bold. Figure 4 illustrates the significant paths and fit of the tested model, with coefficients differing significantly by G1 gender displayed in bold. Although not displayed in Figure 4, G2 child problem behavior at T1 is included in the model (as depicted in Figure 2); that is, change in G2 child problem behavior in Figure 4 is G2 problem behavior at T2 and T3 controlling for T1 G2 problem behavior. The multiple group analyses revealed the same gender differences that were found for the model presented in Figure 3: the path from G0 SES to G1 problem behavior (β1), the variance of G0 SES, and the residual variance of G1 problem behavior all differed significantly by G1's gender. Additional G1 gender differences were found for the path from G0 SES to G1 SES (β2), the path from G1 problem behavior to G1 SES (β3), the path from G1 problem behavior to the emotional investments index (β7), the path from G1 SES to the control variable G2 child problem behavior at T1 (β13), the path from the family stress index to G2 child problem behavior (T2 and T3; β14), the path from the material investments index to G2 problem behavior (T2 and T3; β15) and the residual covariance between family stress and emotional investments. With the exception of these parameters, models were estimated with all other parameters constrained to equality across G1 target males and females.
Significant path coefficients (p < .05; direction predicted) from the full information maximum likelihood estimation of the full model evaluating the interactionist model of socioeconomic influence on child development and problem behavior (N = 267). Generation 2 (G2) problem behavior at Time 1 (T1) is not displayed in the figure, but it is included in the model as a control on G2 problem behavior (T2 and T3). Standardized estimates for G1 females are left of the slash and for G1 males are to the right (female/male). Coefficients in bold indicate significant differences between females and males; χ2 = 138.786, df = 124, comparative fit index = 0.975, Tucker–Lewis index = 0.969, root mean square error of approximation = 0.030.

Predictions from the social selection perspective
As displayed in Figure 4, the path from G1 problem behavior during adolescence to G1 adult SES was significant and negative (β3), providing support for the selection portion of the IMSI. Also consistent with a selection perspective, G1 problem behavior significantly predicted greater family stress (β4) and lower emotional investments (β7), although the later was true for G1 males only. However, as displayed in Table 4, G1 problem behavior did not predict lower material investments (β5).
Standardized path estimates for Generation 1 females and males for the model evaluating the interactionist model of socioeconomic influence and problem behavior (N = 267)

Note: Bold coefficients indicate significant differences between males and females.
*p < .05 (direction predicted).
Remarkably, G1 problem behavior continued to significantly predict change in G2 problem behavior (β6), even with the inclusion of the parameters that the social causation perspective suggests should mediate this effect. However, the addition of these parameters to the model did appear to mediate partially the relation between G1 target problem behavior and G2 problem behavior: the effect size was reduced by almost half compared to the coefficients in Figure 3 for both G1 males and G1 females (βm1 = 0.37 to βm2 = 0.21, for males; βm1 = 0.25 to βm2 = 0.14, for females).
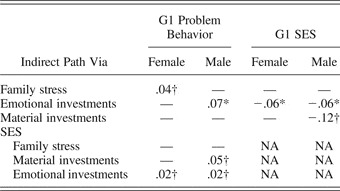
As displayed in Table 5, omnibus tests of indirect paths between G1 problem behavior to G2 problem behavior also support the mediation hypothesis. The primary indirect effects between G1 and G2 problem behavior involved family stress for G1 females, emotional investments for G1 males, SES through material investments for G1 males, and SES through emotional investments.
Indirect paths from G1 problem behavior and G1 SES to G2 problem behavior (standardized coefficients)

Note: G1 and 2, Generations 1 and 2; SES, socioeconomic status.
†p < .10 (two tailed). *p < .05.
Predictions from the social causation perspective
As depicted in Figure 4, the path from SES to family stress (β9) is consistent with the FSM: greater G1 SES predicted lower family stress (females, β = –0.17; males, β = –0.15). Family stress in turn predicted greater G2 problem behavior (β14), but only for G1 females.
Social causation arguments also were supported with the paths representing the FIM. G1 SES significantly predicted greater material investments (β11) and emotional investments (β12); in turn, emotional investments significantly predicted change in G2 problem behavior (β16). Material investments also significantly predicted G2 problem behavior (β15), but only for G1 males (males, β = –0.14).
Further support for the social causation perspective was provided by tests of indirect paths between G1 SES and G2 problem behavior, as displayed in Table 5. The primary indirect effects between G1 SES and G2 problem behavior involve emotional investments, consistent with the FIM. Also consistent with the FIM, the indirect effect of G1 SES on G2 problem behavior through material investments was significant, but only for G1 males. Remarkably, there were also significant indirect effects from G0 SES to G2 problem behavior. For G1 males, three indirect effects from G0 SES to G2 problem behavior were significant: (a) from G0 SES to G1 problem behavior to emotional investments to G2 problem behavior; (b) from G0 SES to G1 SES to material investments to G2 problem behaviors; and (c) from G0 SES to G1 SES to emotional investments to G2 problem behaviors. For G1 females, there was one significant indirect effect from G0 SES to G2 problem behaviors involving G1 SES and emotional investments.
Turning to our control variables, G0 SES significantly predicted G1 SES (β2). G0 SES also predicted G1 problem behavior (β1) for G1 males (males, β = –0.34), but not for G1 females. Our second control variable, G2 problem behavior at T1, significantly predicted future G2 problem behavior (β17). Both G1 problem behavior (β8) and G1 SES (β13) predicted this control variable, although the latter association only occurred for G1 males. Finally, the path from G1 SES to G2 child problem behavior was not significant (β10), consistent with the mediating processes proposed by the IMSI.
Discussion
This study examined how problem behaviors in one generation might lead to similar behaviors in a second generation as part of a developmental cascade involving SES, family stress, and parental investments. The study was guided by the IMSI, which combines elements of social causation arguments and social selection perspectives into a model in which G1 adolescent attributes are predicted to affect later SES and family characteristics, and SES also influences the development of individuals and families in a process that ultimately affects the next generation of children. Empirical evaluation of this model clarifies the degree to which the reciprocal dynamic specified by the IMSI actually occurs, thereby increasing understanding of the relationships among SES, family contexts, and individual lives.
The primary objective of this study was to evaluate the IMSI's utility in explaining problem behaviors across generations. We did this by using SEM to test an analytic model derived from the IMSI, focusing on the developmental outcome of child problem behavior. The data we used were from the FTP, a prospective, longitudinal study that includes extensive information on the characteristics of the G1 participants during early adolescence (before they became parents) and into adulthood, making it possible to disentangle the degree to which relations among SES, family interaction processes, and problem behaviors represent processes of social selection, social causation, or a combination of the two.
In general, we found support for the IMSI, and our results suggest it may have value in helping to explain the processes through which SES and problem behaviors cascade across generations. G1 adolescent problem behavior predicted later G1 SES, family stress, and parental emotional investments, although the latter association was significant only for males, as well as the next generation of children's problem behavior, as anticipated by the social selection components of the IMSI. Consistent with the FSM portion of the IMSI, we found a significant relation between G1 SES and family stress, and in turn, family stress predicted G2 problem behavior, although only for G1 females. Finally, as anticipated by the FIM, G1 adult SES predicted both material and emotional investments in the G2 child. In turn, emotional investments predicted G2 problem behavior, as did material investments, although the latter association was only present for G1 males.
The results of our study were largely supportive of the IMSI; however, many of our findings varied by G1 gender. For instance, G1 problem behavior during adolescence predicted G1 SES in adulthood for both young men and women, but the association was significantly stronger for males than for females. The effect of G1 problem behavior on emotional investments also varied by G1 gender: for G1 males, problem behavior during adolescence negatively predicted future emotional investments in their G2 child; however, this effect was not significant for G1 females. In their multigenerational study of at-risk males who went on to become young fathers, Capaldi, Pears, Patterson, and Owen (Reference Capaldi, Pears, Patterson and Owen2003) found an association between antisocial behavior in adolescence and subsequent poor parenting, suggesting that antisocial boys may be more likely than antisocial girls to grow up to be less effective parents. Our findings are consistent with this idea; however, the reason for the lack of a similar finding for females is unclear. Perhaps it is simply the higher rate of male antisocial behavior that generates subsequent risk for disruptions in parenting practices. This issue should be addressed in future research.
In addition, we found significant G1 gender differences in the paths from family stress and material investments to G2 child problem behavior. These gender differences suggest that some unobserved and unanticipated process in our model may play a key role in generating these gender differences. For example, traditional gender divisions of labor in the home center on the woman taking greater responsibility for maintaining harmony in family life. When that responsibility is threatened by, for example, greater family stress, it appears that this is particularly disruptive of the mother–child relationship and may result in greater problem behavior by the child. The traditional role for men, on the other hand, involves providing for the economic and material well-being for the family. It may be that men who are less able to provide sufficiently for their families by making material investments in their children may feel incompetent as fathers. This situation may impair the father–child bond in some fashion, thus increasing risk for child problem behavior. Future research will be required to determine if these gender differences replicate and, if so, what currently unmeasured processes might account for them.
The nonsignificant association between material investments and G2 problem behavior for G1 females may also reflect the outcome we are examining. That is, the mediating mechanisms posited by the IMSI may vary by outcome and individual characteristics, such as gender. When creating investment indices, we intentionally separated material and emotional investments to enable us to detect just this sort of difference across the two types of investments. These results support the conjecture that material investments are more important for cognitive outcomes, whereas emotional investments have greater influence on behavioral outcomes (e.g., Yeung et al., Reference Yeung, Linver and Brooks-Gunn2002), but that these relationships may be further moderated by gender or other characteristics.
Conclusion
In general, we found support for the IMSI: four of the five paths predicted by the selection perspective portion of the IMSI were significant (although one, the path from G1 problem behavior to the emotional investments index, was only significant for males); all of the six paths predicted by the social causation portion were significant (although material investments to G2 problem behavior was significant only for G1 males and family stress to G2 problem behavior was significant only for G1 females); and all significant paths were in the expected direction. Furthermore, model fit statistics indicated that the IMSI fits the data better than either the selection or the social causation model, and that these differences in model fit were significant. Thus, we conclude that neither the social causation perspective nor the selection perspective is satisfactory on its own and incorporating both into an interactionist model more accurately captures the complexities of the association between SES and problem behaviors over time and across generations.
Although we feel that the integrative theoretical and empirical approach of the current study offers important new insights into the interplay between SES and problem behaviors, our study is not without limitations. First, it is important to evaluate models using diverse families in terms of their structure, ethnicity, and nationality. Although there is variation in family structure in our sample, all participants were European American. Future research should replicate these findings with more ethnically diverse samples. Second, it is important to incorporate neighborhood or community effects into discussions of the impact of SES on human development (Leventhal & Brooks-Gunn, Reference Leventhal and Brooks-Gunn2000). Although we included a measure of neighborhood quality in our material investments index, future research would benefit from a more detailed and careful examination of community effects. Third, we focused on problem behavior in two generations as predictors and developmental outcomes of interest. Previous research has suggested that these processes may vary by the individual characteristics of interest, and thus, future research should consider alternative outcomes.
Despite these limitations, we believe the current study makes an important contribution to understanding the dynamic interplay between SES and human development. Previous research has suggested that SES has a greater effect on children's academic and cognitive achievement than on emotional and behavioral development (Duncan & Brooks-Gunn, Reference Duncan, Brooks-Gunn, Duncan and Brooks-Gunn1997; Haveman & Wolfe, Reference Haveman and Wolfe1994). Yet, there is much research that indicates that lower SES in childhood and adolescence is associated with greater problem behaviors (Brody et al., Reference Brody, Stoneman, Flor, McCrary, Hastings and Conyers1994; Conger et al., Reference Conger, Wallace, Sun, Simons, McLoyd and Brody2002; Dodge et al., Reference Dodge, Pettit and Bates1994; Kahn et al., Reference Kahn, Wilson and Wise2005; Keenan et al., Reference Keenan, Shaw, Walsh, Delliquadri and Giovannelli1997; Linver et al., Reference Linver, Brooks-Gunn and Kohen2002; McCoy et al., Reference McCoy, Frick, Loney and Ellis1999; McLoyd, Reference McLoyd, Taylor and Wang1997; Mistry et al., Reference Mistry, Vandewater, Huston and McLoyd2002), including this study. Thus, there is a fundamental need to improve scientific understanding of the reasons for these relations so that appropriate steps can be taken to improve the lives of families, parents, and children, especially given the long-term outcomes for some children with behavior problems (e.g., Caspi et al., Reference Caspi, Wright, Moffitt and Silva1998; Cohen, Reference Cohen1998; Kokko & Pulkkienen, Reference Kokko and Pulkkinen2000; McLeod & Kaiser, Reference McLeod and Kaiser2004). Compared to models that are built exclusively on one tradition or the other, attention to interactionist models that incorporate aspects of both social causation and social selection, such as the IMSI, aids in understanding the processes that mediate this relationship and is critical to identifying the best targets and timing of interventions designed to interrupt these negative cascades.
Appendix A The Family Stress Index
The percentage of the sample in the high family stress category and scores for the high and low stress groups

1. Can't make ends meet assessed families' ability to pay monthly bills, and is the average of two standardized items. Observed scores range from –3.71 to 5.03, with higher scores indicating greater economic pressure. Nearly 25% of the sample fell into the high stress category for this measure.
2. Financial cutbacks assessed whether families made significant cutbacks in daily expenditures because of limited resources. There is a maximum of 15 possible financial cutbacks. Families in the high stress category (23.3%) reported making almost 4 times as many cutbacks as families in the low stress category.
3. Parental anxiety was assessed with the anxiety subscale of the Symptom Checklist-90—Revised (SCL-90-R; Derogatis, 1983). Scores in the sample ranged from 1 to 4.8. Families scoring 1.25 or more were assigned to the high stress category (22.5%).
4. Parental depression was assessed with the depression subscale of the SCL-90-R (Derogatis, 1983). Observed scores ranged from 1 to 4.69. Families scoring more than 1.54 were assigned to the high stress category (25.4%).
5. Parental hostility was assessed with the hostility subscale of the SCL-90-R (Derogatis, 1983). Scores in the sample ranged from 1 to 4.67. Families scoring 1.42 or more were assigned to the high stress category (27.7%).
6. Marital hostility was assessed with the average of 13 items. The items indicated how often the participant's partner did things such as “get angry at you,” “hit, push, grab, or shove you,” and “insult or swear at you.” Scores in the sample ranged from 0 to 4.38, with higher scores indicating greater hostility. Nearly 25% of married and cohabitating couples were assigned to the high stress category (20% of entire sample), which had means nearly 3 times greater than the low stress couples.
Appendix B The Material Investments Index
The percentage of the sample in the high material investments category and scores for the high and low investments groups

1. Adequate material resources assesses whether a family could afford basic necessities such as adequate housing, clothing, food, and medical care. G1 target's self-report is used for single-parent families, and an average of G1 target's and partner's self-reports is used for two-parent families. This measure represents the view that higher SES families will be more likely to provide children with the basic necessities of life. Observed sample values range from 6 to 30, with higher values indicating greater material well-being. Families scoring more than 16 were assigned to the high investments category (73.4%), and the remaining 26.6% were assigned to the low investments category.
2. Books in the home is the interviewer's assessment of the prevalence of books in the home on a 0 (there are no books in the home) to 4 (there are many books in the home) scale. Families scoring 0 or 1 were included in the low investments category (26%). The mean for families in the high investments category was nearly 4 times greater than the mean for families in the low investments category.
3. Newspapers in the home is the interviewer's assessment of the number of newspapers and magazines in the home, and it was rated on the same scale as books in the home. Families scoring 0 or 1 were included in the low investments category (20.9%). The mean for families in the high investments category was more than 3 times greater than the mean for those in the low investments category.
4. Items to promote learning in the home is the interviewer's assessment of the prevalence of items that promote learning in the residence, and it was rated on the same scale as the two previous measures. Families scoring 0 or 1 were included in the low investments category (10.7%).
5. Quality of residence is the interviewer's assessment of the G1 target's place of residence on qualities such as cleanliness, repair, atmosphere, and safety. The average of the nine items ranges from 0.33 to 4.0 in the sample, with higher scores indicating a better quality of residence. Families scoring greater than 2.78 were assigned to the high investments category (74.6%).
6. Health insurance uses the G1 target's self-report for single-parent families and an average of the G1 target's and partner's self-report for two-parent families to assess whether the family can afford adequate health insurance. Scores ranged from 0 to 4, with 22% of the sample having scores of 2.5 or less, placing them in the low investments category.
7. Neighborhood quality uses the G1 target's self-report for single-parent families and an average of the G1 target's and partner's self-report for two-parent families to assess the family's neighborhood. Participants indicated whether things such as litter, vacant, or deserted houses or storefronts and graffiti were problems in their neighborhoods on a scale from 0 (a big problem) to 2 (not a problem at all). The average of the seven items ranged from 1.21 to 2. Families scoring less than 1.85 were assigned to the low investments group (18.3%).
Appendix C The Emotional Investments Index
The percentage of the sample in the high emotional investments category and scores for the high and low investments groups

Except where indicated, measures are from the G1 target's self-reports for single-parent families and an average of the G1 target's and partner's self-report for two-parent families.
1. Childrearing enjoyment assesses parent's enjoyment of childrearing tasks such as bathing and reading to their child. Observed scores ranged from 2.5 to 5, with higher scores indicating greater enjoyment. Families with scores greater than 4 were assigned to the high emotional investments category (75.1%).
2. Parental monitoring was assessed with an item indicating how often parents knew the child's whereabouts. Scores in the sample ranged from 1 to 4, with higher scores indicating greater monitoring. Families with scores greater than 2.5 were assigned to the high emotional investments category (63.1%).
3. Consistent discipline was assessed with eight items indicating the degree to which parents set and enforce rules. Observed scores ranged from 1 to 4, with higher scores indicating more consistent discipline. Families with scores greater than 2 were assigned to the high emotional investments category (73.4%).
4. Punitive parenting was assessed with six questions indicating the degree to which parents were harsh or punitive with their child. Items were reverse coded so that higher values represented lower levels of punitive parenting. Sample scores ranged from −2.83 to −1. Families scoring less than −2 were placed in the high investments category (78.2%).
5. Harsh parenting was assessed by trained observers who coded the quality of the behaviors during the puzzle and clean up tasks on a 9-point scale (see Melby & Conger, 2001, for details). Observed scores ranged from 0 (low harsh parenting) to 7.17 (high harsh parenting). Families scoring 2.2 or less were assigned to the high emotional investments category (70.7%).
6. Warm parenting was assessed in the same manner as harsh parenting. Observed scores had a range of 1.56 (low warmth) to 7.67 (high warmth). Families scoring more than 3.7 were assigned to the high emotional investments category (75.4%).
7. Time spent with child was coded on a 7-point scale, with higher values indicating greater time invested in the child. Families scoring more than 5.5 were placed in the high emotional investments category (73.4%).
8. Parenting learned assesses the degree to which parents felt that being a good parent takes a concerted effort and needs to be learned rather than being something innate. Observed scores ranged from 2.97 to 4.65, with higher values indicating the belief that parenting is a skill that had to be learned. Families scoring more than 3.63 were assigned to the high emotional investments category (75.2%).
9. Coparenting was assessed by having both parents report on how much they agree on childrearing and discipline. Observed scores range from 1.82 to 5, with higher values indicating greater agreement between parents. Families scoring more than 4.1 were assigned to the high emotional investments category (74.7%).
10. Parental happiness was assessed with six items such as “Even though it is hard at times, I enjoy being a parent” and “I really love my child(ren).” Observed values ranged from 3.5 to 5, with higher values indicating greater happiness. Families scoring more than 4.5 were assigned to the high emotional investments category (77.4%).