1. Introduction
Reducing barriers to trade in environmental goods and services featured prominently in the Doha Round negotiations where countries were asked to negotiate on the elimination of protection on environmental goods and services (EGS).Footnote 1 The recognized aim of these negotiations is to create a triple-win situation, for trade, for development, and for the environment. First, if negotiations were successful, trade would be facilitated through reduced or eliminated tariffs and non-tariff barriers on EGS. This would decrease the cost of environmental technologies, increase their use, and stimulate innovation and technology transfer. Second, developing countries would benefit in two ways from better market access in EGS. Producers of EGS would have better access to large markets in Europe, the US, and high-income Asia and it would be easier for developing countries as a whole to obtain high-quality environmental goods on world markets. Such access should, among other environmental benefits, increase energy efficiency and improve the water and sanitation situation in developing countries. Through technology transfer, improved technologies would reduce emissions. Third, at the global level, the environment would be better preserved, especially if a wide definition of environmental goods were adopted to include as EGS those environmental products and services with production characteristics that avoid damaging the environment (e.g. the use of biodegradable materials, or goods produced in an environmentally preferable way).
This paper reviews progress in unilateral reduction in tariffs on environmental goods (EGs) and discusses reasons for the disappointing outcome so far at the multilateral negotiations. Emphasis is on implications for developing countries. We describe the lack of agreement on the approach to follow (list, project, request and offer) and discuss the difficulties in establishing a list of products for negotiation to reduce protection (six lists were submitted with little overlap in products). We also show that unilaterally, no acceleration in the reduction in tariffs on EGs has been observed since the launch of the negotiations ten years ago, and draw the implications for middle and low-income countries if there were agreement on a standstill which would bind tariffs at their current applied levels.
Why so little progress? This disappointing outcome could reflect strategic behavior (a bargaining chip in a framework where negotiations are multi-dimensional). Here we explore two other reasons for the lack of progress. First, we discuss the impact of inherent ‘technical’ difficulties in identifying EGs on negotiations. Second, we analyze the characteristics of the goods submitted on the six lists to see whether countries took a mercantilistic or an efficiency view in their selection of products for inclusion on their respective lists. Our conclusion is that technical difficulties in defining EGs and conflicting political economy motives both contributed to the lack of progress in reducing barriers to trade in environmental goods.
The paper proceeds as follows. Section 2 discusses the approaches to classification suggested by countries. Among the proposals was a ‘list approach’ to the negotiations. Even though there was little overlap across the six proposed lists that led to the WTO combined list of 411 products, it is used in Section 3 to show how protection of EGs has evolved over the period 1996–2010, the longest period for which we have data at the HS-6 level on imports and tariffs for a large number of countries. Section 4 explains how the inherent difficulties in identifying those ‘goods and services which measure, prevent, limit, minimize or correct environmental damage’ (OECD/EUROSTAT, 1999: 9) prevent negotiations from progressing. Section 5 then turns to a discussion of the political-economy determinants of goods proposed on the lists. Section 6 concludes.
2. Approaches and the different lists
There are no provisions in the WTO legal system related specifically to environmental goods and services (EGS), except for the application of the MFN clause and a general interdiction of quantitative restrictions which applies also to trade in goods. Neither is there an agreed-upon definition of what an ‘environmental good’ is for the simple reason that the WTO legal system reflects the results of previous rounds and jurisprudence and EGs were only introduced in the Doha Round. Under the Committee on Trade and Environment in Special Session (CTESS) Work Programme,Footnote 2 WTO members were invited to suggest approaches to reduce protection of ‘environmental goods’ and to make submissions that would help define a ‘universe’ of ‘environmental goods’ (hereafter EGs) subject to tariff reductions. We review the different approaches and the submission process that resulted in the WTO ‘combined list’ of 411 HS-6 goods and the subsequent ‘core list’ of 26 goods.
2.1 The different approaches
Until 2010, three broad approaches were proposed: the ‘List approach’, the ‘Request and Offer approach’, and the ‘Integrated-Project approach’. Then, during the recent intensification of negotiations, ‘hybrid’ approaches were also proposed.
(i) List approach: Under this approach, WTO members put lists of products up for tariff reductions. According to a group of nine ‘friends’,Footnote 3 goods on the agreed list would be subject either to total tariff elimination or to a two-pronged tariff elimination with a certain percentage of goods on the list to have tariffs removed and the remainder eliminated in a phased down calendar. Another option, proposed by the USFootnote 4 would be a core list for tariff elimination and a complementary list from which members would select a certain percentage of tariff lines. Because developing countries felt that the core list would include mostly goods of interest for developed countries, China proposed a common list and a development list (drawn from the common list) for exemption or lower tariff reductions to reflect the principle of ‘less than full reciprocity’.Footnote 5
The core/common list with a complementary/development list reflects the view that Members should first agree on a reduced list of EGs to start the negotiations, and that negotiations should take into account Special & Differential (S&D) treatment via different lists, or differential treatment on a common list. However, members failed to agree on such a list, although the group of nine ‘friends’ mentioned above proposed a set of 164 products in 2007 and 2009 as a ‘potential set of convergence’ (the ‘friends’ or nine members' – 9M – list).Footnote 6 More recently, other WTO members have also identified 26 products as a potential starting-point for negotiations (the ‘core list’, see below).
(ii) Request and offer, proposed by Brazil in 2007.Footnote 7 Here countries would request specific tariff cut commitments on products of interest and then extend these tariff-cuts to all WTO members based on the MFN clause. Some developing countries perceived that this approach would shield them from a formula-based across-the-board tariff reduction.Footnote 8
(iii) Integrated-project, proposed by Argentina and India.Footnote 9 Here, national authorities would select projects (for instance under the Clean Development Mechanism of the Kyoto Protocol), thereby addressing the ‘multiple-uses’ issue raised by the list approaches (see below). EGS necessary for the selected projects would then temporarily benefit from enhanced market access. This approach does not require international agreement, but this is at the cost of uncertainty for exporters (even if categories of goods were to be identified multilaterally in advance).
(iv) Hybrid approach, proposed by Australia, Colombia, Hong Kong, Norway, and Singapore.Footnote 10 This proposal combines all the elements on the table: (a) an agreed core list on which all members would make commitments (proponents of this Hybrid approach have identified 26 HS-6-digit codes from the reference universe on an illustrative and starting-point basis, see below); (b) a complementary self-selected list (mainly for developed countries); (c) a complementary request-offer approach, the outcome of which would be multilateralized on an MFN basis; and (d) environmental projects could be used to identify other lines as of environmental interest.
2.2 The submission process leading to the ‘WTO combined’ (411 HS codes) and ‘core’ (26 HS codes) lists
Following an initial period of illustrative submissions between 2002 and 2005,Footnote 11 under the 2008 CTESS Work Programme, WTO members were officially invited ‘to make submissions identifying EGs of interest to them across as many categories as possible, and/or EGs identified in any requests/offers they would have made to other Members' to determine the ‘universe’ of EGs, and to identify environmental categories for the project approach. For the reasons discussed above, with the exception of the Philippines, developing countries did not participate. Thirteen countries participated in the submission process resulting in six lists once nine members submitted their joint ‘Friends list’ (number of HS-2002 6-digit codes in parenthesis): Saudi Arabia (262), Japan (57), Philippines (17), Qatar (20), Singapore (72), and the group of nine Friends (164), which includes Japan.Footnote 12
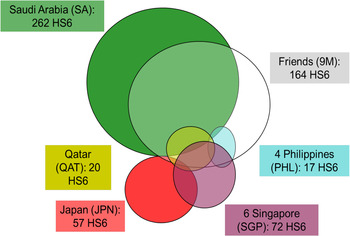
Figure 1 shows the very limited overlap across lists suggestive of the diverging positions as to countries' perceptions about which goods should be considered as ‘environmental’, but also suggests conceptual difficulties in identifying what an environmental good is (see Section 4 below). In fact, not a single product appears on all six lists and more than two-thirds of the products proposed appear only on one list. Only seven products are common to four lists. More than 80% of the 90 duplicates belong to the nine Friends' list, of which almost three quarters (54 HS codes) are common also to Saudi Arabia's list, and another quarter (20 HS codes) common to Singapore's proposal.
The geography of overlaps: WTO list (411 products)

Due to partial overlaps, the combined list (hereafter the ‘WTO list’) contains 411 unique HS-2002 6-digit level codes (see Balineau and de Melo, Reference Balineau and de Melo2011: annex II),Footnote 13 from which, Australia, Colombia, Hong Kong, Norway, and Singapore drew a ‘core list’ of 26 products in 2011 that could serve as a starting point for WTO negotiations. A limited overlap across lists demonstrates the limited commonality in perception and likely makes it more difficult to reach an agreement. It could be, however, that if countries were to mutually recognize each other's lists, reduction in trade barriers to trade in EGs would be deeper.
The 411 HS-6 codes fall within 24 of the 96 2-digit HS-2002 Chapter classification, with almost one-third under HS Chapter 84 (machinery and mechanical appliances, for example pumps for air handling equipment, turbines, and machinery for waste management). Chapter 85 (electrical machinery such as generators), Chapter 90 (precision instruments to monitor and analyze the environment), and Chapter 73 (articles of iron or steel like tubes, pipes, tanks and reservoirs for water treatment) respectively account for 16%, 13%, and 11% of the WTO combined list of EGs. Energy-efficient or cleaner vehicles (Chapter 87) proposed by Japan account for 7% of the list. Ethers and ketones of Chapter 29 (proposed by Saudi Arabia as ‘Carbon Capture and Storage’ (CCS), ‘Gas flaring emission reduction’, or ‘Efficient Consumption of Energy’ (EC) technologies) account for another 7%. Plastic articles (Chapter 39), mainly suggested by Saudi Arabia as CCS- or EC-technologies, account for 5%.
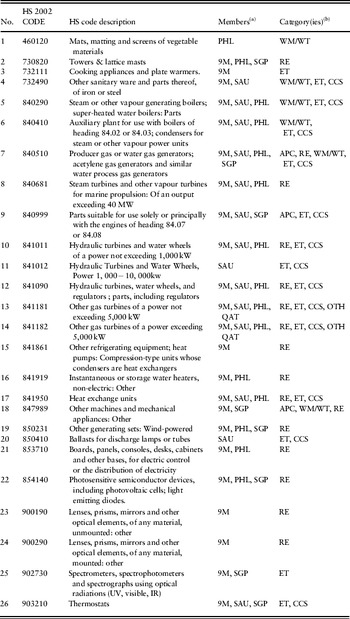
Table 1 lists the 26 HS codes of the ‘core list’, the countries that proposed the good in individual submission, and the categories under which that good was classified in the submission. Among these goods identified as ‘clear environmental goods’ in the ‘core’ list, seven are singles, five are common to two submissions, 11 are common to three submissions, three are quadruplicates, and 23 are on the Friends' list. Chapter 84 accounts for half of the goods on the core list, the remainder being distributed between Chapters 85, 90, and 73.
The ‘Core List’

Source: Authors, compiled from country submissions and TN/TE/20.
Notes: (a) 9M=Nine Friends, PHL=Philippines, SGP=Singapore, SAU=Saudi Arabia, QAT=Qatar, (b) EG categories: APC=Air Pollution Control, RE=Renewable Energy, ET=Environmental Energy, CCS=Carbon Capture and Storage, WM/WT=Water Management/Water Treatment, OTH=Other.
3. How much reduction in protection
As a first check on progress in reducing barriers, we plotted the shares of imports of EGs by income group for the core and combined lists over the period 2000–10 (see Balineau and de Melo, Reference Balineau and de Melo2011: figure VI-A, annex VI).Footnote 14 For the combined list, the share is unchanged at 20% for the high-income group, rises from 15% to 20%+ for the lower-middle and upper-middle groups and from 12% to 38% for the low-income group. For the core list, the graph shows that the share of EGs in total imports fluctuates between 0.5% and 1% for the low-income countries and 1.5% and 2% for the lower-middle-income countries. Since the combined list includes many multi-purpose goods (e.g. vehicles or parts), working with the core list is more representative of what has been done in reducing protection on EGs over the period. Then we compare tariff reductions for EGs with tariff reduction on non-EGs by taking five-year averages over intervals starting in 1996 to see if there are any noticeable differences.
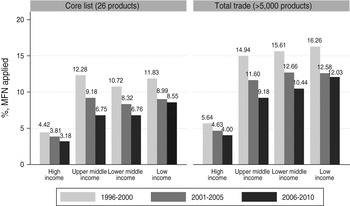
Four patterns are apparent in the data describing the evolution of applied tariffs by income group in figure 2 for the ‘core list’ (very similar results hold for the ‘combined list’ in Balineau and de Melo, Reference Balineau and de Melo2011: annex V). First, protection of EGs remains highest in the low-income group. But with average tariffs in the 10%–15% range, this was barely high enough to be rewarding for a bilateral barter among developing countries by a request-and-offer approach. As to developed countries, average tariffs were around 5%, so their expected gains from participation in the negotiations would be from reduction in tariffs for developing countries. Second, the absolute gap in protection between the low-income group and the other developing groups remained constant, and the number of duty-free tariff lines is still very low for the low-income group, standing barely above 10% at the end of the period (see Balineau and de Melo, Reference Balineau and de Melo2011: figure VI-B in annex VI). Third, the data show a steady decline in tariffs across income groups, all groups reducing tariffs by about 50% over the period (tariffs have been reduced by an average of 6 percentage points, ranging from 2 percentage points for high-income to 11 percentage points for low-income countries – see ibid.: table VI-C in annex VI). Fourth, for all income groups, EGs are less protected on average than other goods, but the gap in average protection has remained fairly constant for all products and across groups (similar results are reported by Monkelbaan (Reference Monkelbaan2011) on the basis of inspection of the Friends' list). Insofar as EGs are mostly made up of intermediate goods, this pattern is to be expected from an outcome in which tariff levels are at least partly determined by lobbying activities, which will be more intensely directed against intermediate goods (see e.g. Cadot et al., Reference Cadot, de Melo and Olarreaga2005).
Evolution of the average rate of protection, 1996–2010 (by income group)

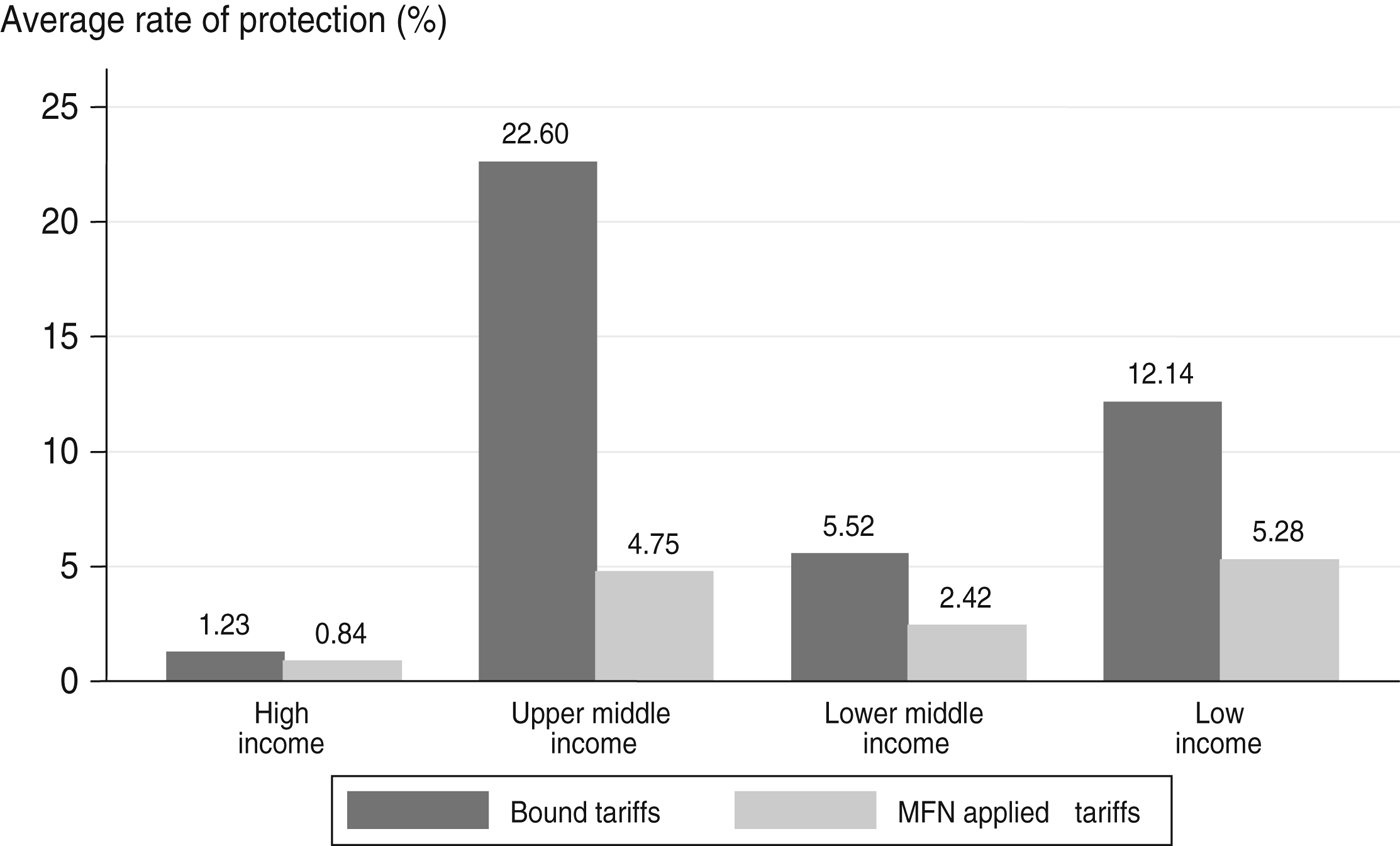
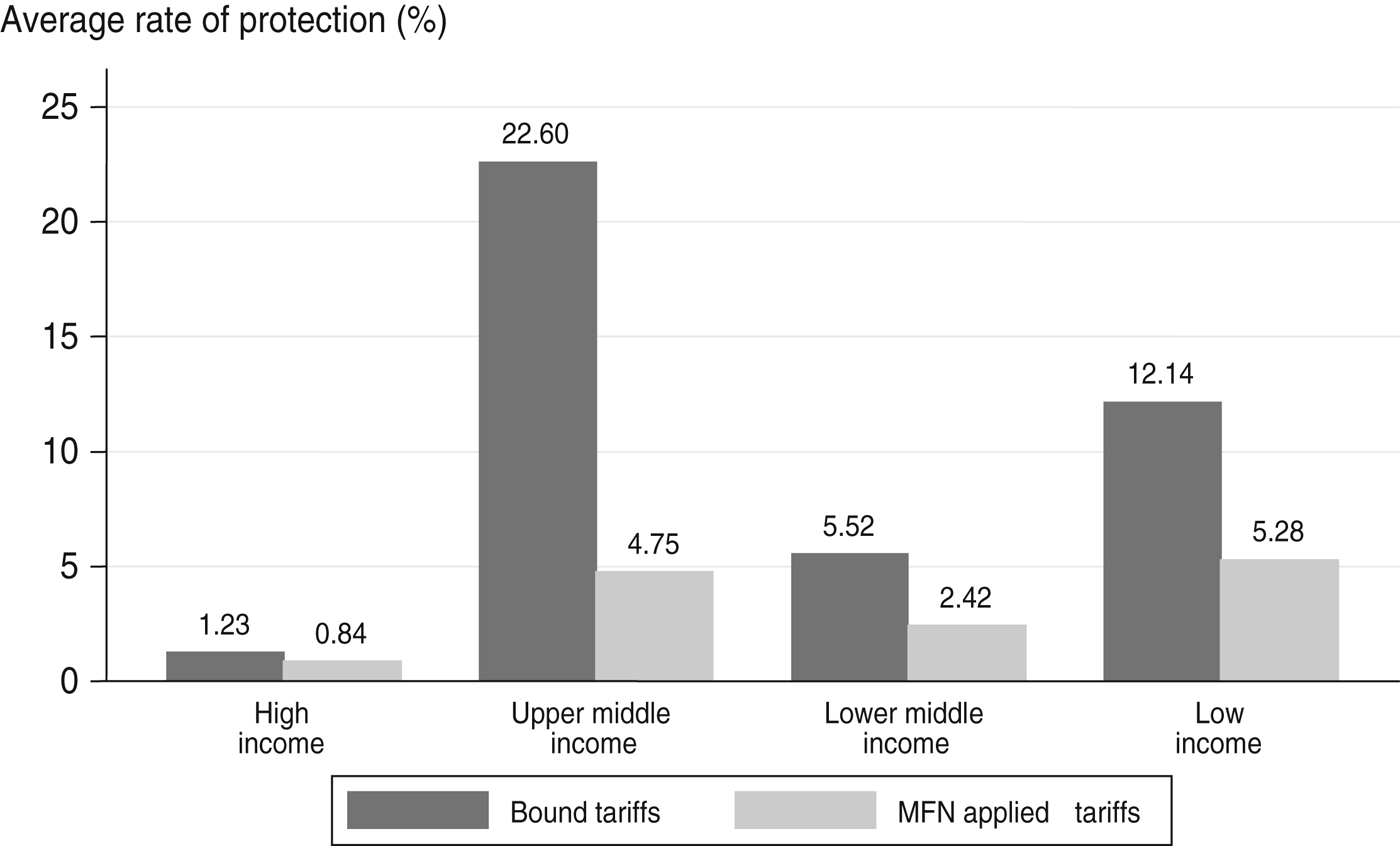
Turning to the pattern of reduction in protection for the EG group, the data show no acceleration in the reduction in tariffs on EGs relative to other products as the Doha negotiations proceeded. This was especially the case for the low-income group where the reduction in protection was greatest during the 2002–04 period.Footnote 15 As shown in figure 3, this means that in a standstill compromise, whereby tariffs would be bound at the current applied MFN rate rather than at the current bound rate, the high-income group would not lose much leeway in tariff-setting since for most countries in the group applied tariffs are already at their bound levels. The upper middle-income countries would lose the most leeway.Footnote 16 Otherwise, as expected, the removal of flexibility in tariff-setting would hit the low-income group more than the lower-middle-income group, an observation also made by Vossenaar (Reference Vossenaar2010) and Monkelbaan (Reference Monkelbaan2011).
MFN applied tariffs and bound tariffs for EGs in 2010 (Core list 26 products)
We also examined cases of ‘substantial tariff reductions’ defined as tariff reductions of 5 percentage points or more, e.g. a tariff that is reduced from 12% to 7%, where the threshold was chosen to correspond to the reduction in tariffs over the sample during the 1996–2010 period (6 percentage points, see table VI-C). Results show that two-thirds of the countries (86) had at least one substantial tariff reduction (i.e. an ‘event’) during 1996–2010 (i.e. a reduction of at least 5 percentage points). Three patterns emerge: (i) events are fairly evenly distributed across products (HS-6-digit codes) with each product in the core list accounting for about 4%–5.30% of the number of events; (ii) events were concentrated in the middle-income group; (iii) the upper-middle-income and low-income groups had the highest average absolute reduction per event. Considering that the average reduction was more than 12 percentage points for these groups, it is likely that the greatest efficiency gains from tariff reduction took place in upper-middle-income and low-income groups.Footnote 17
In Balineau and de Melo (Reference Balineau and de Melo2011), we also estimated import responses for those occurrences of ‘substantial’ (5 percentage points) tariff reductions. The estimates show that for about 65% of the events, the average imports were higher after the event than before the tariff reduction, and, on average, imports were between 50% and 100% higher after the reduction in tariffs. Since under normal circumstances, imports would be growing in real terms, we carried out the same estimates for the control group (i.e. the HS-6 tariff lines that did not have an event during the period). Import growth was less in the control group, but not significantly so (see Balineau and de Melo, Reference Balineau and de Melo2011: table 1). In sum, the event analysis does not suggest a significant import response to tariff reductions.Footnote 18
Why so little progress? As pointed out in the introduction, this could reflect strategic behavior (a bargaining chip in a framework where negotiations are multi-dimensional). The next sections explore two other reasons for the lack of progress. Section 4 discusses how the inherent ‘technical’ difficulties in identifying EGs could prevent the negotiations from progressing. Section 5 analyzes the characteristics of the goods submitted on the six lists to see whether countries took a mercantilistic or an efficiency view in their selection of products for inclusion on their respective lists.
4. Difficulties and obstacles in selecting environmental goods
Figure 1 showed the limited overlap between lists, illustrating the difficulties in building a consensus about what products should be considered as ‘environmental goods’. Since countries were asked to provide next to each HS product code one of six categories to which they think the product belongs (see the definitions in the bottom of table 1), and any comments on the environment benefit or rationale for the selection of that particular product, it is easy to see that the submitters of EGs lists disagreed as much about this classification as they did about the choice of products. For the 90 duplicates, only 31 were grouped in the same category by both submitters. For the 59 remaining products, that is to say for over two-thirds of the HS codes that were proposed by more than one country or group, there is no consensus about the classification of the environmental benefits of these products.Footnote 19
This disagreement on the definition of EGs and on the benefits provided by EGs reflects the members' diverging perceptions as to their interests which are accommodated in the two complementary conceptions of EGs: (i) ‘goods for environmental management’ – GEMFootnote 20 – and; (ii) ‘environmentally preferable products’ – EPPs) in the literature (see for example OECD/Eurostat, 1999, and Hamwey, Reference Hamwey2005). We present both showing how the difficulty in operationalizing them contributed to the stalemate in the negotiations.
4.1 EGs as ‘goods for environmental management’ (GEM)
GEM can be defined as ‘products [and services] that reduce environmental risk and minimize pollution and resource use’ (OECD/Eurostat, 1999: 9). This category includes goods and services used in ‘pollution management’ (e.g. tubes, pipes, filters and chemicals used in sewage and wastewater treatment; mixing, kneading, grinding machines used for solid waste recycling services; pumps, air compressors used to control air pollution; and measuring equipment to monitor the environment (optical instruments for example)). It comprises also ‘resource management’ products such as renewable energy equipment (towers and lattice masts for wind turbines, photosensitive devices and optical fibers used to generate, concentrate or intensify solar power) or indoor air pollution control equipment.
The main difficulty with GEM is that they generally have multiple end-uses. For example, tubes and pipes used in water treatment can also be used for the transport of natural gas. Several WTO members, including developing countries, have tabled an informal document stressing the importance of only liberalizing trade in environmental goods that serve a single environmental end-use (Claro et al., Reference Claro, Lucas, Sugathan, Marconini and Lendo2007: 8). However, if a list approach is used to identify EGs, there is a major identification problem as the Harmonized Commodity Description and Coding System (HS) was not designed according to end-use. A finer HS classification specifying ‘ex-outs’ (goods which are not separately identified at the HS-6 harmonized level so that they have to be identified in national tariff schedules at the eight- or ten-digit level) could partially help solve the multiple-use problem, but this would be particularly costly and difficult to implement for some developing countries. Moreover, this is only a partial solution (Steenblik, Reference Steenblik2005b; Kim, Reference Kim2007).
Another way to deal with multiple end-uses is to use a project approach in assessing whether the product (e.g. a turbine) being used is to improve the environment, which is the justification for the define-by-doing-approach. For example, among competing approaches that have been proposed to liberalize goods, those proposed by India (‘the project approach’) and Argentina (‘the integrated approach’) avoid the dual-use problem. However, this approach has its own drawbacks as it is ‘temporary’ and up for capture by interest groups. Under these approaches, only EGs selected by national authorities for environmental projects would temporarily benefit from enhanced market access.
4.2 EGs as ‘environmentally preferable products’ (EPPs)
Contrary to GEM, environmentally preferable products (EPPs)Footnote 21 are single-use products that produce less environmental damage either in their production, their use, or their disposal. Each EPP has a close substitute, with a similar use but which is less environmentally preferable (for example the use of biodegradable vs. non-biodegradable products).Footnote 22 The main problem with EPPs is ‘relativism’, in the sense that criteria to judge what is ‘environmental friendly’ are lacking. Apart from the divergence in preferences (conceptions of the ‘environment’), this is also due to the hurdles facing the completion of a life-cycle assessment (LCA)Footnote 23 as an EPP may be used and disposed of in different ways (Hamwey, Reference Hamwey2005). For other goods or human activities, criteria are lacking because of scientific knowledge gaps (particularly for those goods differentiated by processes and production methods (PPM) of which the impact is ‘indeterminate’ (see Balineau and Dufeu, Reference Balineau and Dufeu2010; Moïsé and Steenblik, Reference Moïsé and Steenblik2011). For example, whereas Brazil proposed the inclusion of biofuels in EGs,Footnote 24 Steenblik (Reference Steenblik2007) and Hufbauer et al. (Reference Hufbauer, Charnovitz and Kim2009) stress that the use of bio-fuels to save on energy and to reduce CO2 emissions is doubtful. Without clear scientific knowledge to bring to the negotiations, Brazil's pursuit of its export interests would be preferable to production of biofuels by the EU or the US, but still be detrimental for the environment.
Besides, because most if not all EPPs have conventional counterparts, further liberalization for EPPs would require dealing with the problem of ‘like products’ so that the promotion of trade in EGs would not create unnecessary restrictions to international trade (contrary to GATT article XI). This problem affects goods which differ in their processes or production methods without being modified in their final physical characteristics (in that case PPMs are referred to as ‘non-product-related’ PPMs), as customs agents cannot discriminate among products based on the way they are produced. For instance, while some governments may want to discriminate between wood products derived from sustainably grown forests from other wood products, they cannot do so if the unlikeliness of these two types of wood products is not established. While discrimination according to PPMs would be seem possible, especially if human health or the conservation of exhaustible natural resources is concerned, the jurisprudence at the GATT/WTO on PPMs is still in flux. More importantly, such discrimination (through applying differential tariff rates) would require agreement on universally accepted labels in an extended HS classification. Moreover, several members, including developing countries, are against designating PPMs-based EGs. Developing countries actually fear that this would open the door to discrimination against their products based on other than environmental concerns (e.g. ‘social concerns’ based on the absence of legislation on domestic workers' rights).Footnote 25 Other members (e.g. the European Union and Switzerland) suggested that product-related PPMs (i.e. PPMs that modified the final physical characteristics of products in a way that their use or disposal is less harmful for the environment) could benefit from additional discussions. Peru proposed to include organic products in EGs.Footnote 26 The difficulty here is to prove that organic production methods are product-related (e.g. consumers may want to rinse thoroughly a chemically treated apple while wasting less water with an organic apple, see UNEP and IISD, 2005), and subsequently to reflect this agreement in a suitably modified HS system according to a universally accepted label.Footnote 27
5. The political economy of submissions
For countries that submitted lists, the selection of goods was governed by a combination of overall efficiency considerations and narrower interests of pressure groups. If the strongest lobbies are in exporting activities, then goods on the list would be in sectors in which the country has a comparative advantage (here measured by an index of Revealed Comparative Advantage (RCA) defined below) in which case the selection would be welfare-enhancing. If, on the contrary, the strongest pressure groups are in highly protected import-competing industries, then the results of lobbying would be to avoid the submission of goods with high tariffs (here defined by goods with tariff peaks, also defined below, and the selection process would not have been guided by efficiency criteria). If the selection of goods was governed by efficiency considerations, the list would include either (or both) goods with high tariffs and/or goods in which the country has a comparative advantage.
In sum, if members were intent on reducing barriers to trade in EGs, they would include in their submission list goods with relatively high tariffs as this would lead to a more substantial reduction in barriers to trade in EGs. Alternatively, or concurrently, countries might take a more mercantilistic view and propose for inclusion in the list products in which they perceive they have a comparative advantage that they could exploit if tariffs were lowered by other countries. Submitting for inclusion in a list a product in which a country has a comparative advantage is then also efficiency-enhancing. On the other hand, not submitting goods that are highly protected is inefficient and very likely to represent a protectionist motive.
We examine both possibilities. First, we verify that the selection of the 411 goods in the WTO combined list was not random. Next, we check whether countries submitted mostly goods in which they had high tariffs (measured by the percentage of submissions from goods with tariff peaks) or goods in which they had a comparative advantage (measured by the index of Revealed Comparative Advantage (RCA)). The formula for the RCA is:
 $$RCA_i^j = \displaystyle{{E_{i,j} /\left( {\sum _j E_{i,j}} \right)} \over {\left( {\sum _i E_{i,j}} \right)/\left( {\sum _i \sum _j E_{i,j}} \right)}}\quad i = 1, \ldots, 154;\;j = 1, \ldots, 4920$$
where Ei,j is exports by country i of good j (where intra-EU27 trade is excluded). The formula says that country i has a RCA in good j if (RCA ij>1), i.e. if country i's share of good j, say shirts, in i's total exports is greater than the share of shirts in total world exports.
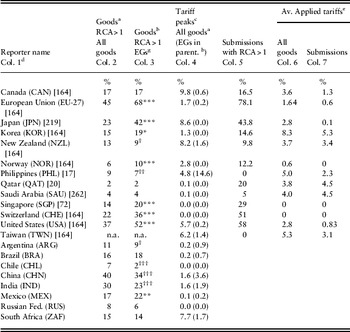
Table 2 displays the share of goods with RCA>1 for the countries that submitted lists and, in the bottom, for a selection of other countries that might (but did not) participate in the submission process. Column 2 shows the share of goods with an RCA>1 in total trade and column 3 reports the percentage of goods with an RCA>1 among EGs (i.e among the 411 goods in the WTO's combined list – henceforth the EG list). For example, the EU has an RCA>1 for 45% of its exports and an RCA>1 for 68% of the goods on the EG list.
Tariff peaks and revealed comparative advantage: all products and EGs

Notes:
a 4920 HS-6 products;
b WTO combined list (411 products);
c Tariff peaks: a tariff rate at least three times the average tariff over all HS-6 goods;
d Number of goods submitted (See text);
e Average effectively applied (unweighted) tariff on all goods and on the submission list (in brackets in col. 1)
g * (resp. †) indicates that the proportion of EGs with an RCA>1 (col. 3) is significantly higher (resp. lower) than the proportion of goods with a RCA>1 (col. 2). The number of symbols indicate the conventional levels of significance (*** or ††† for the 1% confidence level, **or †† for the 5%, and *or † for the 10% level).
Sources: RCA (cols 2 & 3): WITS, Trade Indicators. Tariffs: TRAINS data. Year=2007, HS 2002 classification. Countries below line (Starting with Argentina did not submit a list).
With an RCA>1 for more than 30% of the products in the EG list, high-income countries and China lead in terms of the number of EGs in which they have a comparative advantage. Because the RCA also reflects countries' trade policies, the RCA is not a ‘true’ indicator of comparative advantage (hence the wording ‘revealed’ in the indicator). Unfortunately, there are no operational alternatives to the RCA for large data sets. However, for high-income countries, tariffs and other forms of protection on EGs is low, so the patterns of comparative advantage estimated by the RCA index are probably sufficiently representative of the ‘true’ pattern of comparative advantage.
Column 4 shows the percentage of goods with a tariff peak for all goods and, in parenthesis, for the EG list. For example Canada has a tariff peak of 9.8% for all products but only 0.6% on the EG list. With the exception of the Philippines, all countries who submitted lists had a lower percentage of goods with tariff peaks on the EG list than on their respective total goods lists. By contrast, for the non-participant countries in the bottom part of the table, often the percentage of tariff peaks in the EG list was higher than in the corresponding list for all goods. For example, for China the percentage of tariff peaks on the combined list is over twice as large as for all goods. In sum, the difference in distribution of tariff peaks across the two groups is suggestive of why developing countries would not have wanted to participate in the submission process since they might have been ‘forced’ to accept reducing tariffs on goods in which they had tariff peaks.
To what extent does the EG list (the WTO combined list) reflect characteristics of those who participated in the submission process. First, we check whether the selection of goods in the submission lists was ‘by chance’ (rather than according to comparative advantage). With 4920 HS-6 products in the sample for 2007, and 411 products in the EG list, there is a 411/4920=8.3% probability that a HS-6 heading is an EG good. Among those that submitted a list, the probability that a selected product has an RCA>1 ranges from 45% for the EU to 2% for Qatar. So the probability that a randomly selected EU export with an RCA>1 is on the WTO combined list is 45%*8.3%=3.7% and for Qatar is 2%*8.3%=0.1%. (For the Philippines, the corresponding probability is 9%*8.3%=0.7%.) Except for Qatar and Saudi Arabia, these probabilities (in the range 0.7%–3.7%) are much lower than the percentages reported in column 3. The EG list has a greater share of goods with an RCA>1 for submitters than if they had been pulled out of a hat. As to tariff peaks, the pattern is opposite. Taking countries with tariff peaks on more than 4% of all goods (for the others tariff peaks are negligible), if selection had been random, the probability that it would be a good with a tariff peak would have ranged from (4.8%*8.3%=0.4%) for Philippines to (9.8%*8.3%=0.8%) for Canada. So the EG list has fewer products with tariff peaks among submitters than if they had been selected randomly among the products with tariff peaks.
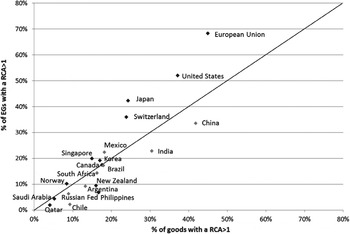
For each country in table 2, figure 4 plots the share of goods with an RCA>1 on the EG list against the share of goods with an RCA>1 in total goods exported by that country on the horizontal axis.Footnote 28 Since submitters generally refrained from picking goods with tariff peaks, so one can safely assume that they were looking to secure in the combined list goods in which they had a comparative advantage. If all countries had the same success in this presumed objective, all the points would be on, or close to, the 45° line. This is generally not the case as just about all countries that submitted lists are above the 45°. Not surprisingly, high-income countries who participated had a comparative advantage in the goods selected on the combined list that they helped construct. Second, non-participation is clearly revealed in the figure as all non-participants (except Mexico) are below the 45° line. The Philippines, the only developing country on the submission list is also below the 45° line. It is then not surprising that developing countries did not submit lists.Footnote 29 Third, among participants, with the exception of New Zealand, Qatar and Saudi Arabia, it is the high-income countries that have a pattern of RCA skewed towards EGs. This could simply reflect one of the stylized facts behind the environmental Kuznets curve, namely that the demand for higher environmental quality is a normal good. Finally, some developing countries, such as Mexico, India and China, could have been expected to participate as they had high shares of goods with an RCA>1. All in all, the pattern in figure 4 where developing countries are usually below the 45° line gives support to the often-heard complaint by developing countries that goods in the EG list are of little export interest to them.
Comparative advantage in EGs vs overall comparative advantage (2007)

Consider now the selection process leading to the EG list. As discussed in Section 2.2 (also see figure 1), a long negotiation process took place between 2002 and 2010. We have limited information on the successive lists proposed during the submission period, as well as about the bargaining among the nine ‘friends’. Therefore we cannot study the negotiation process among the nine countries that led to the joint submission under the ‘Friends’ list’ of 2007 (the 9M list of 164 products – see the number of products in the submission lists in table 2, column 1), nor can we study the successive submissions. So we study the characteristics of the final submission lists. Column 5 gives the percentage of goods with an RCA >1 in the respective lists. For example, Canada had an RCA>1 for 16.5% of the products on the 9M list. This percentage is low but not surprising, since, with the exception of Switzerland and Norway, the small countries in the friends' list had a much smaller share of goods with an RCA>1 than the US (58%) and the EU (78%). This outcome reflects the larger share of goods with an RCA>1 for those two countries, but far more it reflects their bargaining power within the group.Footnote 30
Overwhelmingly, countries did not propose including highly protected goods. Inspection of the data (not reported here) shows that of the 118 goods in the tariff peak range, only 22 goods with tariff peaks were proposed for inclusion in the lists, that is less than 20% of the products with tariff peaks. Philippines, a developing country, is no exception: it has tariff peaks in close to 10% of the products in the combined list, yet of the 17 products it suggested for inclusion, none belonged to the list of 31 products with a tariff peak. This is also confirmed by the figures in the last two columns of table 2 which show that the average effectively applied tariff for goods on the submission lists are lower than the average tariff on the universe of goods. The exceptions were Saudi Arabia and Qatar for whom goods on their submission list had a significantly higher average tariff.
Finally, we check further how consistent these patterns are with predictions from the theory of endogenous protection. A large literature has developed on the determinants of protection since the influence-driven approach proposed by Grossman and Helpman (Reference Grossman and Helpman1994), itself an extension of the political-support approach proposed by Hillman (Reference Hillman1982) in which governments choose redistributive policies taking into account lobby contributions. The key insight of that literature is that, controlling for the importance attributed to consumers' welfare by the government, equilibrium protection should be higher in large sectors and lower in sectors that produce intermediate goods since they are subject to counter-lobbying by downstream sectors. Applying this approach to the choice of goods to put up on a list for tariff reduction, in the absence of data on production and on intermediate use at this disaggregated level, one would expect that due to lobbying, goods with high tariffs would stand a lower probability of being selected. One would also expect that lobbies in industries in which countries have a comparative advantage would push for having these goods included in the submission list.
For each country I=1,…,13, we estimate separately the following probit in which the probability that good j will be on the list of country i is a function of RCA j and of the height of the applied tariff on good j, TARIFF j:
 $$Pr(LIST_j = 1) = \varphi (\alpha _0 + {\rm} \alpha _1 RCA_j + {\rm} \alpha _2 TARIFF_j ){\rm ;}\quad j = 1, \ldots, 411$$
where φ is the cumulative normal distribution, α 0 is a constant, RCA j is the index of revealed comparative advantage defined in (0.1) above, and TARIFF j is the average effective tariff applied on imports of good j.
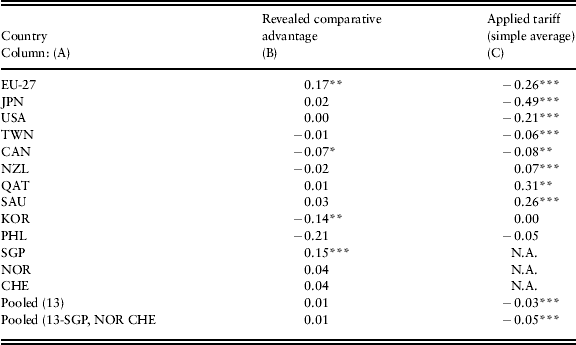
Results in table 3 reveal two patterns. For countries on the friend's list, with the exception of Korea and New Zealand, the negative estimate for α 2 confirms that submissions excluded the more highly protected goods (Norway and Switzerland having zero tariffs on goods in the EG list are not concerned). For Qatar and Saudi Arabia (along with New Zealand), the probability of being on the submission list included was positively correlated with the height of the tariff on the good. In general, the correlation with the index of revealed comparative is unstable and/or not significant. This is not surprising insofar as it could reflect the loss of support from exporters to push for tariff reductions as the low level of protection reduce the gains from tariff reductions.Footnote 31 The pooled results at the bottom of the table confirm that for the whole sample of submissions, goods with high protection were excluded from the submission lists.
Probit estimates of determinants of products on liberalization lists
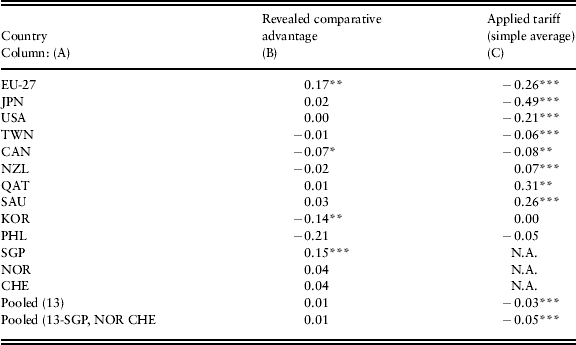
Notes: Since Singapore, Norway and Switzerland, applied a tariff rate of 0 on EGs, the TARIFF variable is dropped from eq (1).N.A.=not applicable.
Source: Authors' estimates.
6. Conclusions
Symptomatic of the cleavages across countries throughout the Doha negotiations, little progress was achieved in defining an approach to reducing protection of EGs – this in spite of the Doha Round being called the Round for ‘developing countries and for the protection of the environment’. Conflicting interests and differing perceptions of the benefits provided by EGs were reflected in the different proposed approaches (request and offer, integrated project, list approach, hybrid approach). And for the thirteen countries that adopted a list approach, there was minimal product overlap across submissions.
The paper then reviewed progress (by income group) at reducing tariffs unilaterally over the period 1996–2010. For all income groups, on average, EGs are less protected than other goods and, during the period, countries reduced protection by about 50% from initial levels. Protection of EGs remains highest in the low-income group, and the absolute gap in protection between the low-income group and the other developing country groups remained constant over the period 1996–2010. Should a standstill compromise be concluded whereby tariffs would be bound at the current applied MFN rate rather than at the current bound rate, the upper middle-income countries would lose the most discretionary leeway in tariff-setting.
At first sight, the lack of progress in the negotiations might appear paradoxical since average effective applied protection in 2010 was low regardless of the selection of goods for an EG list (for a ‘core’ group of 26 EGs for a list of 104 WTO members, average MFN applied tariffs ranged from less than 1% for developed countries to 5% for low-income countries). Yet, with the exception of China who proposed a common list and a development list (drawn from the common list) for exemption or lower tariff reductions to reflect the principle of ‘less than full reciprocity’, developing countries refrained from proposing a list approach. Few developing countries tabled propositions. Brazil proposed a request and offer approach, and Argentina and India proposed an integrated approach. Either alternative was perceived as a shield from an across-the-board tariff cut under a list approach which might have led to deep tariff cuts. With low tariffs all around, expected benefits from lobbying to open partners' markets would be low, but so would be adjustment costs for tariff reductions on domestic markets.
Two reasons for the lack of progress in the negotiations were then discussed, one related to the implications of the large range of perceptions about the benefits that EGs fulfill (better management of the environment to less harmful effects on the environment), the other to the political economy of trade policy formulation. Regarding perceptions of the environmental benefits provided by EGs (e.g. improving the management of the environment, or shifting towards producing goods that are environmentally preferable), these are difficult to define. Countries would have to overcome the difficult hurdle of agreeing on a new HS classification system that would encompass these objectives. Perhaps difficulty in reaching agreement in a large group of negotiators explains why APEC members agreed in September 2012 on a list of 54 EGs on which they would reduce tariffs. If the current stalemate in the negotiations is indicative of delays in devising new HS classification system, negotiations could last a long time.
We then studied the lists that 13 countries submitted for tariff reductions and the resulting combined list of 411 goods drawn by the WTO on the basis of the various submissions. Assuming that countries would participate to have included in a combined list goods in which they had a comparative advantage (measured by the index of ‘revealed comparative advantage’) and/or high (low) tariffs, we confirmed that the WTO list reflected disproportionately goods in which these countries had a comparative advantage, and excluded, again disproportionately, goods in which they had high tariffs. This mercantilistic approach to trade negotiations was also evident in the Vladivostok declaration of September 2012 in which APEC members agreed to reduce applied tariffs to 5% or less on a list of 54 EGs (all from the WTO combined list) by the end of 2015. Indeed, APEC members accounted for 70% of world exports for the products in this list.
And if this combined list could be construed as approximating a comprehensive list of EGs, then the major developing countries that might have been expected to participate in the submission of lists, had a smaller proportion of goods than those who participated, confirming their perception that a list approach would end up mostly reflecting the comparative advantage of high-income countries. In the end, with average tariffs for EGs close to three times higher for developing countries compared with high-income countries, reciprocal trade gains would be from bilateral reductions between developing countries. However, overall, it is the developed countries that generally have a comparative advantage in EGs.
Interestingly, for countries that participated in the submission list process, even though they refrained from submitting products with high tariffs, their average effective applied tariffs on the goods in this comprehensive list were less than their average protection for all goods while the opposite held for a selection of major developing countries that might have been expected to participate in the submission process The so-called ‘friends' list’ that collected the submissions of nine OECD countries showed that, with the exception of Switzerland and Norway, the small countries had little bargaining power as they had a much lower share of goods in which they had a comparative advantage in the submission list than they would have had if shares in the combined list were equal to their share of goods with a comparative advantage in the universe of HS goods. In sum, the combined/core list drawn up for negotiations in 2010 was mostly made up of products in which large developed countries had a comparative advantage, and developed countries generally avoided submitting goods that were highly protected, leading to the conclusion that the Doha mandate requesting countries to negotiate on means to reduce protection on EGs (article 31) elicited a mercantilistic response.
This response helps explain why developing countries have been reluctant to negotiate tariffs reductions on environmental goods. This outcome is all the more regrettable as recent research suggests that the elimination of protection on environmental goods would help technology transfer towards developing countries. From an inspection of a large sample of Clean Development Mechanism projects, Schmid (Reference Schmid2012) shows that projects are more likely to have a technology transfer component when host-countries' tariffs are low, and estimates that a 10% increase in the applied MFN tariff rate on environmental goods is associated with a 3 percentage point decrease in the likelihood of technology transfer in a project.