INTRODUCTION
Visceral leishmaniasis (VL) is ranked second in mortality and fourth in morbidity among tropical diseases, with 20 000 to 40 000 deaths per year and over 2 million DALYs (disability-adjusted life years) lost (McCall et al. Reference McCall, Zhang and Matlashewski2013). Over the past decades, alternative drugs or new formulations of old ones have become available but, as yet, none of them are ideal for treatment due to high toxicity, resistance issues, prohibitive prices, long treatment length or inadequate mode of administration not adapted to the field. In addition, many patients are unable to complete the whole treatment, increasing the risk of drug resistance development (Freitas-Junior et al. Reference Freitas-Junior, Chatelain, Kim and Siqueira-Neto2012).
Following the observation that recovery from infection confers immunity to reinfection in leishmaniasis, the development of effective vaccines represents one of the most promising approaches for providing cost-effective interventions against this disease. The first vaccine against leishmaniasis, popularly known as leishmanization, was developed in the early 1940s. Due to its hazardous effects, leishmanization was replaced by first-generation vaccines, composed of killed parasites or crude extracts and live attenuated parasites (Modabber, Reference Modabber2010). However, the success of these vaccines in humans has generally been poor due to the failure to elicit adequate cellular immunity, an essential feature for the control of intracellular infections (Roberts, Reference Roberts2006). The newer vaccines under consideration comprise recombinant DNA-derived antigens and peptides. Some of the target antigens are species and life-cycle stage specific, while others are shared by promastigotes and amastigotes (Handman, Reference Handman2001). These second and the third-generation subunit vaccines include gp63, LACK, LeIF, TSA, 78 kDa antigen etc. (Nagill and Kaur, Reference Nagill and Kaur2011). Glucose-regulated protein 78 (GRP78), also known as BiP (Binding protein) is a 78 kDa Ca2+ binding chaperone molecule and belongs to the heat shock protein 70 family (HSP70). Nagill and Kaur (Reference Nagill and Kaur2010) showed that immunization with 78 kDa in combination with various adjuvants imparts different degrees of protection in BALB/c mice against VL, maximum protection being observed in mice immunized with 78 kDa antigen in combination with rIL-12, MPL-A and liposome encapsulated antigen.
Immunotherapy with or without chemotherapy has been used for treatment of cutaneous leishmaniasis in Venezuela for more than a decade. In Brazil, repeated daily doses of killed Leishmania amazonensis vaccine (‘Mayrink vaccine’) (Mayrink et al. Reference Mayrink, Magalhaes, Michalick, da Costa, Oliveira, Melo, Toledo, Nascimento, Dias, Genaro, Hermeto and Williams1992) are given with a low dose of antimonial (8 mg kg−1 body weight per day) for four cycles of 10 injections given daily, followed by a 10-day rest. The vaccine has been registered in Brazil as an adjunct for low-dose chemotherapy. In Sudan, a trial involving patients with persistent PKDL showed that the cure rate with immunochemotherapy was significantly higher than that with chemotherapy alone (sodium stibogluconate; SSG) (final cure rates: 87 and 53%) respectively. The vaccine was a mixture of killed Leishmania major adsorbed on alum plus BCG, given four times at weekly intervals (Musa et al. Reference Musa, Khalil, Mahgoub, Elgawi, Modabber, Elkadaru, Aboud, Noazin, Ghalib and El-Hassan2008).
While there may be a therapeutic role for immunomodulators in the future, none is available or recommended for routine use at present. As therapeutic vaccines can be evaluated rapidly at lower cost, immunochemotherapeutic vaccines may be achievable. Therefore, we tested immunochemotherapy to determine the safety, immunogenicity and probable curative potentials of 78 kDa antigen in combination with a conventional drug (SSG) in mice infected with Leishmania donovani. The current study is expected to assist in the evaluation of immunochemotherapy as an improved antileishmanial therapy.
MATERIALS AND METHODS
Parasite and culture conditions
Leishmania donovani promastigotes of strain MHOM/IN/80/Dd8, originally obtained from the London School of Hygiene and Tropical Medicine, London, were used for the present study and maintained in vitro at 22±1 °C in modified NNN medium by serial cultures after every 48–72 h (Rao et al. Reference Rao, Mahajan and Ganguly1984).
Animals
Inbred BALB/c mice of either sex, weighing 20–25 g were used for the present study. The animals were obtained from the Institute of Microbial Technology, Chandigarh, India and then maintained in the Central Animal House, Panjab University, Chandigarh. They were kept in appropriate cages with water and food ad libitum throughout the experiment time. The ethical clearance for conducting various experiments mentioned in the study on BALB/c mice was obtained from the Institutional Animal Ethics Committee (IAEC) of the Panjab University, Chandigarh, India.
Drug formulations
SSG was obtained from Wellcome Research Laboratories, UK in the pure form and dissolved in distiled water at 72 °C to get a concentration of 40 mg kg−1 body wt (Sodhi et al. Reference Sodhi, Kaur, Mahajan, Ganguly and Malla1992).
Identification and electro-elution of 78 kDa antigen
The 78 kDa antigen of L. donovani was identified by 2-dimensional gel electrophoresis with the help of molecular weight markers as described by Nagill and Kaur (Reference Nagill and Kaur2010).
Preparation of 78 kDa with MPL-A
The 78 kDa antigen alone (without any adjuvant) was also used as a vaccine candidate for immunization. 78 kDa+MPL-A vaccine was prepared by the addition of 144 μL solution of MPL-A (conc. 10 mg mL−1, and purchased from Sigma Aldrich Co., USA) to 360 μg of 78 kDa antigen. Subcutaneous route was used for immunization of mice in all the groups (Nagill and Kaur, Reference Nagill and Kaur2010).
Experimental infection
In vivo infection:
Mice were infected intracardially with 107 promastigotes/0·1 mL (Kaur et al. Reference Kaur, Sachdeva, Dhuria, Sharma and Kaur2010).
Treatment groups
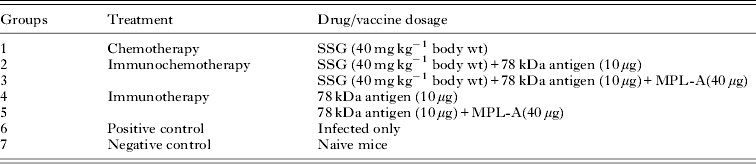
Animals were divided into different groups. Each group consisted of 18 mice as shown in Table 1.
Various groups used in the study

Group 1 (Chemotherapy): Mice from each group received intraperitoneal injection of SSG (40 mg kg−1 body wt) for 2 cycles of 5 injections daily followed by 14 days rest.
Group 2–3 (Immunochemotherapy): Animals in these groups were given a combination of drug and vaccine i.e. Group 2 animals were given SSG+78 kDa and animals in Group 4 were injected with SSG+78 kDa+MPL-A. In both of these groups, SSG was injected intraperitoneally in 2 cycles of 5 days each with an interval of 14 days between each cycle and 2 subcutaneous doses of vaccine were given at 18 days interval; the first dose of vaccine was administered along with the first dose of drug treatment.
Group 4–5 (Immunotherapy): Treatment of animals that received immunotherapy only, that is 78 kDa alone (Group 4) and 78 kDa+MPL-A (Group 5), also consisted of 2 subcutaneous injections at same intervals. In Group 4, each mouse received 10 μg of 78 kDa antigen while in Group 5, each mouse received 10 μg of 78 kDa antigen along with 40 μg of MPL-A.
Group 6 served as positive control (Infected mice only) and Group 7 served as negative control (naive mice). Naive mice includes those animals which were neither infected with promastigotes of L. donovani nor given any kind of treatment whereas Infected mice were given 1×10⁷ promastigotes of L. donovani.
Parameters studied
Assessment of infection
Six mice from each group were euthanased on 1 (55 days post infection (dpi), 15 (70 dpi) and 30 (85 dpi), post treatment days (ptd). Livers and spleen of all the animals were aseptically removed and their impression smears were microscopically examined after fixing and staining the slides with Giemsa. In order to quantitate levels of infection, Leishman Donovan units (LDU) were calculated as: Number of amastigotes/Number of cell nuclei×weight of organ in milligrams (Bradley and Kirkley, Reference Bradley and Kirkley1977).
Delayed type hypersensitivity (DTH) responses
All groups of mice were challenged in the right foot pad with a subcutaneous injection of leishmanin in the right foot pad and left foot pad with PBS. [For preparing leishmanin, promastigotes in the stationary phase of growth were harvested from modified NNN medium and washed thrice with PBS (phosphate buffer saline). The final pellet was then suspended in 5 mL of 0·5% phenol in sterile PBS and kept at room temperature for 10 min. The phenol was then removed and the final concentration was adjusted to 2×10⁸ promastigotes per mL.] After 48 h, the thickness of the right and left foot pads was measured by using a pair of vernier callipers. The percentage increase in the thickness of the right foot pad as compared with the left was calculated (Kaur et al. Reference Kaur, Kaur, Garg, Mukherjee, Raina and Athokpam2008).
ELISA for parasite-specific IgG1 and IgG2a isotypes
The specific serum immunoglobulin G (IgG) isotype antibody (IgG1 and IgG2a) response was measured by conventional ELISA following the method of Kaur et al. (Reference Kaur, Kaur, Garg, Mukherjee, Raina and Athokpam2008).
Determination of cytokine responses
The lymphocytes from spleens of infected and drug-treated mice were cultured in 24-well plates in 1 mL of RPMI-1640 containing 20 mm NaHCO3, 10 mm HEPES, 10 U mL−1 of penicillin, 100 μg mL−1 streptomycin and 2 mm L-glutamine and 10% FCS. Cells were stimulated with 50 μg mL−1 of the respective antigen (78 kDa or crude antigen) and then cells were incubated at 37 °C for 72 h and cell free supernatants were collected and stored at −20 °C. This was then assayed for IL-2, IL-10, IL-4 and IFN-γ by using ELISA kits (BenderMed Systems, Diaclone, France) (Kaur et al. Reference Kaur, Kaur, Garg, Mukherjee, Raina and Athokpam2008).
Statistical analysis
Two-way analysis of variance (ANOVA) and Post-hoc tests were used to investigate differences between groups. All Pairwise Multiple Comparison Procedures were performed using the Holm-Sidak method. The results were considered statistically significant when P<0·001 and P<0·05.
RESULTS
Parasite load
The parasite burden in liver and spleen of mice was calculated in all groups of mice on 1, 15 and 30 ptd and was measured in terms of LDU. Parasite load in liver increased significantly in infected control BALB/c mice on different post infection days. In contrast, in the treated animals, the parasite load declined significantly (P<0·05) from 1 to 30 ptd. In the animals treated with SSG, the parasite load declined by 88·49 to 91·27% as compared with the infected controls from 1 to 30 ptd. When the animals were given immunochemotherapy and treated with SSG along with 78 kDa antigen alone or with adjuvant MPL-A, the level of protection increased significantly (P<0·001). Animals treated with SSG+78 kDa showed a reduction of 90·97–97·80% in the parasite load while least parasite load was observed in animals treated with SSG+78 kDa in combination with MPL-A. The decline in parasite load in this group of animals was 95·34–99·44% as compared with the infected controls (Fig. 1). The splenic parasite burden was also significantly reduced in all the treated groups as compared with control animals (data not shown).
Parasite load in terms of LDU in infected and drug treated mice on different post treatment days. The data are presented as mean±s.d. of six mice per group. (*) P value: Infected only vs Infected+78 kDa/Infected+78 kDa-MPL-A/Infected+SSG/Infected+SSG+78 kDa/Infected+SSG+78 kDa+MPL-A; (!, @) P value: Infected+SSG vs Infected+SSG+78 kDa/Infected+SSG+78 kDa +MPL-A; (α) P value: Infected+ 78 kDa vs Infected+SSG+78 kDa+MPL-A. (*), (!), (α) -(P<0·001); (@) –(P<0·05).

Delayed type hypersensitivity responses
The DTH responses were measured as an index of cell-mediated immune responses. In all the groups of animals, the DTH responses increased significantly from 1 to 30 ptd. The treated animals revealed significantly (P<0·001) higher DTH responses in comparison to the infected controls. However, animals treated with SSG+78 kDa along with MPL-A induced the highest level of DTH response followed by those treated with SSG+78 kDa and SSG (Fig. 2).
Percentage increase in footpad thickness (DTH response) in infected and drug-treated mice on different post treatment days. The data are presented as mean±s.d. of six mice per group. (*) P value: Infected only vs Infected+78 kDa/Infected+78 kDa+MPL-A/Infected+SSG/Infected+SSG+78 kDa/Infected+SSG+78 kDa+MPL-A; (!) P value: Infected+SSG vs Infected+SSG+78 kDa/Infected +SSG+78 kDa +MPL-A; (α) P value: Infected+ 78 kDa vs Infected+SSG+78 kDa +MPL-A. (*), (!), (α) -(P<0·001).

Specific antibody responses
The humoral response was characterized by analysing the distribution of IgG1 and IgG2a specific antibodies in the sera of treated and control animals. In all the groups of animals, IgG1 and IgG2a antibody responses were evaluated in the serum samples by ELISA using specific anti-mouse isotype antibodies. Treated animals showed higher IgG2a and lower IgG1 antibody levels in comparison to the infected controls (P<0·001). The maximum levels of IgG2a antibody were observed in the mice treated with SSG+78 kDa+MPL-A (P<0·001). The SSG+78 kDa recipient mice also produced significant levels of IgG2a antibody (Fig. 3A). In contrast to the IgG2a levels, the treated animals revealed significantly (P<0·001) lesser IgG1 levels as compared with the infected controls. The animals treated with SSG in combination with 78 kDa alone or with adjuvant MPL-A revealed significantly (P<0·05) reduced IgG1 levels as compared with those treated with 78 kDa alone or 78 kDa+MPL-A. Minimum IgG1 levels were observed in the animals immunized with SSG+78 kDa+MPL-A (Fig. 3B).
Levels of Leishmania-specific IgG antibodies in serum samples of BALB/c mice. A –IgG2a, B – IgG1. The data are presented as mean±s.d. of six mice per group. (*) P value: Infected only vs Infected+78 kDa/Infected+78 kDa+MPL-A/Infected+SSG/Infected+SSG+78 kDa/Infected+SSG+78 kDa+MPL-A; (!) P value: Infected+SSG vs Infected+SSG+78 kDa/Infected +SSG+78 kDa +MPL-A; (α) P value: Infected+ 78 kDa vs Infected+SSG+78 kDa +MPL-A. (*), (!), (α) -(P<0·001).

Cytokine responses
The concentration of Th1 specific cytokines, that is, IFN-γ and IL-2 were significantly (P<0·001) higher in the treated mice as compared with the infected controls. Maximum concentrations of these cytokines were observed in animals treated with the combination of SSG+78 kDa along with MPL-A. As compared with this group, the mice immunized with SSG+78 kDa showed significantly (P<0·05) lesser concentration of these cytokines. Least concentration of these cytokines was observed in the animals treated with the immunotherapy alone (Fig. 4A and B). The levels of Th2 regulated cytokine IL-10 (P<0·001) and IL-4 (P<0·05) were significantly lesser in treated animals as compared with the infected controls. Maximum levels of this cytokine were observed in the infected controls. Animals treated with SSG+78 kDa+MPL-A showed least concentration of IL-10 and IL-4 (Fig. 5A and B) (P<0·001). As compared with this group, the concentration of the cytokine was significantly (P<0·05) higher in the animals treated with SSG+78 kDa followed by SSG.
Effect of treatment on A – IFN-γ, B –IL-2 cytokine levels of BALB/c mice. The data are presented as mean±s.d. of six mice per group. (*, #) P value: Infected only vs Infected+78 kDa/Infected+78 kDa+MPL-A/Infected+SSG/Infected+SSG+78 kDa/Infected+SSG+78 kDa+MPL-A; (!, @) P value: Infected+SSG vs Infected+SSG+78 kDa/Infected +SSG+78 kDa +MPL-A; (α) P value: Infected+ 78 kDa vs Infected+SSG+78 kDa +MPL-A. (*), (!), (α) -(P<0·001); (#), (@) –(P<0·05).

Effect of treatment on A -IL-10, B –IL-4 cytokine levels of BALB/c mice. The data are presented as mean±s.d. of six mice per group. (*) P value: Infected only vs Infected+78 kDa/Infected+78 kDa+MPL-A/Infected+SSG/Infected+SSG+78 kDa/Infected+SSG+78 kDa+MPL-A; (!, @) P value: Infected+SSG vs Infected+SSG+78 kDa/Infected +SSG+78 kDa +MPL-A; (α) P value: Infected+ 78 kDa vs Infected+SSG+78 kDa +MPL-A. (*), (!), (α) -(P<0·001); (@) –(P<0·05).

DISCUSSION
For the control of leishmaniasis, although improved drug regimens and new drug combinations are becoming available, complete elimination of the parasite is never achieved. Similarly, a combination of drugs and vaccines or even vaccine alone has been successfully used to treat American cutaneous leishmaniasis over the past years (Mayrink et al. Reference Mayrink, Botelho, Magalhaes, Batista, Lima, Genaro, Costa, Melo, Michalick, Williams, Dias, Caiaffa, Nascimento and Machado-Coelho2006), with a low number of recurrence cases. Combined anti-Leishmania treatment using vaccine and drugs would enhance drug efficacy and stimulate host immune responses, resulting in a therapeutic harness of cellular immune protection (Borja-Cabrera et al. Reference Borja-Cabrera, Santos, Santos, Trivellato, Kawasaki, Costa, Castro, Nogueira, Moreira, Luvizotto, Palatnik and Palatnik-de-Sousa2010). Parasite antigens that preferentially stimulate the induction of significant protection through Th1 response present a rational approach for a vaccine against leishmaniasis. Therefore, in the present study the therapeutic potential of immunochemotherapy was tested by treating infected mice with a pentavalent antimony drug (SSG) along with 78 kDa antigen formulated with an adjuvant (MPL-A).
To assess the protective efficacy of immunochemotherapy against murine VL, the parasite load was analysed in terms of LDU. Maximum killing of the parasite was observed in animals treated with a combination of a drug and a second-generation vaccine. About 99·49% protection was observed which suggested more effectiveness of the drug with a specific antigen along with an adjuvant. These results are consistent with our earlier studies where experimental infection of mice immunized with second-generation antigen (78 kDa) along with an adjuvant (MPL-A) induced 92% protection against L. donovani infection (Nagill and Kaur, Reference Nagill and Kaur2010). Similarly, in an earlier study, the therapeutic efficacy of Leishmune, the only licensed vaccine against canine leishmaniasis, was assessed for immunochemotherapy in combination with allopurinol or amphotericin B, in dogs. It was observed that by the end of 8 months, no parasite antigens were observed in lymph nodes of 80% of immunochemotherapy-treated dogs. This suggests that the combination therapy not only abolished the symptoms but also the latent infection, curing the dogs (Borja-Cabrera et al. Reference Borja-Cabrera, Santos, Santos, Trivellato, Kawasaki, Costa, Castro, Nogueira, Moreira, Luvizotto, Palatnik and Palatnik-de-Sousa2010). Moreover, Murray et al. (Reference Murray, Brooks, DeVecchio and Heinzel2003) tested an immunochemotherapy protocol in L. donovani-infected mice by the association of amphotericin B with IL-12 and observed that, despite this drug's direct action against parasites and its independence from host immunity, the combination was more efficient than the monotherapy. In our study, SSG+78 kDA+MPL-A has shown maximum elimination of parasites because of the combination of SSG+78 kDa with adjuvant MPL-A. Several studies have demonstrated that the adjuvant either directly or indirectly stimulates the production of the T helper cell type 1 (Th1) cytokines IL-2 and IFN-γ (Gustafson and Rhodes, Reference Gustafson and Rhodes1994). In addition, MPL-A activates monocytes and macrophages (Ribi et al. Reference Ribi, Cantrell, Takayama, Qureshi, Peterson and Ribi1984). It is likely that these monokines lead to the recruitment and maturation of dendritic cells in the lymph nodes (Jonuleit et al. Reference Jonuleit, Knop and Enk1996) where the dendritic cells can efficiently present antigen to T lymphocytes. Therefore, the combination has been found to be most effective in eliminating the parasites. However, it was reported earlier that complete clearance of parasites did not occur even from liver when BALB/c mice infected with high dose of L. donovani parasites were treated with anti-IL-10 Ab in combination with pentavalent antimonials or AmB (Murray et al. Reference Murray, Brooks, DeVecchio and Heinzel2003; Banerjee et al. Reference Banerjee, De and Ali2008). It has been reported that in genetically susceptible (Nramp1s) mice (including BALB/c and C57BL/6), parasite numbers rapidly expand in hepatic mononuclear phagocytes, followed over the subsequent 2–4 weeks post-infection by a T cell-dependent decline in tissue parasite numbers (Bradley and Kirkley, Reference Bradley and Kirkley1977) whereas parasite numbers increase more slowly in the spleen, and total splenic parasite burdens usually only reach 5–10% of maximum levels in the liver, often with greater variation between individual mice than in the livers of the same animals (Stanley et al. Reference Stanley, Zhou, Amante, Randall, Haque, Pellicci, Hill, Smyth, Godfrey and Engwerda2008). Moreover, as BALB⁄ c mice develop self-limiting infection, no relapse occurs in them. Hence, it was assumed that neither chemotherapy nor satisfactorily expressed T cell-dependent host immune responses could eradicate all tissue parasites in any form of leishmaniasis (Banerjee et al. Reference Banerjee, De and Ali2008).
Delayed-type hypersensitivity (DTH) is the cell-mediated immune response for the clearance of pathogen from infected host that potentiates the infiltration of lymphocytes and macrophages into the infected tissue (Khabiri et al. Reference Khabiri, Bagheri and Assmar2007) and has been frequently used as a correlate for protection against or sensitization to Leishmania antigen (Hamid et al. Reference Hamid, Simin and Davood2007). The DTH responses to leishmanin after treatment were much higher in mice treated with a combination of drug and an immunomodulator than the groups of animals treated with chemotherapy or immunotherapy alone. The DTH responses are also evaluated in correlation with parasite burden. The higher the DTH responses, the lesser is the parasite load and greater is the efficacy of the drug (Sharma et al. Reference Sharma, Sehgal and Kaur2012).Our results also demonstrate a negative correlation between enhanced DTH responses and reduced parasite load for all the therapeutic treatments.
We further characterized the immunological response by analysing the distribution of IgG1 and IgG2a specific antibodies in the serum samples of BALB⁄c mice. The serum samples of treated animals showed higher antibody titres with elevated levels of Th1 cytokine-regulated antibody, IgG2a when compared with infected mice. IgG2a titres were highest in mice that were treated with a combination of a drug and a second-generation antigen.
It has been well established that profound impairment of the immune system of the infected host in VL is a major cause for partial success of the antileishmanial chemotherapy, and success of cure depends on the combined effect of drug and immune status of the host (Banerjee et al. Reference Banerjee, De and Ali2008). Recovery from leishmaniasis is strongly co-related with the development of distinct T helper type 1 (Th1) cell mediated immune responses manifested by the production of cytokines such as IFN-γ and IL-2 by T cells that activate macrophages and kill intracellular parasites (Dey et al. Reference Dey, Dagur, Selvapandiyan, McCoy, Salotra, Duncan and Nakhasi2013). In contrast, Th2 cell-mediated immune response limits the action of Th1 functions via IL-10 which deactivate macrophages helping intracellular parasite growth and disease progression (Awasthi et al. Reference Awasthi, Mathur and Saha2004). IL-10 has been suggested to play a role in counterbalancing the exacerbated polarized response that may develop following cure (Tripathi et al. Reference Tripathi, Chandra and Naik2008). Spleen provides an appropriate environment for the priming/activation of T and natural killer (NK) cells by antigen presenting cells (APCs) during L. donovani infection (Gorak et al. Reference Gorak, Engwerda and Kaye1998). The infection stimulates rapid interleukin 12 (IL-12) p40 production by splenic dendritic cells (DCs) within the discrete T-cell zone in the periarteriolar lymphoid sheath (PALS) (Kaye, Reference Kaye1987). The appearance of IL-12 producing DCs in the PALS parallels an increase in high-affinity IL-2 receptors on CD41T cells, suggesting a classical model of DC-mediated T-cell activation (Gorak et al. Reference Gorak, Engwerda and Kaye1998). In the spleen of L. donovani infected BALB/c mice, IL-10, IL-12, IFN-γ, and TGF-β are detected, although IL 4 remains absent (Melby et al. Reference Melby, Tabares, Restrepo, Cardona, McGuff and Teale2001). IFN-γ stimulates macrophages to produce iNOS catalysing formation of NO, a final effector molecule necessary for intracellular parasite killing. The animals treated with the combination of drug and vaccine showed the higher concentration of Th1-specific cytokines IFN-γ and IL-2 and lower concentration of Th2-specific cytokines IL-4 and IL-10 compared with SSG alone or 78 kDa alone with or without adjuvant, pointing towards the potential of immunochemotherapy to generate a protective immune response against L. donovani. Our results are in correspondence with the previous studies which showed that biological immunomodulators, such as interferon gamma (IFN-γ), enhance the activity of antimonials in the treatment of VL (Murray et al. Reference Murray, Berman and Wright1988; Sundar et al. Reference Sundar, Singh, Sharma, Makharia and Murray1997). In addition, if given during the early stages of infection, combined treatment with recombinant IL-12 and antimonials inhibits the appearance and progression of cutaneous lesions in BALB/c mice by promoting the development of a protective Th1 immune response (Nabors et al. Reference Nabors, Afonso, Farrell and Scott1995). This suggests that the combination therapy enhances the establishment of CD4+ Th1 type of immune response.
Taken together, these findings indicate that the efficacy of a standard drug along with an immunomodulator for cure as well as for acquiring resistance against L. donovani infection is dependent simultaneously on the direct parasite-killing activity of the drug and on the switching-on of Th1 based protective cell-mediated immunity. Due to the existence of close association between chemotherapy and cell-mediated immunity, immunochemotherapy is thought to be more suitable for treatment of VL. Moreover, our study has shown that the use of specified antigens would result in a better approach to immunochemotherapy as they represent a higher and more specific type of immune response needed to cure the disease. However, more studies are required to test the combination in other animal models before it is tested in patients.
ACKNOWLEDGEMENTS
The authors acknowledge the support provided by the PURSE Grant of Department of Science and Technology, and University Grant Commission, Fellowship programme, India.