Neurogenic obesity is an escalating pandemic with alarming prevalence after spinal cord injury (SCI)(Reference Gater, Farkas and Tiozzo1,Reference McMillan, Bigford and Farkas2) . This is confirmed by previous reports that suggested that the prevalence of neurogenic obesity may exceed 1/3 of the entire SCI population and contributes to cardiometabolic co-morbidities(Reference Gater, Farkas and Tiozzo1,Reference Silveira, Ledoux and Robinson-Whelen3–Reference Veith, Lopez and Linde5) . According to the WHO, the definition of obesity depends on establishing a specific BMI of equal to or greater than 30 kg/m2(Reference Weir and Jan6,Reference Fallah, Noonan and Thorogood7) . However, the WHO cut-off criteria underestimates the percentage fat mass (FM) after SCI(Reference Jones, Legge and Goulding8). An adjusted BMI of 22 kg/m2 has been recommended to offset this problem and has been considered as one of the guidelines to combat cardiometabolic risks after SCI(Reference Jones, Legge and Goulding8–Reference Nash and Gater11). A percentage FM equal to or greater than 20 % has also been suggested as a criterion to define the risk of obesity and has been adopted after SCI(Reference Nash, Groah and Gater10,Reference Nash and Gater11) . The use of the percentage FM definition would result in a higher prevalence of obesity than what has been previously estimated within the SCI population(Reference Gater, Farkas and Tiozzo1,Reference McMillan, Bigford and Farkas2,Reference Nash, Groah and Gater10,Reference Nash and Gater11) . The problem of obesity is multi-factorial as a product of energy imbalance, poor dietary habits, reduced level of physical activity and altered parameters of body composition in this population(Reference McMillan, Bigford and Farkas2,Reference Farkas, Sneij and McMillan12) . Several studies have addressed each component separately(Reference Farkas, Sneij and McMillan12–Reference Farkas, Cunningham and Sneij16); however, it is still unclear the relevant contribution of each component to the entire problem.
Energy balance is the process of maintaining internal body homeostasis and non-exercise physical activity relative to daily total energy intake (TEI)(Reference Gater, Farkas and Tiozzo1,Reference Farkas, Sneij and McMillan12) . The high prevalence of obesity after SCI is attributed to the imbalance between daily TEI and total energy expenditure (TEE). A higher TEI relative to TEE would result in positive energy balance or surplus (i.e. hyperenergetic diet) and subsequently weight gain(Reference Gater, Farkas and Tiozzo1,Reference Farkas, Sneij and McMillan12) . On the contrary, higher TEE compared with daily TEI would result in negative energy balance or negative energy surplus (i.e. hypoenergetic diet) and eventually weight loss(Reference Gorgey, Caudill and Sistrun13,Reference Areni, Capeci and Cassinis17) . Longitudinally, the latter is recognised as a process of caloric restriction or a medical condition that may lead to malnourishment, other associated co-morbidities and eventually mortality(Reference Fallah, Noonan and Thorogood7,Reference Gorgey, Caudill and Sistrun13,Reference Areni, Capeci and Cassinis17,Reference Most and Redman18) . The challenge of balancing TEI and TEE is considered problematic as no accurate methods currently exist to measure both energy components after SCI(Reference Alazzam, Alrubaye and Goldsmith19,Reference Alazzam and Gorgey20) . Furthermore, conflicting findings have been previously reported regarding whether persons with SCI consume a hyperenergetic or hypoenergetic diet(Reference Farkas, Sneij and McMillan12,Reference Gorgey, Caudill and Sistrun13,Reference Farkas, Cunningham and Sneij16,Reference Areni, Capeci and Cassinis17) . Most of the studies suggest that a hyperenergetic diet is the primary reason for the high prevalence of obesity after SCI(Reference Gater, Farkas and Tiozzo1,Reference McMillan, Bigford and Farkas2,Reference Farkas, Sneij and McMillan12) . Therefore, attaining a balance between TEI and TEE may serve as a key rehabilitation approach to combat obesity or malnutrition in persons with SCI. This can be pursued by identifying predictors that are likely to minimise energy surplus to its nadir in persons with SCI.
Self-reported dietary logs were previously used to estimate TEI and macronutrients in persons with SCI(Reference Gorgey, Caudill and Sistrun13–Reference Goldsmith, Holman and Puri15). Participants were encouraged to record their daily dietary intake over a period of a week or two to estimate their daily TEI(Reference Gorgey, Caudill and Sistrun13–Reference Goldsmith, Holman and Puri15). On the other hand, BMR was used to accurately calculate total TEE after multiplying by an SCI-specific factor (1·15) that represents the level of physical activity in this population(Reference Farkas, Gorgey and Dolbow21). BMR is defined as the minimum energy required to maintain whole body energy homeostasis and function of different systems during rest or at basal conditions(Reference Alazzam, Alrubaye and Goldsmith19,Reference Alazzam and Gorgey20) . Recently, Farkas et al. successfully determined the agreement between TEI and TEE. The findings indicated that the SCI-specific equation accurately predicted TEI in persons with SCI compared with the utilisation of the Long method or the Institute of Medicine equations(Reference Farkas, Berg, Sneij and Dolbow22). However, the Bland–Altman analysis clearly suggested that there is a wide distribution (1135 to -1443 kcal/d) between TEI and TEE even with the utilisation of the SCI-specific equation(Reference Farkas, Berg, Sneij and Dolbow22). This may highlight the fluctuation of energy balance in a range that is determined by either positive or negative energy surplus. Another important observation is that 24 % of the SCI population have measured BMR values greater than 1600 kcal/d, while 42 and 33 % have BMR values lower than 1370 kcal/d and 1600 kcal/d, respectively(Reference Dora, Khalil and Adler23). This may suggest that energy requirements vary greatly based on the measured BMR and are likely to be an important determinant for narrowing the gap between positive and negative energy surpluses. Therefore, the cross-sectional study was designed to examine the characteristics of SCI persons with positive and negative energy surpluses as determined by calculating the difference between TEI and TEE. A second objective was to determine whether differences in energy surplus may influence metabolic profile in persons with SCI. Finally, the study identified the predictors that may minimise energy surplus following SCI.
Materials and methods
Participants
Forty-two male participants with chronic SCI participated in the present study. Participants were recruited as part of two randomised clinical trials (NCT01652040 and NCT02660073) that were conducted to examine the effects of electrical stimulation exercises on cardiometabolic risk factors after SCI(Reference Gorgey, Khalil and Gill24,Reference Gorgey, Khalil and Carter25) . This study was conducted according to the guidelines laid down in the Declaration of Helsinki, and all procedures involving human subjects/patients were approved by the Richmond Institute for Veterans Research ethics committee with specific ethics no. 01699 and 02152. Written informed consent was obtained from all participants, which was approved by the local ethics committee. Each participant had an opportunity to read and sign a consent form to indicate their understanding of the entire procedure prior to participation.
All participants were at least 1-year post-injury and had a neurological level of injury of C5-L1 with an American Spinal Injury Association Impairment Scale (AIS) classification of A, B or C. Participants included in the study were between the ages of 18 and 65. Placing the maximum age at 65 avoided any potential confounding effects of nutritional deficiencies associated with aging(Reference Gorgey, Khalil and Gill24,Reference Gorgey, Khalil and Carter25) . Participants were excluded if they had pre-existing conditions associated with vitamin D deficiency, metabolic diseases or uncontrolled type II diabetes. They were also excluded if they were treated with insulin, had uncontrolled hypertension, CVD, a stage 3 pressure ulcer or greater or the diagnosis of osteoporosis. All participants underwent a physical examination by a qualified physiatrist followed by dual-energy X-ray absorptiometry (DXA) assessment. Each participant received dietary logs to record their food and drink intake for 2 weeks(Reference Gorgey, Khalil and Gill24,Reference Gorgey, Khalil and Carter25) .
Body weight
Participants’ height and weight were obtained at enrolment using a PW-630U weighing scale. They were weighed in light clothing without shoes while in their wheelchairs before transferring to an adjustable mat to have their empty wheelchairs weighed. The difference between the two measurements represented the participant’s weight in kilogram (kg). The participants were placed supine on a flat mat, with the trunk aligned with the head, legs and knees fully extended to obtain their heights. The length between two smooth boards placed at the head and heels while the participant was supine represented the participant’s height in centimetres (cm). Each participant’s BMI was calculated by dividing the body weight in kg by the square of the height in metres (m), after converting the height from cm to m(Reference Gorgey, Khalil and Gill24–Reference Gater, Farkas and Dolbow28).
Dual-energy X-ray absorptiometry
Total body and regional DXA scans were performed using iLunar DXA (Lunar Inc.) bone densitometer at the Richmond, VA Medical Center(Reference Gater, Farkas and Dolbow28,Reference Gorgey, Cirnigliaro and Bauman29) . Calibration was performed using a phantom calibration box, simulating human tissues, to certify scan reliability and precision(Reference Gater, Farkas and Dolbow28,Reference Gorgey, Cirnigliaro and Bauman29) . All metals were removed from all participants before placing them supine on the scanning table(Reference Gater, Farkas and Dolbow28,Reference Gorgey, Cirnigliaro and Bauman29) . After a 20-min rest on a padded table, scans were performed and analysed by a trained, certified DXA operator using the iLunar system. Total and regional lean masses were determined using total and regional DXA software.
Appendicular lean mass (arms lean mass + legs lean mass, kg) was adjusted to the height-square (height2; m2) of each participant to calculate the sarcopenia index(Reference Cruz-Jentoft, Bahat and Bauer30,Reference Gherle, Nistor-Cseppento and Iovanovici31) . Previously, the sarcopenia index was used as a predictor of energy intake adjusted to BMR in the Korean population(Reference Cho, Cho and Han32).
BMR
Participants were instructed to refrain from exercise, caffeine, nicotine and alcohol at least 12 h prior to the testing period in accordance with minimal criteria for best practice BMR guidelines(Reference Gorgey, Caudill and Sistrun13,Reference Alazzam and Gorgey20) . Participants were escorted to either a clinical research centre or a local hotel to spend the night before measuring BMR in the hotel room prior to getting out of bed. Following a 12-h overnight fast, participants were woken up gently at ∼06.30 to undergo a BMR assessment. All measurements were completed in a dark, quiet thermoneutral environment (temperature between 20°C and 25°C). BMR was measured using a portable metabolic system (COSMED K4b2), and the unit was calibrated in a thermoneutral condition according to manufacturer guidelines.
Following calibration, a canopy was placed over the participant’s head while they were in a supine position. Oxygen consumption was measured with continuous breath-by-breath measurements for over a 20-min period. Participants were monitored to ensure they did not fall asleep during data collection, and no interruptions occurred. Data were discarded for the initial 5-min period, and BMR (kcal/d) was then averaged over the remaining 15 min. Energy expenditure was determined using the Weir equation. If RER (carbon dioxide production/oxygen used) values were < 0·70 or > 1·00, participants were excluded from analysis, as such values are indicative of inaccurate gas measurements or protocol violation(Reference Alazzam and Gorgey20). Total energy expenditure (TEE) was measured as the product of BMR and (1·15; SCI-specific factor)(Reference Farkas, Gorgey and Dolbow21).
Metabolic profile
Fasting glucose and insulin (2 ml), lipid profile (HDL-cholesterol, LDL-cholesterol, total cholesterol and TAG; 2 ml), inflammatory biomarkers (C-reactive protein, TNF-α, IL-6, free-fatty acid; 2 ml) and anabolic growth factors (testosterone, insulin growth factors-1 and insulin growth factors binding protein-3) were assessed immediately following BMR measurement(Reference Abilmona and Gorgey14,Reference Gorgey, Khalil and Gill24,Reference Gorgey, Khalil and Carter25) . A Teflon catheter was inserted into an antecubital vein of one arm or a dorsal hand vein for blood sampling, and the samples were sent for analysis at the Clinical Pathology Laboratory. Fasting samples were captured three times every 30 min. After allowing the blood sample to clot for 30 min, the blood was centrifuged at 3000 RPM for 10 min, and the serum was transferred for analysis.
Dietary intake
All participants met with a registered dietitian before enrolling in the study. The meeting lasts for 30–45 min at the clinical research centre(Reference Gorgey, Caudill and Sistrun13–Reference Goldsmith, Holman and Puri15,Reference Dora, Khalil and Adler23) . Participants were instructed on how to adequately fill dietary logs with clear instructions on how to provide logs on daily intakes of foods, snacks and drinks. Each participant was provided with weekly sheets and was instructed to fill 3 d of dietary logs for 2 subsequent weeks for the purpose of the present study. Data from the first 2 weeks were considered for analysis because participants are less likely to change their dietary habits within the initial 2 weeks of the study. Caloric intake and macronutrients using the Nutritional software (Nutritional Data System for Research, version 2018) were measured(Reference Gorgey, Caudill and Sistrun13–Reference Goldsmith, Holman and Puri15,Reference Dora, Khalil and Adler23) . Dietary logs of thirty participants were also considered for weeks 5–6 and 7–8. The average caloric intakes of these weeks were used to determine the pattern and the mean absolute error compared with caloric intake from weeks 1–2.
Statistical analysis
Participants were stratified according to the difference between TEI and TEE into either the negative energy surplus group or the positive energy surplus group. All statistical analyses were performed using the IBM Statistical Package for the Social Sciences version 29.0 (IBM Corp.). Statistical analysis included descriptive statistics (mean (sd) for all the study variables. All variables were checked for normality using the Shapiro–Wilk tests. If Shapiro–Wilk tests were significant, the study variable was checked for outliers, and then the entire analysis was rerun after removal of the outliers. If there are no outliers, the Q–Q plots and the histograms were visually inspected to ensure normal distribution. The primary independent outcome variables of the study were TEI and TEE.
Independent t tests were used to compare the differences in the outcome variables (caloric intake, energy surplus, BMR, body composition assessment and metabolic profile) between groups of negative (n 24) and positive (n 18) energy surpluses. A 95 % limits of agreement analysis was performed (mean difference (sd 1·96)) comparing TEI and TEE, with data displayed using Bland–Altman plots. Comparison statistics included mean absolute error, which is presented as a percentage (Percentage error = (estimated TEIweek 5–6 – TEIweek 1–2)/TEIweek 1–2 × 100). Linear regression analyses and Pearson’s correlations were examined to determine the variance and association between percentage macronutrients and energy surpluses.
Results
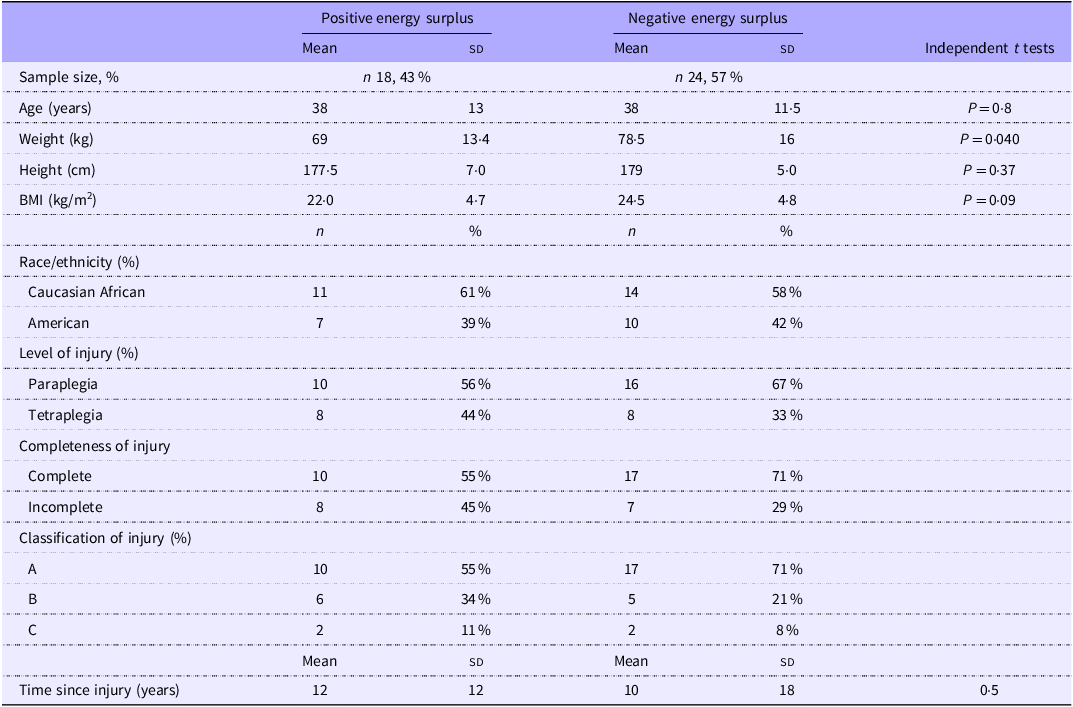
The physical and SCI characteristics of the forty-two participants are presented in Table 1. Twenty-four (57 %) were classified as negative energy surplus participants with an average caloric deficit relative to TEE of 526 (sd 423) kcal. The remaining eighteen participants were classified as positive energy surplus with excess caloric intake of 552 (sd 552) kcal. The difference in energy balance between both groups was statistically different (P < 0·001). Body weight was positively related to energy surplus (n 42; r = 0·39; P = 0·01), as well as % total body FM (n 42; r = 0·37; P = 0·015), but not lean mass. Finally, the energy surplus was positively related to BMR (n 42; r = 0·40; P = 0·01), absolute total body FM (n 42; r = 0·41; P = 0·007) and percentage FM (n 42; r = 0·37; P = 0·015), as well as absolute leg FM (n 42; r = 0·34; P = 0·027) and percentage leg FM (n 42; r = 0·34; P = 0·029), but not lean mass.
Participant physical and spinal cord injury characteristics, mean (sd) and percentages (n 42)
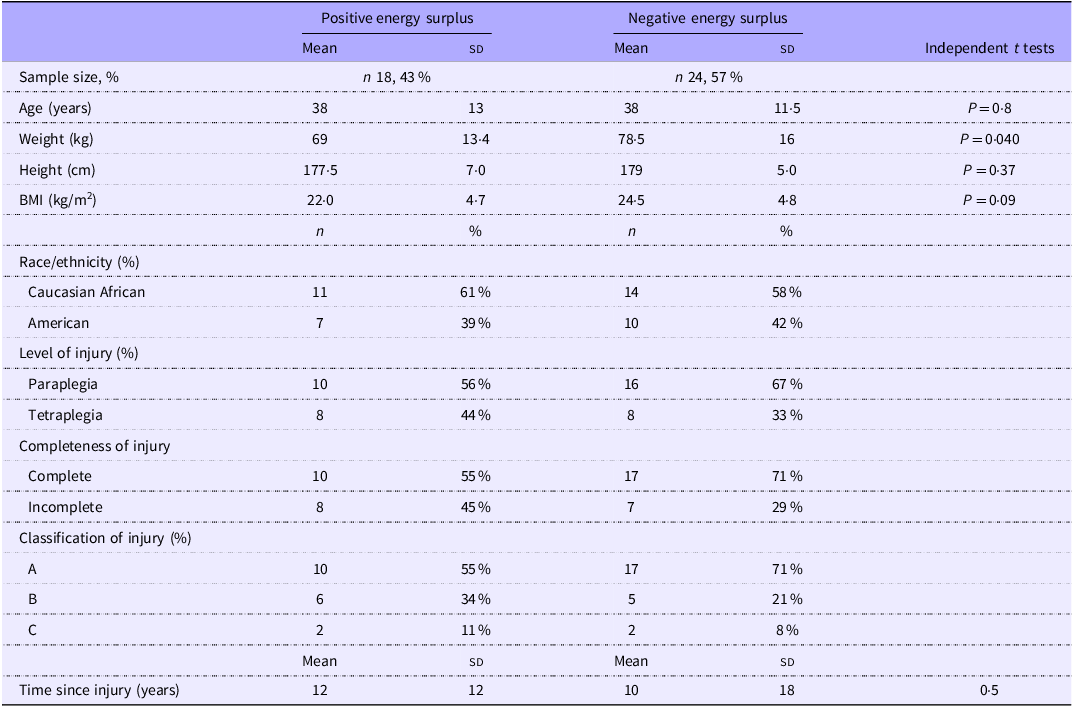
Table 1 Long description
The table presents the physical and spinal cord injury characteristics of participants, divided into two groups: positive energy surplus and negative energy surplus. The table includes data on sample size, age, weight, height, body mass index, race/ethnicity, level of injury, completeness of injury, classification of injury, and time since injury. The positive energy surplus group has a mean age of 38 years, a mean weight of 69 kilograms, a mean height of 177.5 centimeters, and a mean body mass index of 22.0 kilograms per square meter. The negative energy surplus group has a mean age of 38 years, a mean weight of 78.5 kilograms, a mean height of 179 centimeters, and a mean body mass index of 24.5 kilograms per square meter. The table also includes percentages for race/ethnicity, level of injury, completeness of injury, and classification of injury. The time since injury is also provided for both groups.
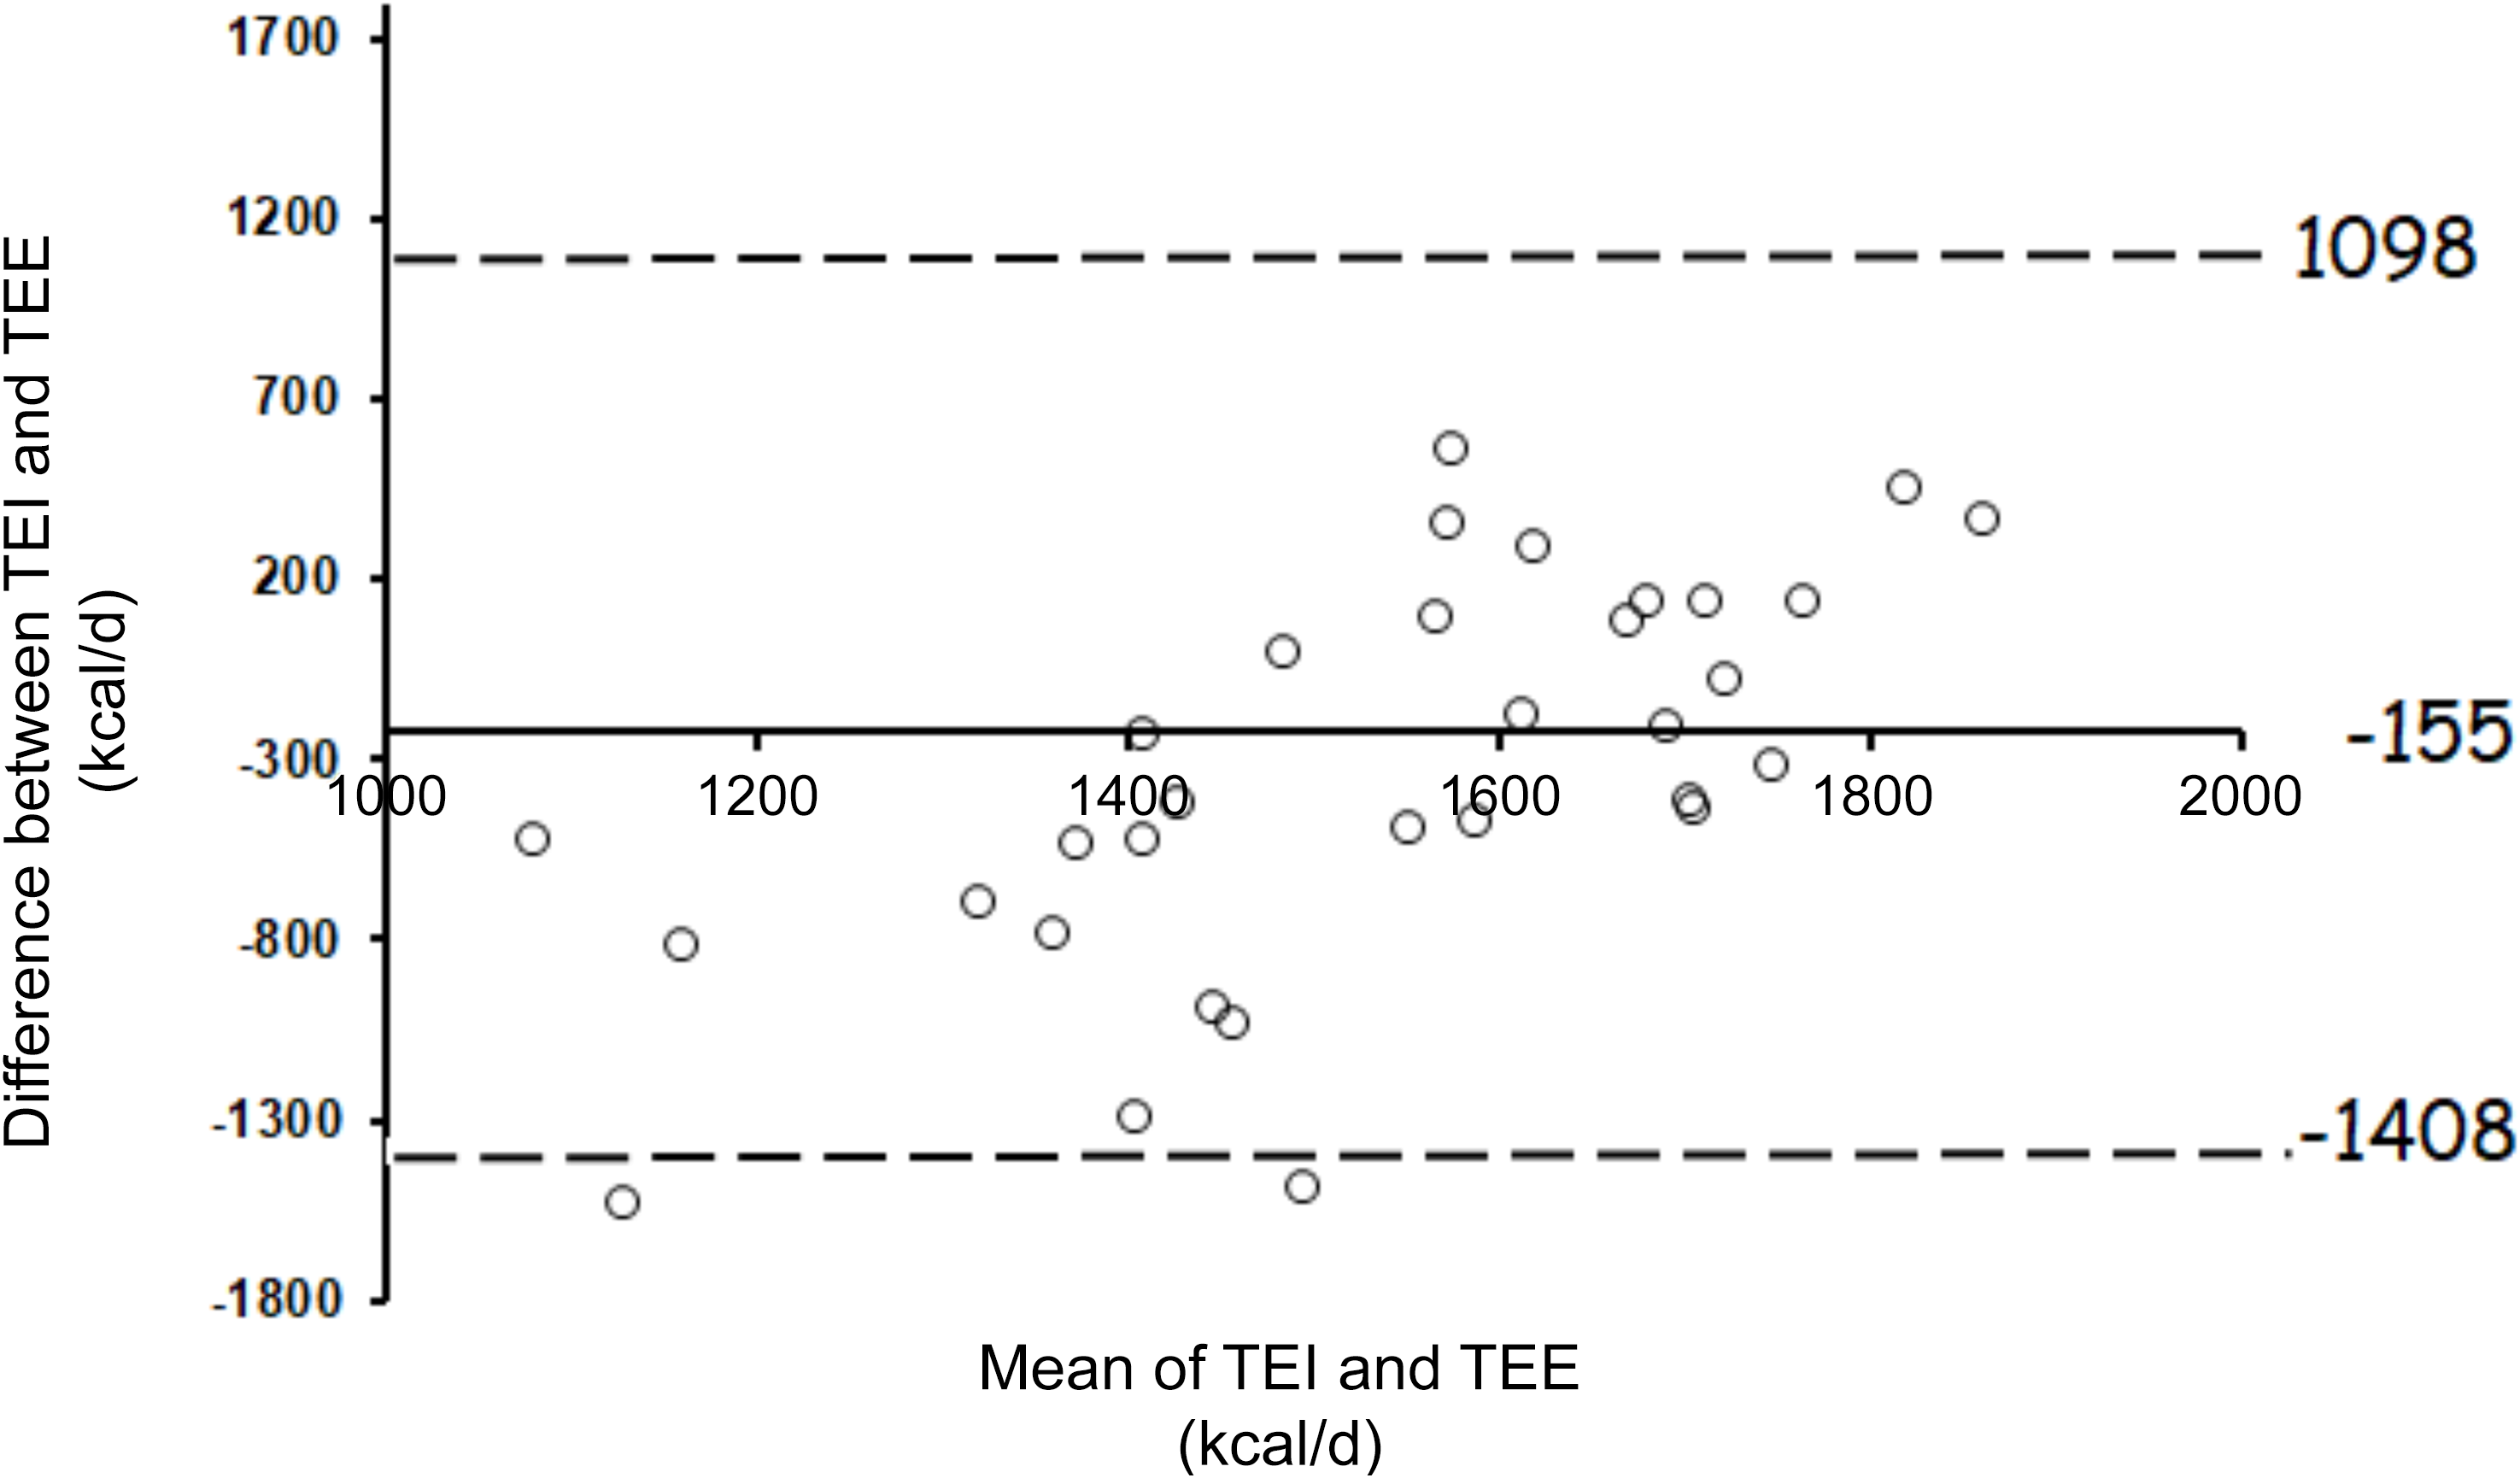
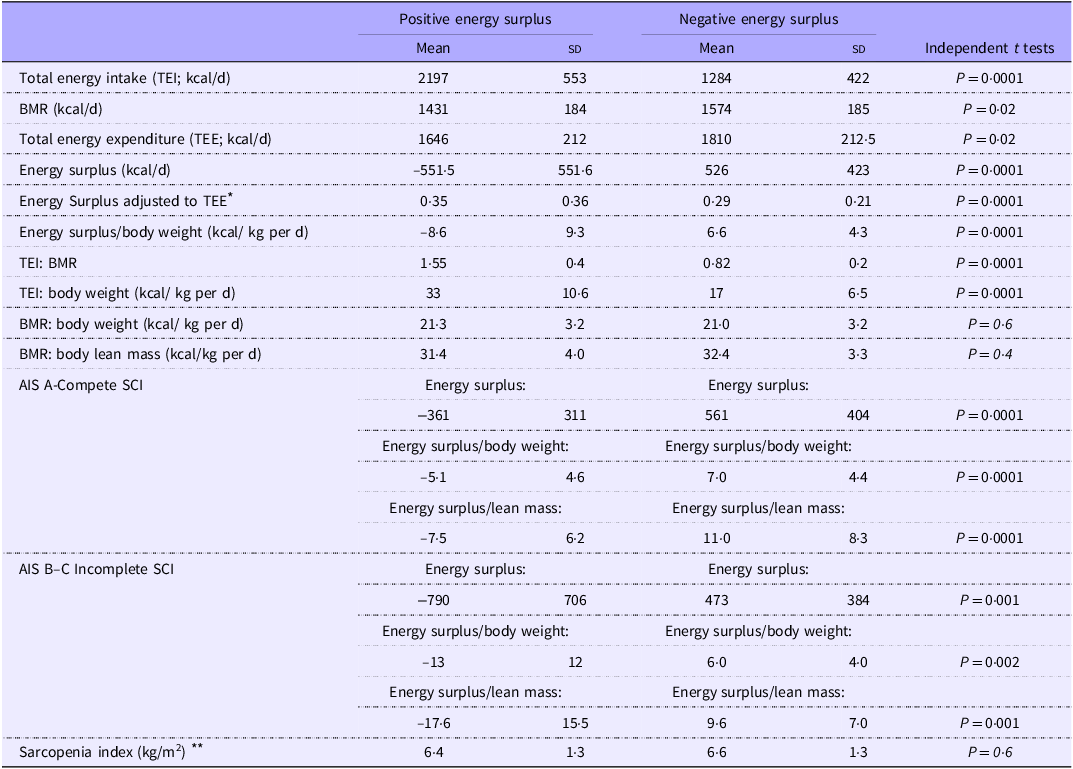
Figure 1 highlights the Bland–Altman analysis between TEI and TEE in forty-two persons with SCI. The mean bias between TEI and TEE was −155 (sd 640) kcal/d. BMR was 9 % higher (P = 0·02) in the negative energy group (1574 (sd 185) kcal/d) compared with the positive energy group (1431 (sd 184) kcal/d) (Table 2). Body weight was also greater (P = 0·03) in the negative energy group (78·5 (sd 15) kg) compared with the positive energy group (69·0 (sd 13) kg). Energy surplus relative to body weight indicated that the negative energy group consumed 6·6 (sd 4·3) kcal/ kg compared with 8·7 (sd 9·3) kcal/kg in the positive energy group (P < 0·0001). However, the estimated energy requirements (TEE/body weight) were not different (P = 0·6) between the positive (24·5 (sd 3·7) kcal/kg) and negative (24·0 (sd 3·6) kcal/kg) energy groups (Table 2).
Bland–Altman plots measuring the level of agreement against estimated total energy intake (TEI) and the SCI-specific total energy expenditure (TEE). Solid block circles represent individual study participants (n 42). The solid line represents the mean difference between the two measurements, while the dashed lines represent the 95 % CI (mean (1·96 sd above and below the mean difference)).
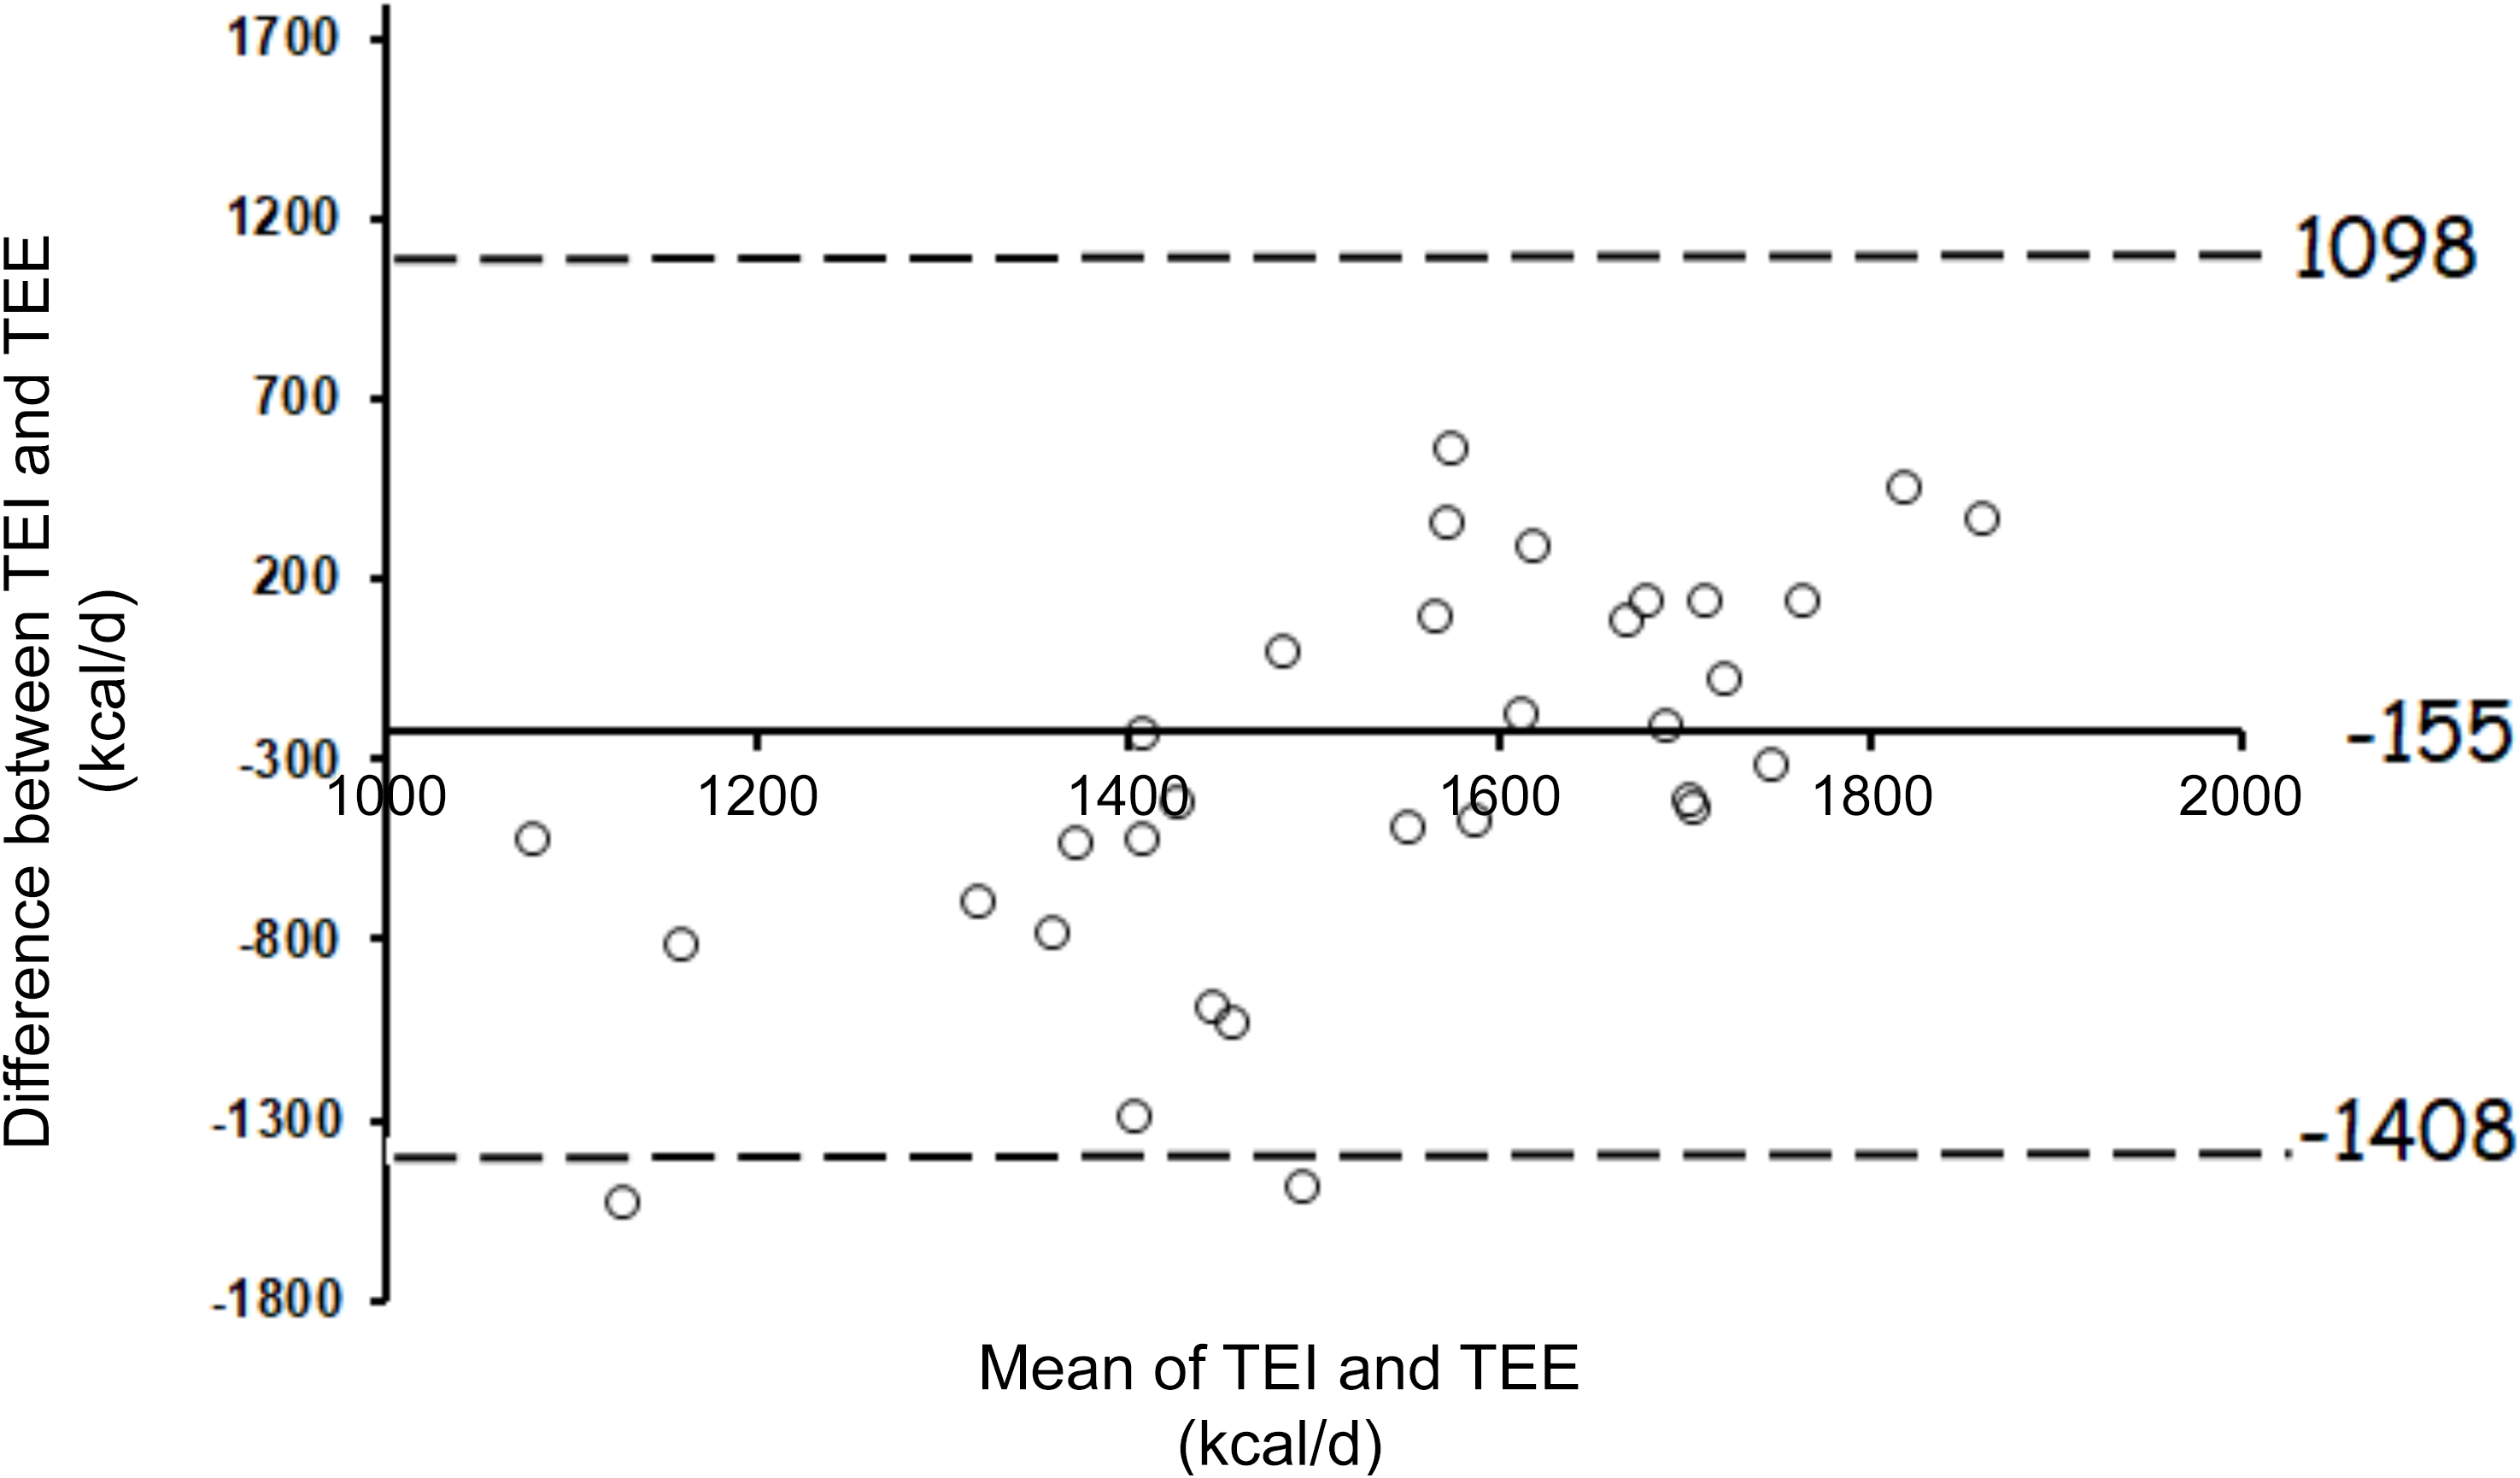
Figure 1 Long description
A scatter plot illustrates the difference between total energy intake (TEI) and total energy expenditure (TEE) in individuals with spinal cord injury. The x-axis represents the mean of TEI and TEE in kilocalories per day, ranging from 1000 to 2000 kilocalories per day. The y-axis shows the difference between TEI and TEE in kilocalories per day, ranging from -1800 to 1700 kilocalories per day. The plot includes 42 data points, each represented by a circle. The solid line at -155 kilocalories per day indicates the mean difference between TEI and TEE. The dashed lines at 1098 and -1408 kilocalories per day represent the 95% confidence interval around the mean difference. The data points are scattered with no clear trend, indicating variability in the differences between TEI and TEE among the participants. All values are approximated.
Energy intake and expenditure assessment in the positive energy and negative energy groups
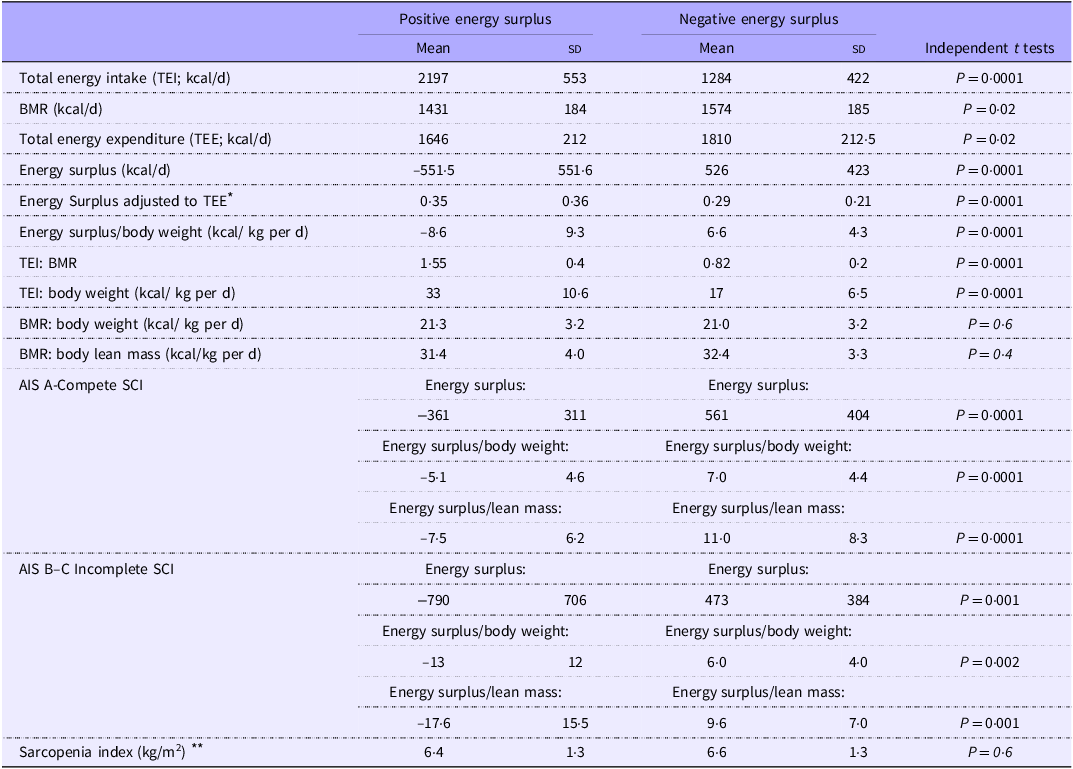
Table 2 Long description
The table presents a comparison of energy intake and expenditure between positive energy surplus and negative energy surplus groups. It includes data on total energy intake, basal metabolic rate, total energy expenditure, energy surplus, and various ratios. The table has 18 rows and 8 columns, with headers for mean, standard deviation, and independent t-tests for both positive and negative energy surplus groups. Key metrics include total energy intake, basal metabolic rate, total energy expenditure, energy surplus, and energy surplus adjusted to total energy expenditure. Notable trends include higher total energy intake and lower basal metabolic rate in the positive energy surplus group compared to the negative energy surplus group.
AIS, American Spinal Injury Association Impairment Scale; SCI, spinal cord injury. Energy surplus (kcal/d) = TEE-TEI.
* Energy surplus adjusted to TEE indicated that the positive energy group consumed 35 % above their daily caloric needs, compared with the negative energy group who consumed on average 29 % below their daily caloric needs.
** Sarcopenia index was calculated as the appendicular lean mass measured by dual-energy X-ray absorptiometry (arm lean mass + leg lean mass)/ height2.
The results of absolute or adjusted energy surplus were independent of the AIS classifications and maintained regardless of whether the classification was either complete SCI AIS A or incomplete SCI AIS B and C (Table 2). Furthermore, the sarcopenia index, based on appendicular lean mass, was not different (P = 0·6) between both groups (Table 2).
Caloric intake and macronutrients
Total energy intake was 71 % lower (1284 (sd 422) kcal v. 2197 (sd 553) kcal; P < 0·0001) in the negative energy group (n 24) compared with the positive energy group (n 18) (Table 2). The negative energy group had a greater percentage of macronutrients of protein intake (19·8 (sd 3·9) v. 16·7 (sd 3·5) %; P = 0·01) compared with the positive energy group. However, the percentage of macronutrients of fats was not different between groups, with a tendency of greater carbohydrate intake in the positive energy group compared with the negative energy group (46·4 (sd 6·0) v. 41·7 (sd 9·6) %; P = 0·06).
Body composition assessment
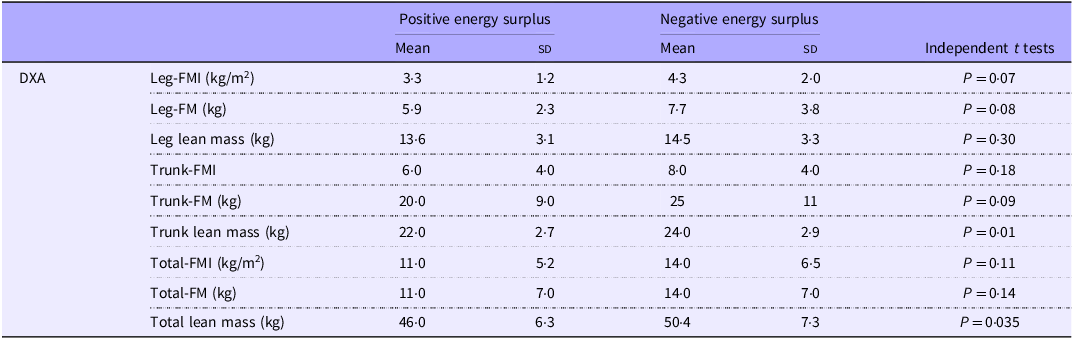
The negative energy group has a greater total body lean mass (50·4 (sd 7·3) v. 46 (sd 6·3) kg; P = 0·032) and a tendency of greater total body FM (25·0 (sd 10·7) v. 19·7 (sd 9·0) kg; P = 0·09) compared with the positive energy group (Table 3). There was a tendency of greater leg FM in the negative energy group compared with the positive energy group (7·7 (sd 3·8) v. 5·9 (sd 2·5) kg; P = 0·06). Total and regional fat mass index (FM/height2) were not different between groups (Table 3).
Anthropometrics, body composition assessment and whole thigh cross-sectional area in the positive and negative energy groups
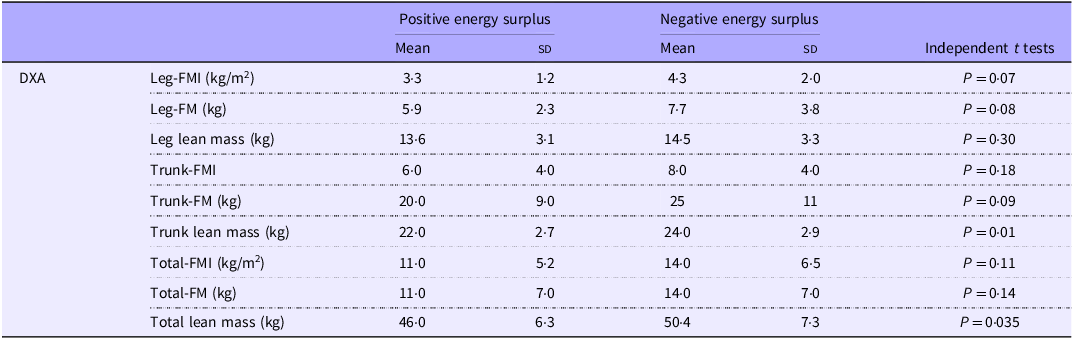
Table 3 Long description
The table presents data on anthropometrics and body composition assessment, focusing on leg and trunk fat mass index, fat mass, and lean mass for positive and negative energy surplus groups. It includes mean values and standard deviations for each metric, along with independent t-test results. The negative energy group shows higher total body lean mass and a tendency for greater total body fat mass compared to the positive energy group. The table has 10 rows and 6 columns, with headers for DXA, Positive energy surplus Mean, Positive energy surplus SD, Negative energy surplus Mean, Negative energy surplus SD, and Independent t tests.
DXA, dual-energy X-ray absorptiometry; FM, fat mass; FMI, fat mass index (fat mass/height2).
Furthermore, trunk lean mass (24·2 (sd 2·9) v. 22·0 (sd 2·8) kg; P = 0·01), android lean mass (36·2 (sd 0·54) v. 31·4 (sd 0·5) kg; P = 0·005) and gynoid lean mass (6·5 (sd 1·0) v. 5·75 (sd 0·8) kg; P = 0·01) followed the same pattern in the negative energy group compared with the positive energy group (Table 3). Finally, gynoid FM was greater (3·9 (sd 1·9) v. 2·9 (sd 1·3) kg; P = 0·04) in the negative energy group compared with the positive energy group.
Metabolic profile
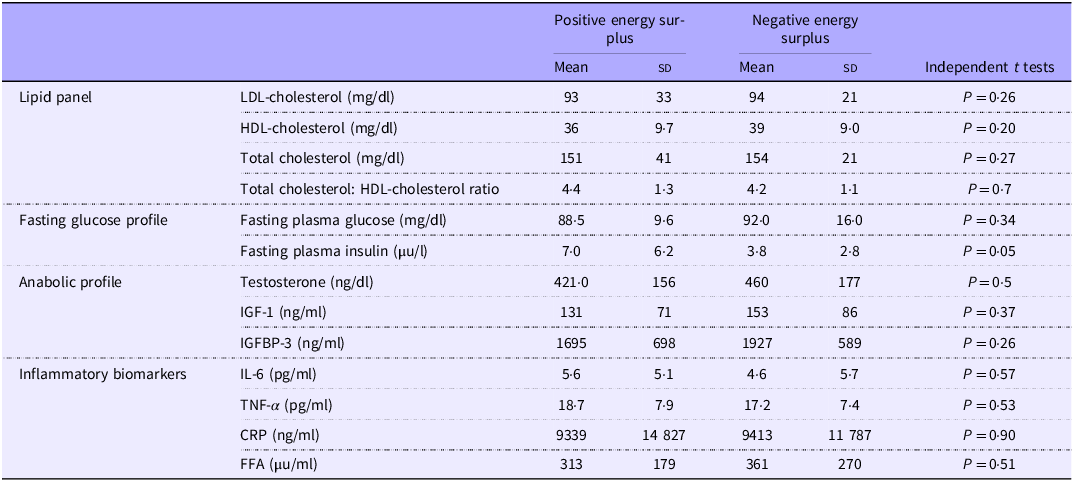
Circulating fasting plasma insulin was 2× lower (P = 0·050) in the negative energy group compared with the positive energy group. Fasting insulin was not related to percentage protein, lean mass or muscle cross-sectional area. The circulating fasting plasma glucose, lipid panel, anabolic profile and inflammatory biomarkers were not different between groups (Table 4).
Metabolic profile assessment in the positive and negative energy groups
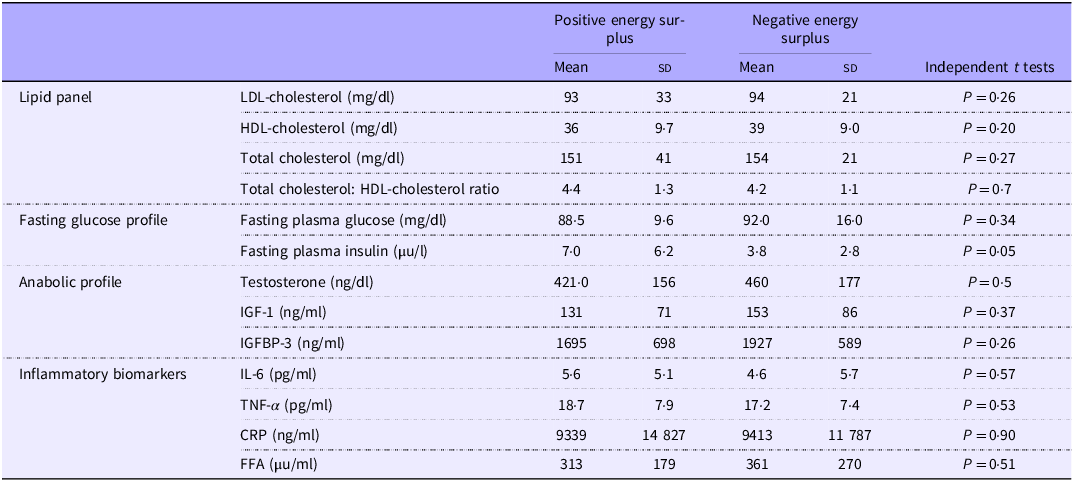
Table 4 Long description
The table compares metabolic profiles between positive and negative energy surplus groups, focusing on lipid panel, fasting glucose profile, anabolic profile, and inflammatory biomarkers. It includes mean values and standard deviations for LDL-cholesterol, HDL-cholesterol, total cholesterol, total cholesterol to HDL-cholesterol ratio, fasting plasma glucose, fasting plasma insulin, testosterone, IGF-1, IGFBP-3, IL-6, TNF-alpha, CRP, and FFA. The table also provides P-values from independent t-tests to indicate statistical significance. Notably, fasting plasma insulin is significantly lower in the negative energy surplus group (P = 0.05). Other metrics such as fasting plasma glucose, lipid panel, anabolic profile, and inflammatory biomarkers show no significant differences between the groups.
IGF-1, insulin growth factors-1; IGFBP-3, insulin growth factors binding protein-3; CRP, C-reactive protein; FFA, free-fatty acids.
Predictors of energy surplus
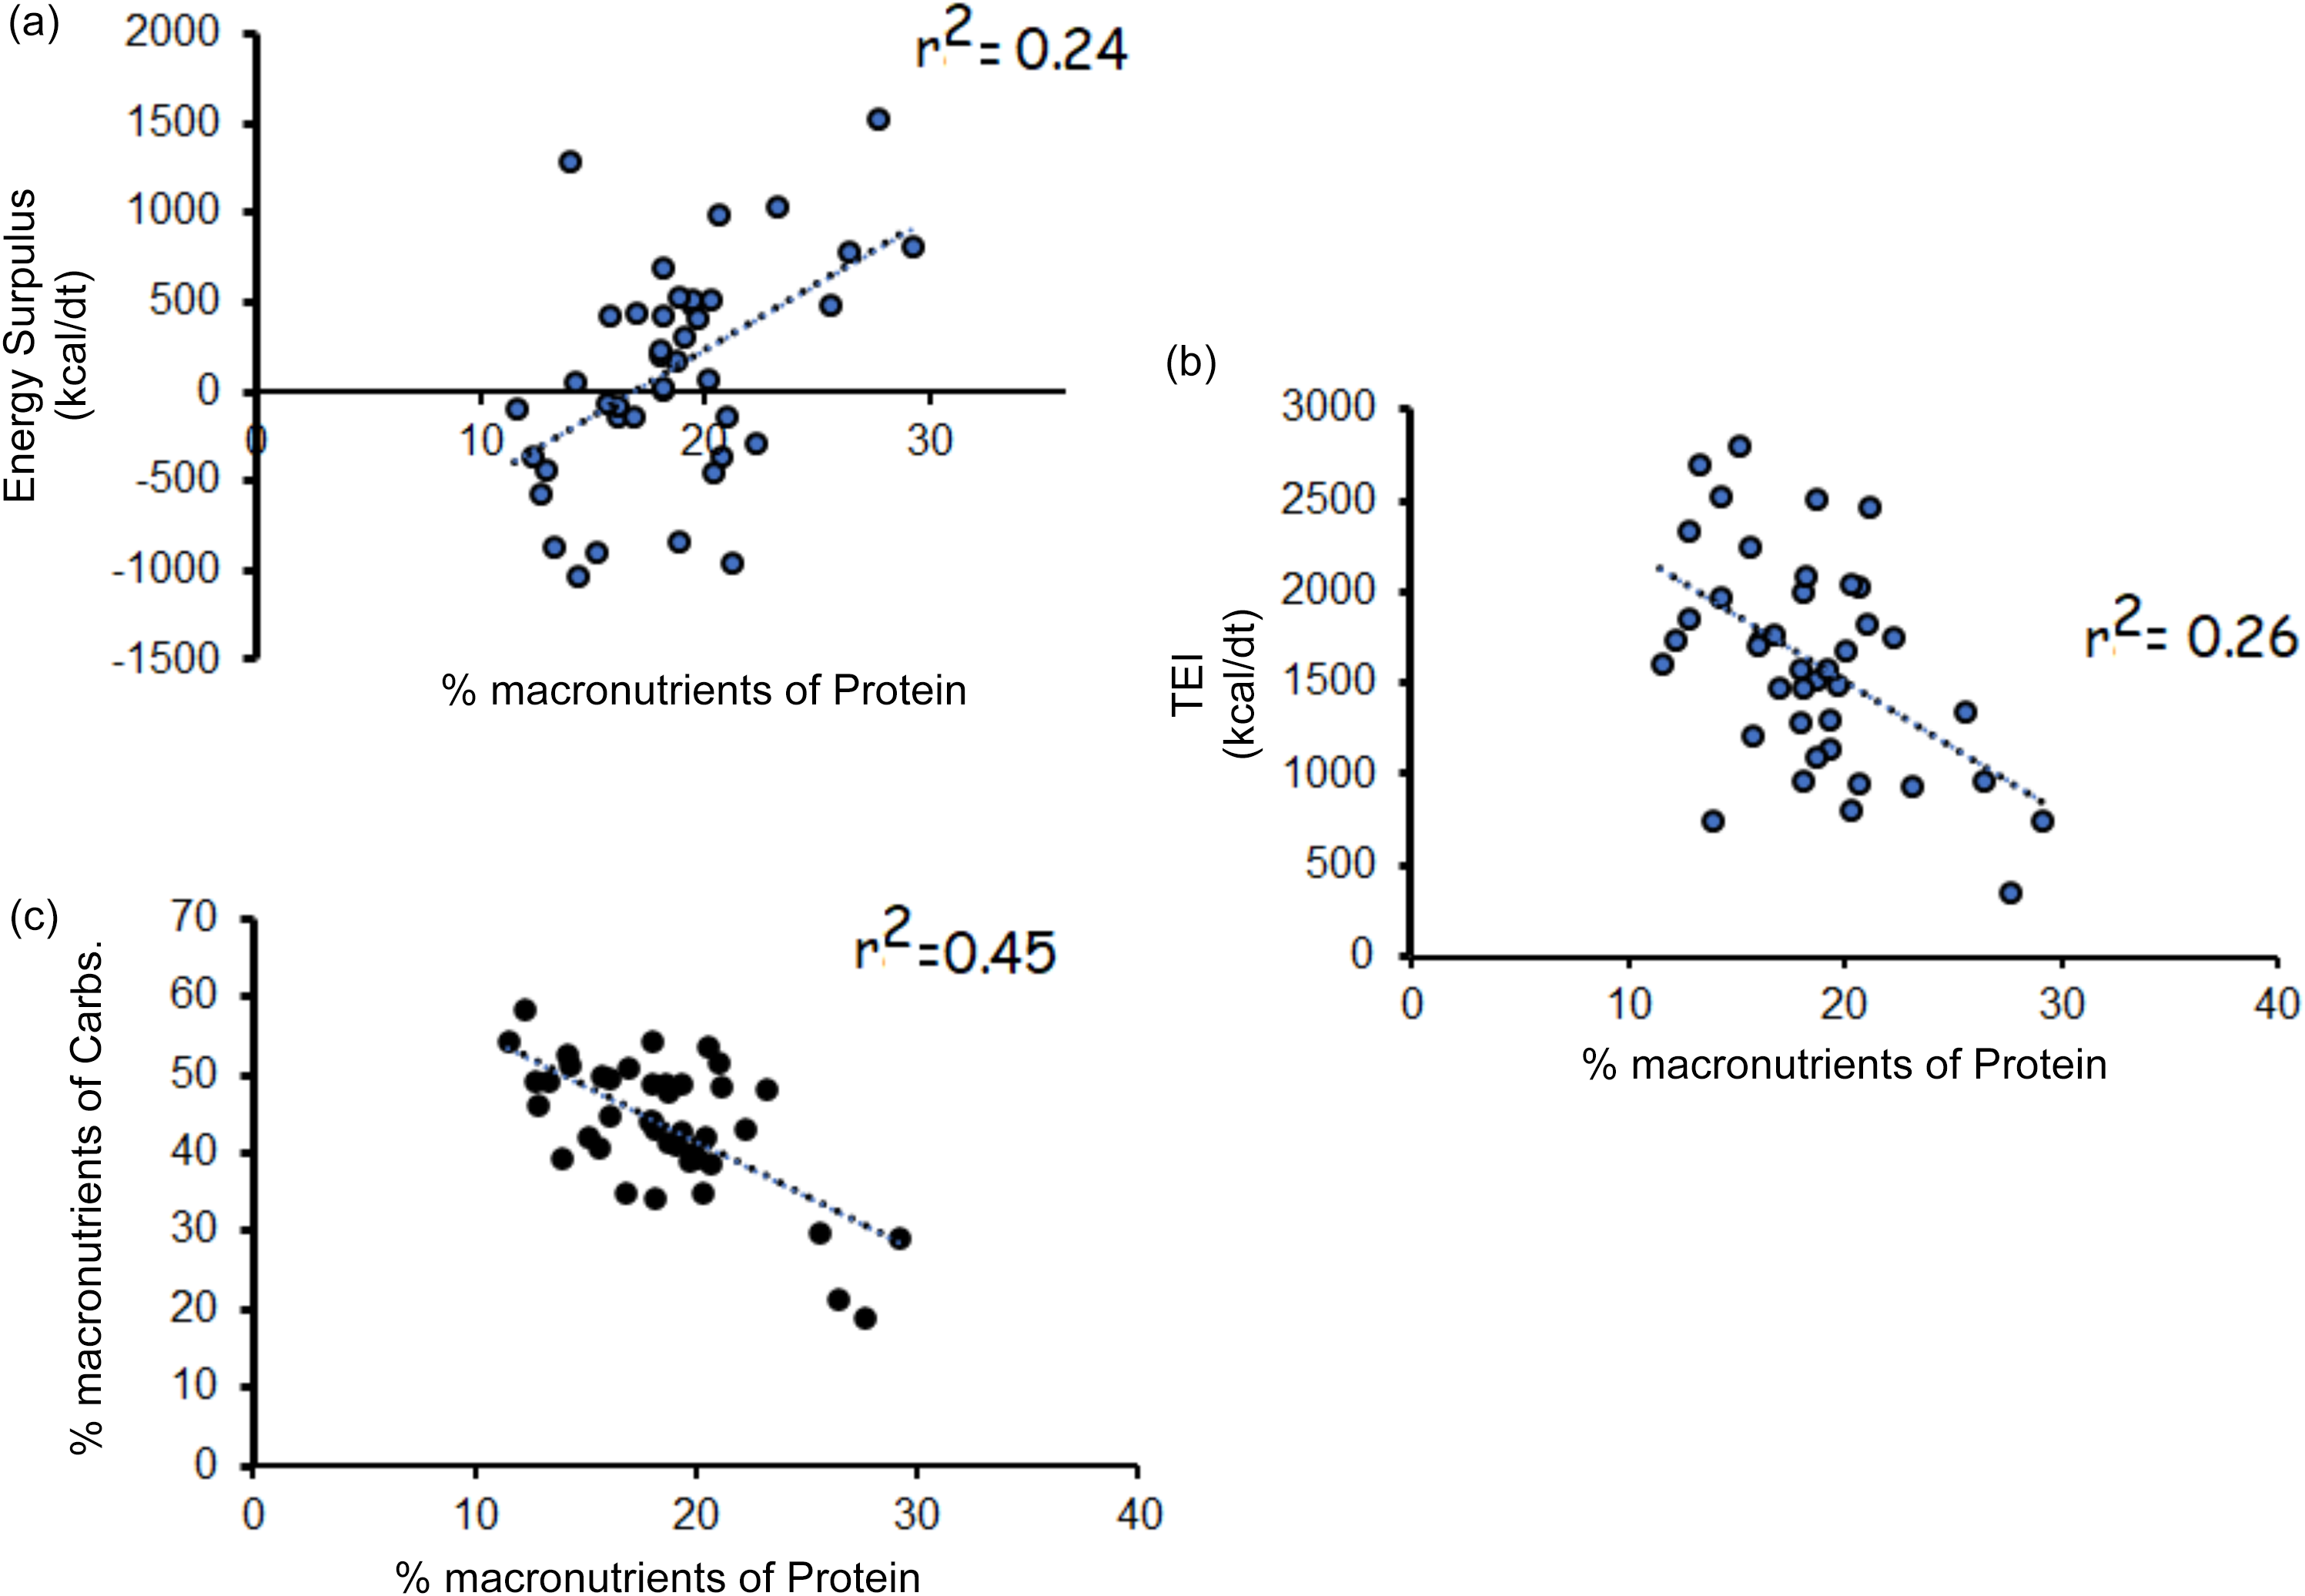
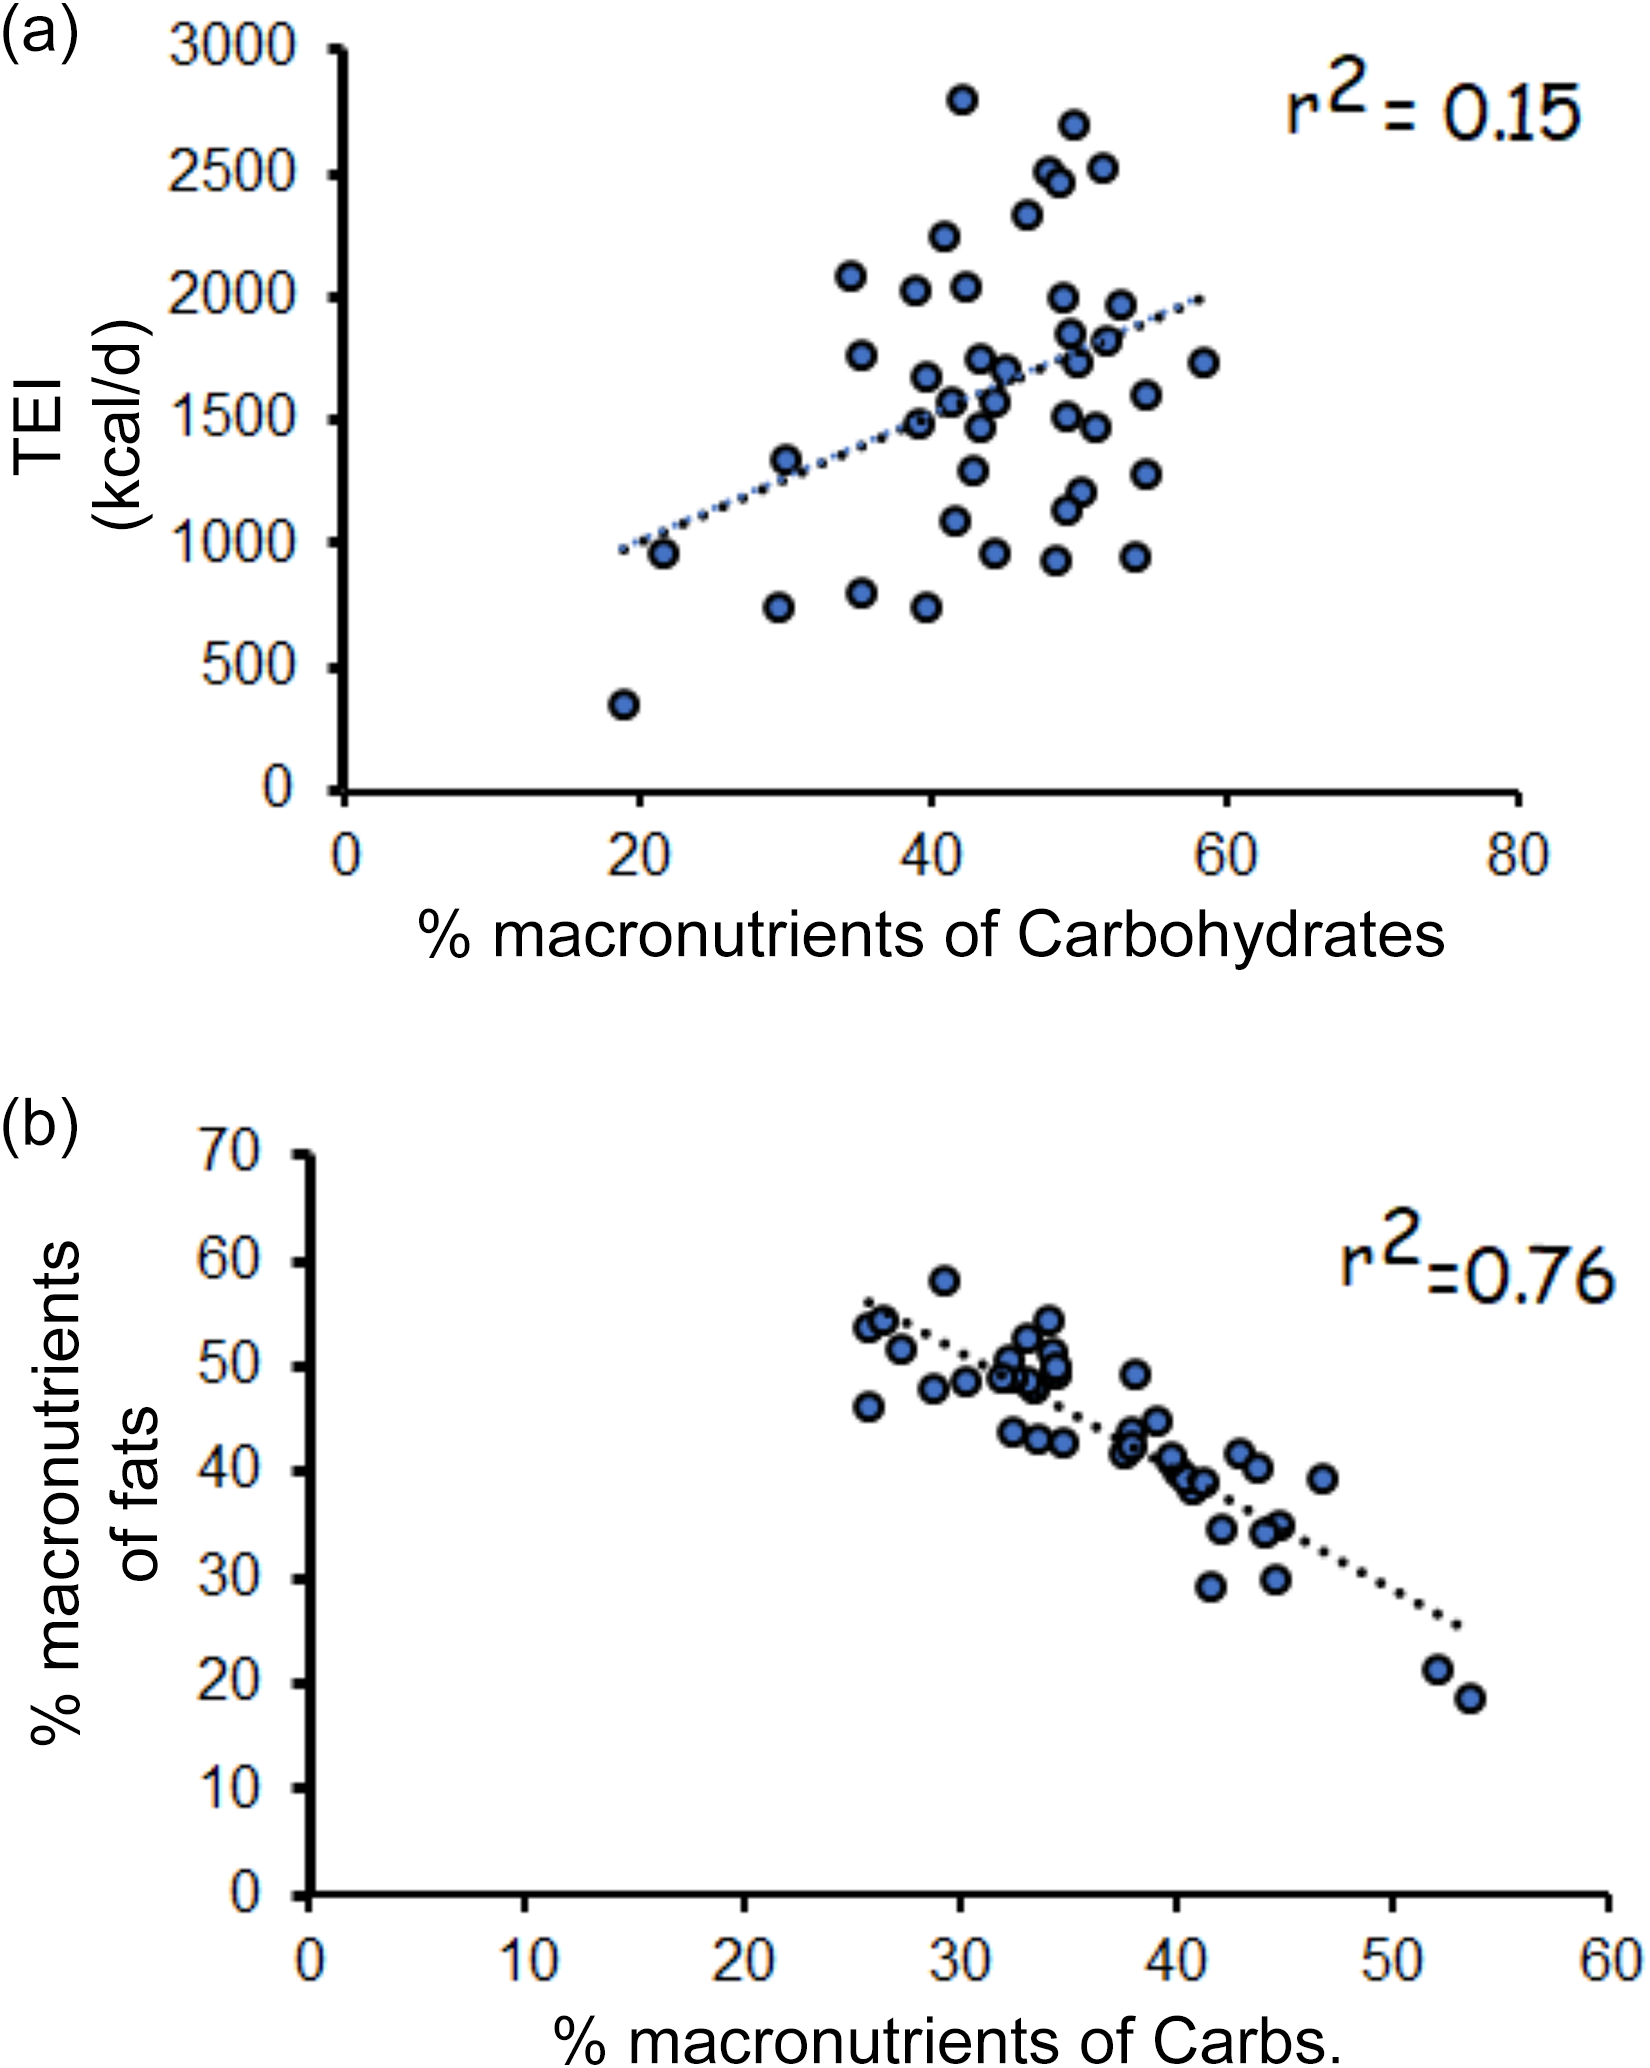
Linear regression analyses indicated that percentage macronutrients (n 41) of protein (r 2 0·24; P = 0·001; Figure 2(a)), of fats (r 2 0·10; P 0·04) and of carbohydrates (r 2 = 0·18; P = 0·007) independently explain variance in energy surpluses. However, only percentage macronutrients of protein explained 27 % of the variance in energy surplus in a multivariate regression model (r 2 0·27; P = 0·008), but not fats or carbohydrates. Strong negative correlations were noted between percentage macronutrients of protein and TEI (n 41; r = –0·51, P = 0·0001; Figure 2(b)) and percentage macronutrients of carbohydrates (r = –0·67, P = 0·0001; Figure 2(c)). On the contrary, the percentage macronutrients of carbohydrates were positively related to TEI (n 41; r = 0·38, P = 0·014; Figure 3(a)) and negatively related to percentage macronutrients of fats (Figure 3(b)).
Linear regression analyses (a) percentage macronutrients of protein and energy surplus; (b) percentage macronutrients of protein and total energy intake (TEI; kcal/d) and (c) percentage macronutrients of protein and carbohydrates.
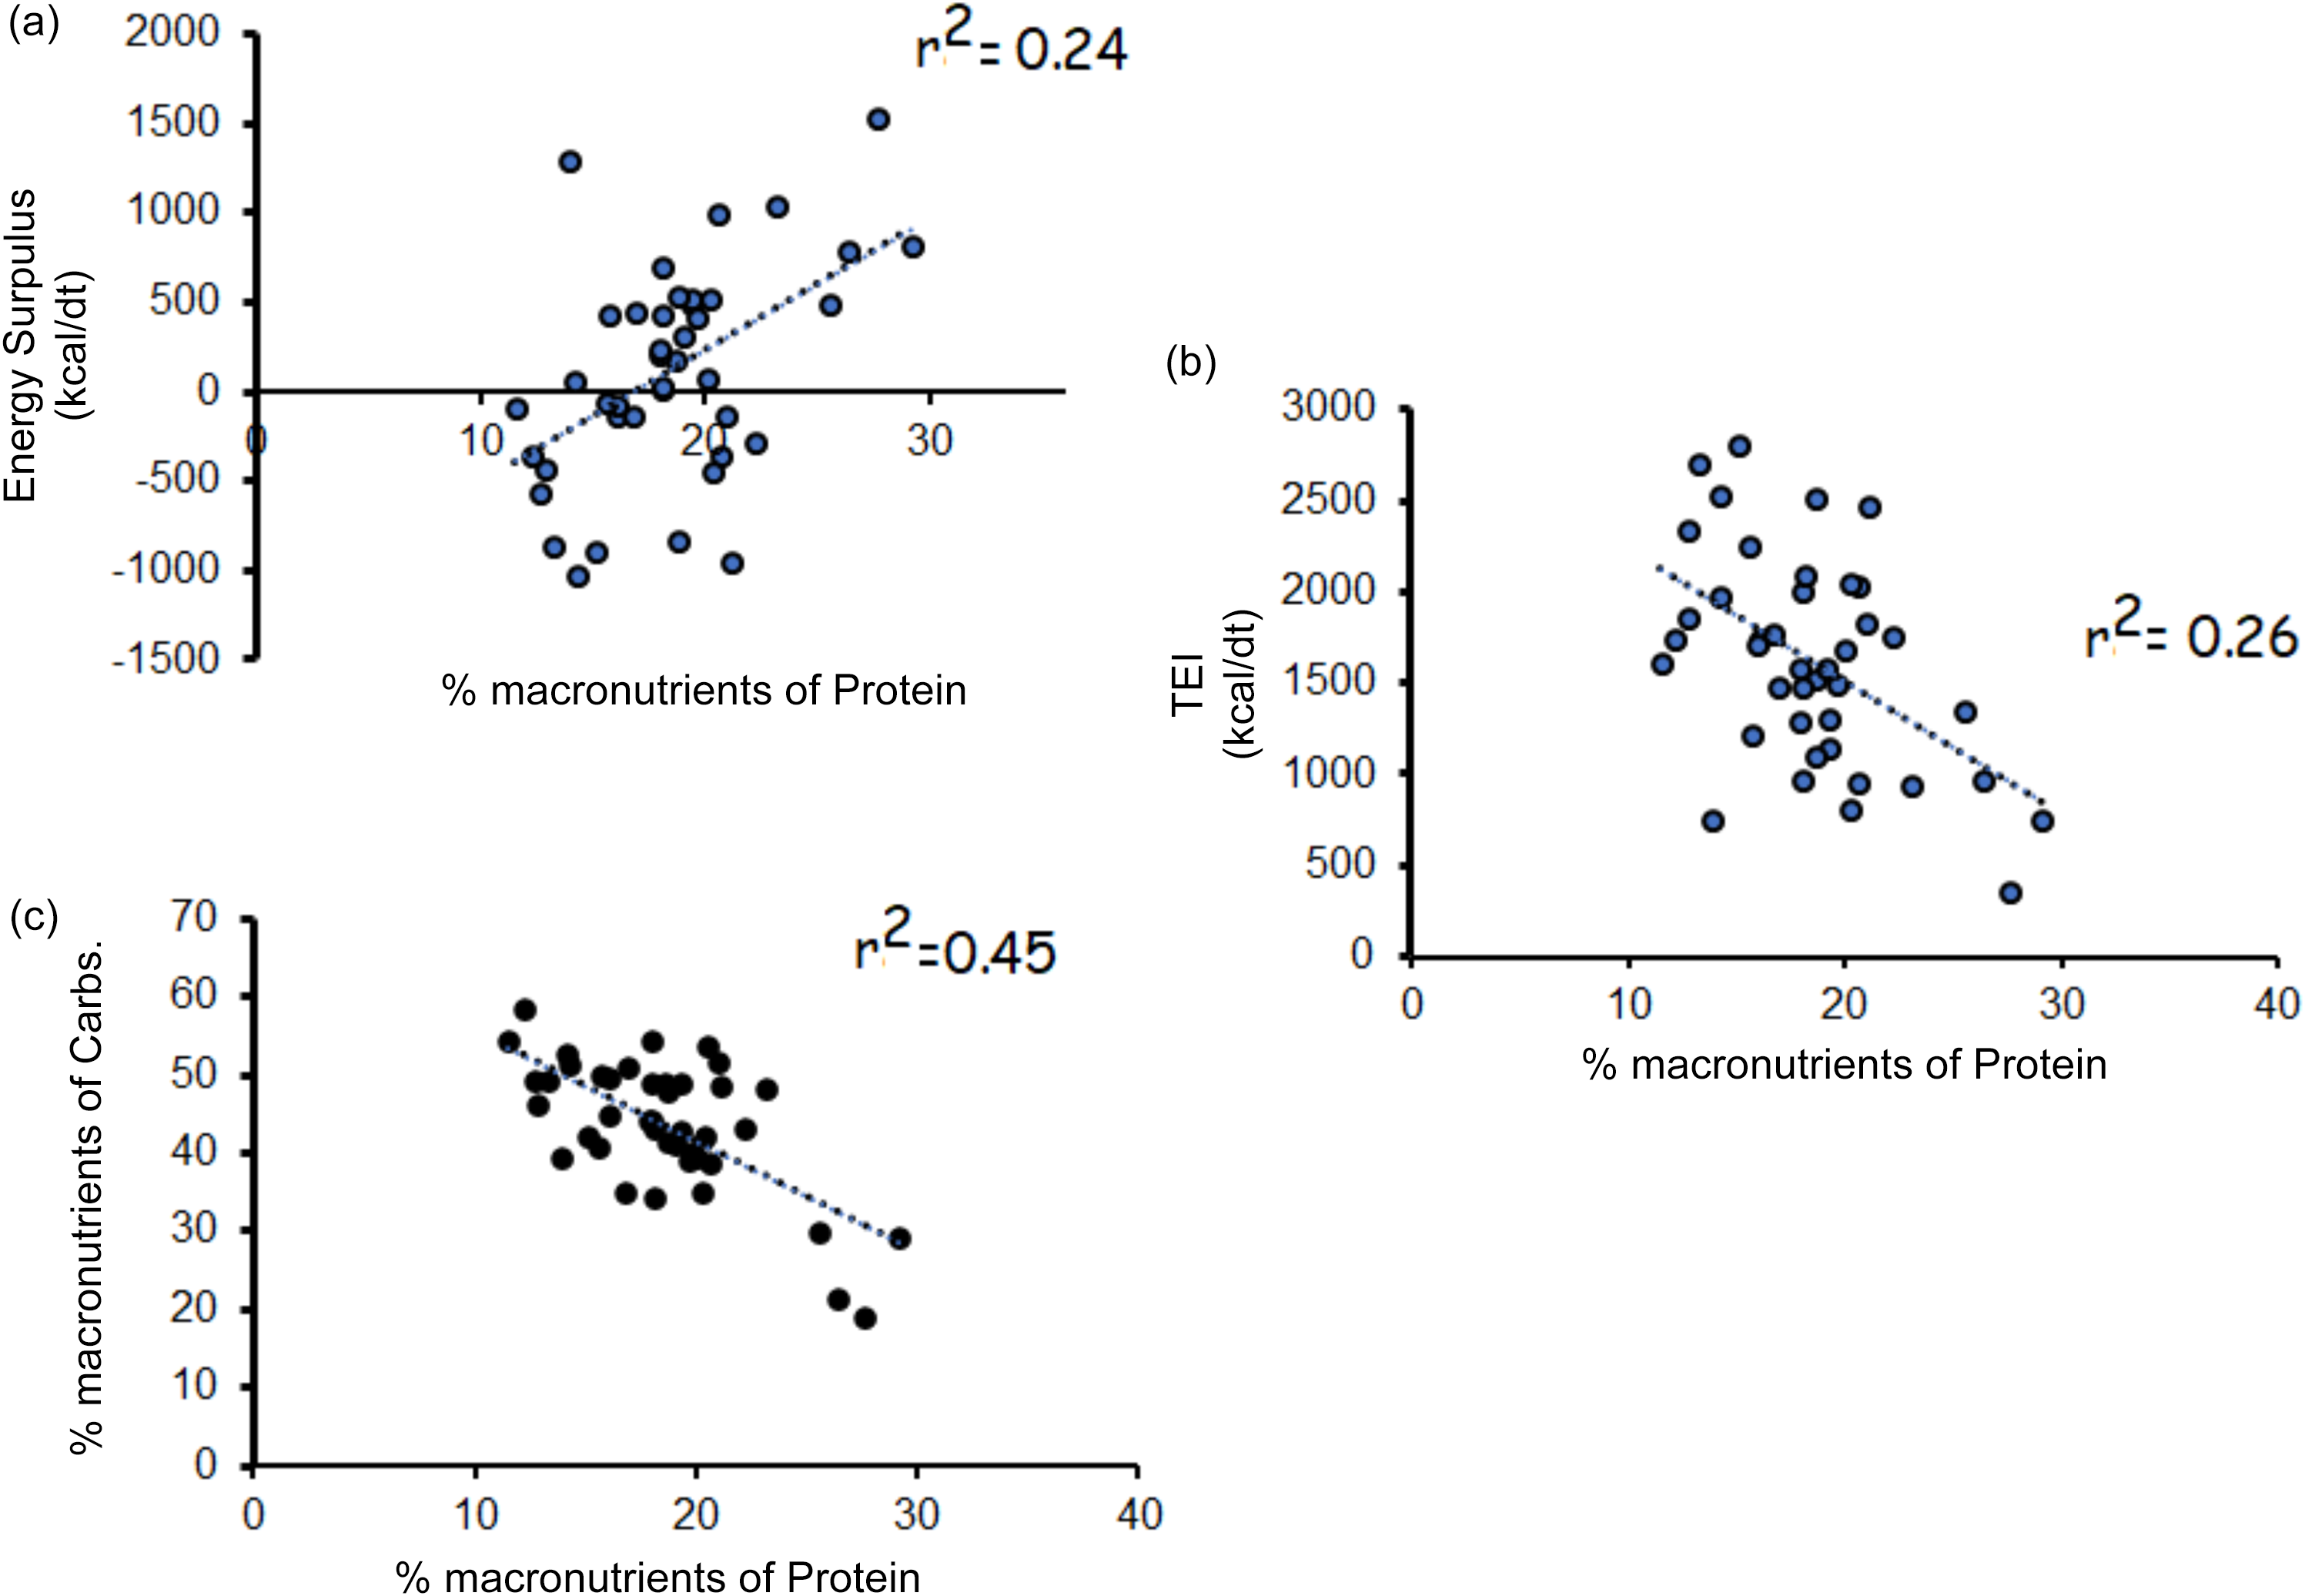
Figure 2 Long description
The image contains three scatter plots with linear regression lines. The first plot (a) shows the relationship between the percentage of macronutrients from protein and energy surplus in kilocalories per day, with an r-squared value of 0.24. The second plot (b) illustrates the relationship between the percentage of macronutrients from protein and total energy intake in kilocalories per day, with an r-squared value of 0.26. The third plot (c) depicts the relationship between the percentage of macronutrients from protein and carbohydrates, with an r-squared value of 0.45. Each plot has data points scattered around the regression line, indicating varying degrees of correlation.
Linear regression analyses (a) percentage macronutrients of carbohydrates and total energy intake (TEI; kcal/d); (b) percentage macronutrients of carbohydrates and percentage macronutrients of fats.
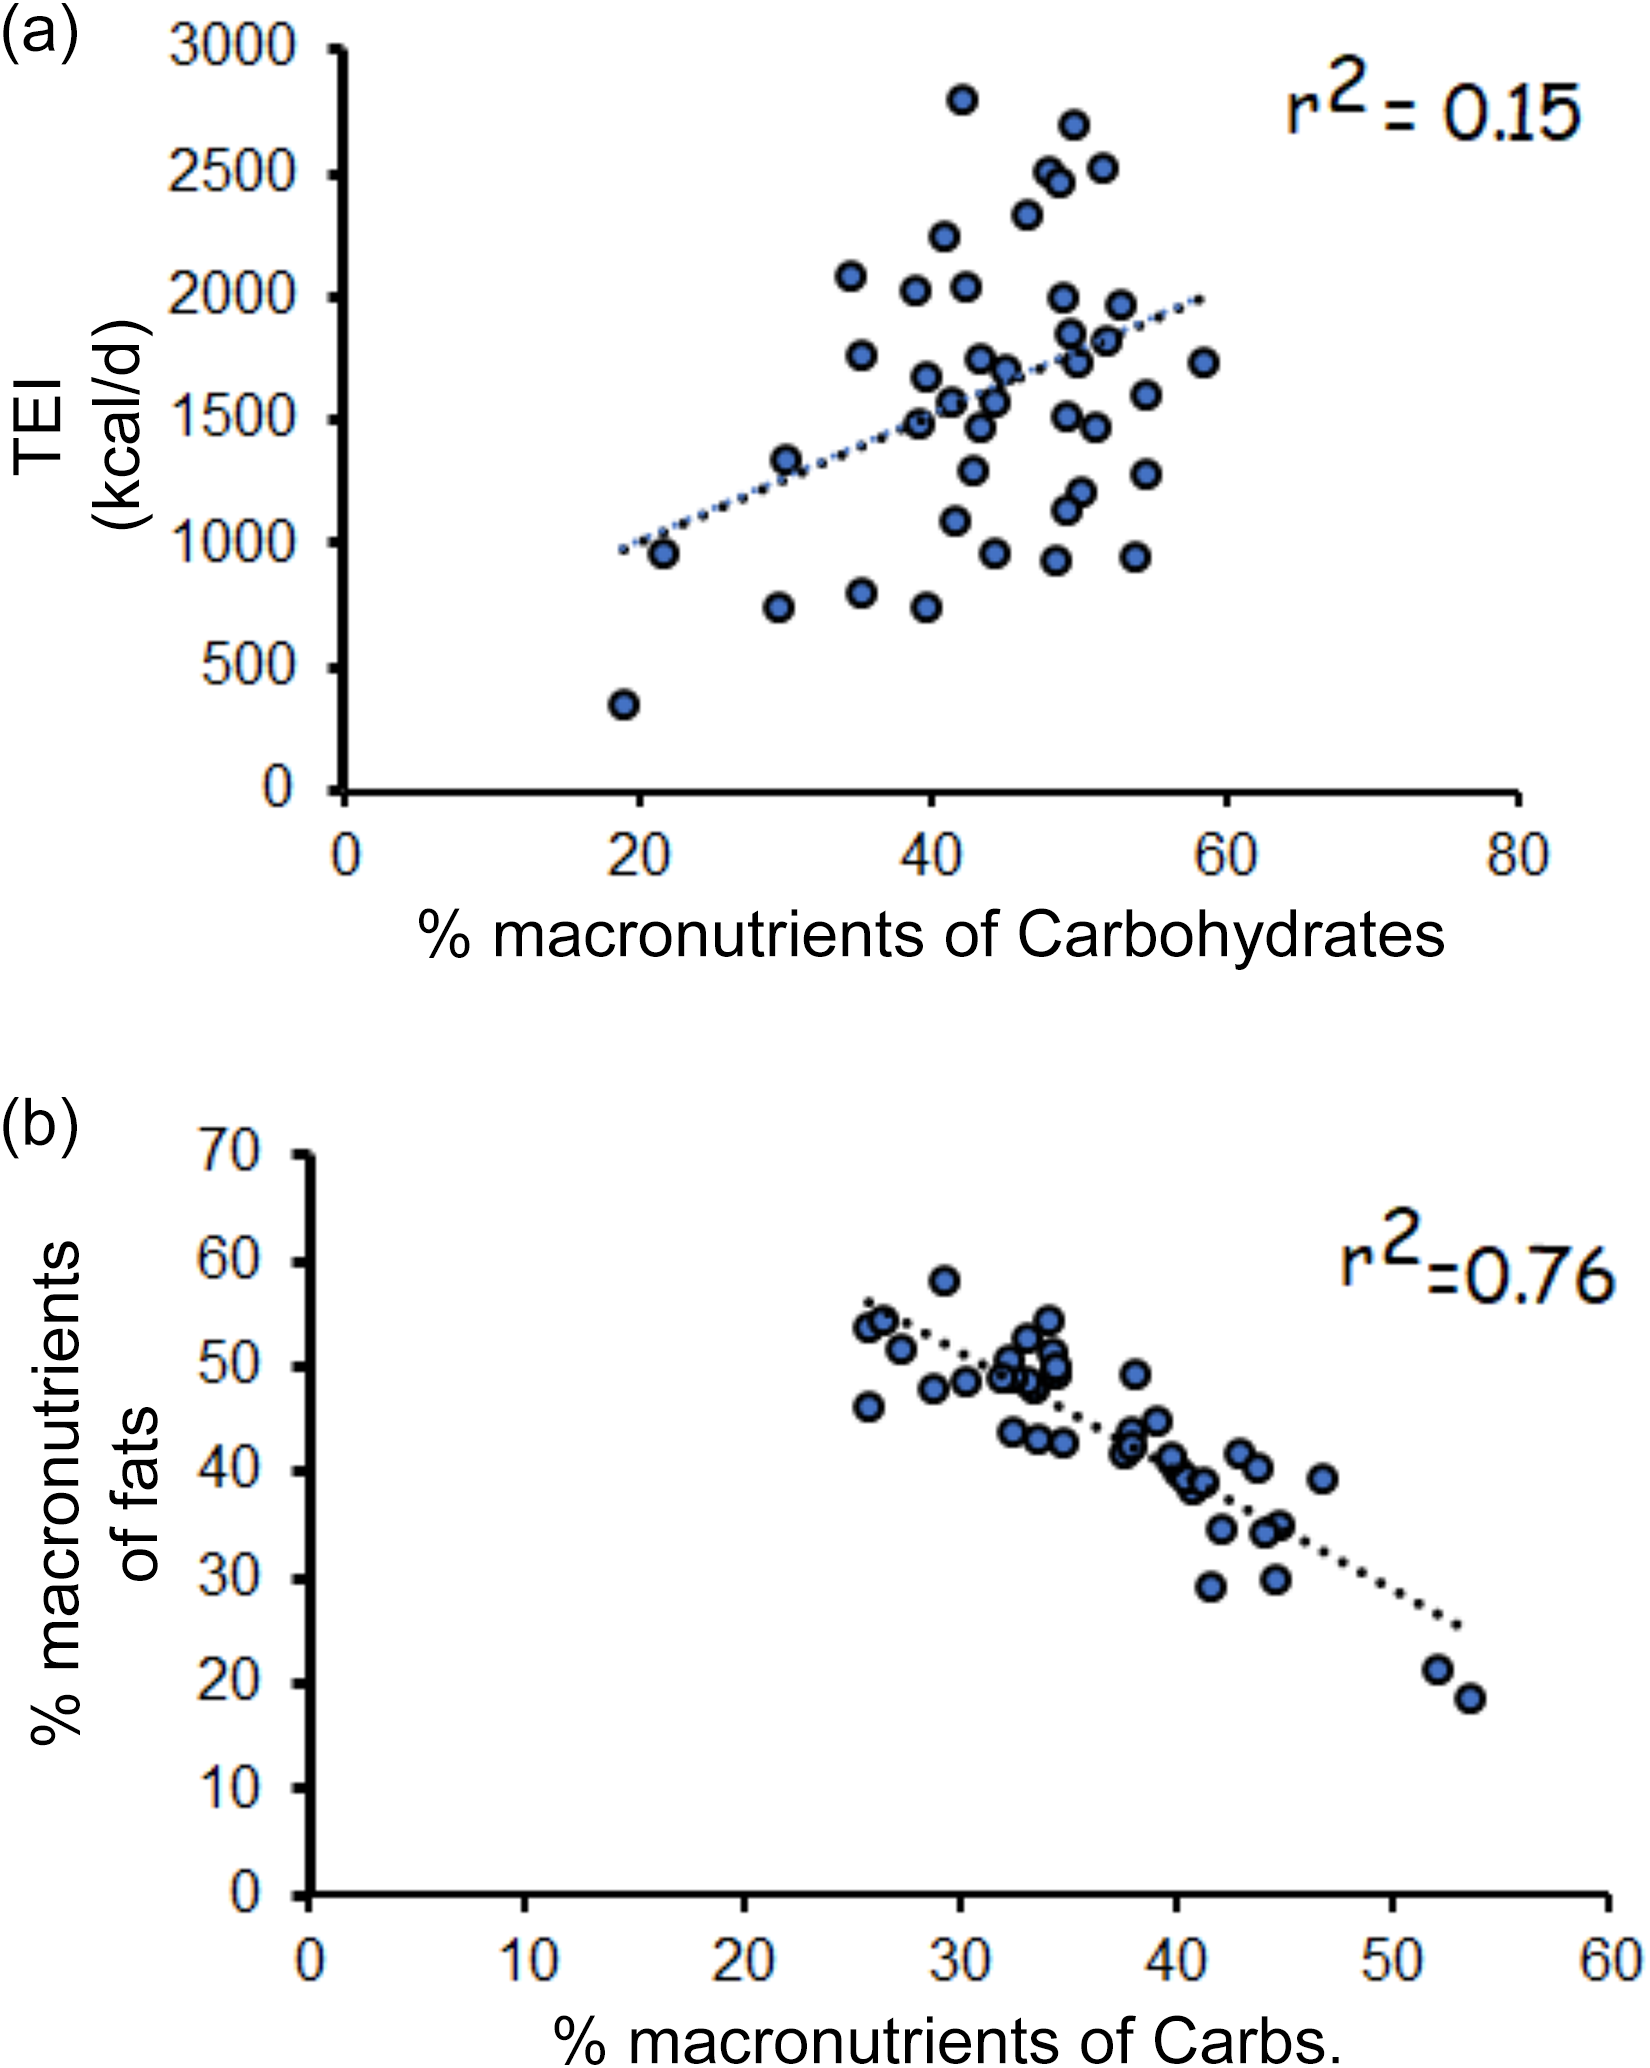
Figure 3 Long description
A scatter plot with two subplots. Subplot (a) shows the relationship between the percentage of macronutrients from carbohydrates and total energy intake (TEI) in kilocalories per day. The x-axis represents the percentage of macronutrients from carbohydrates, ranging from 0 to 80. The y-axis represents TEI, ranging from 0 to 3000 kilocalories per day. The data points are scattered with a weak positive correlation, indicated by an r-squared value of 0.15. Subplot (b) shows the relationship between the percentage of macronutrients from carbohydrates and the percentage of macronutrients from fats. The x-axis represents the percentage of macronutrients from carbohydrates, ranging from 0 to 60. The y-axis represents the percentage of macronutrients from fats, ranging from 0 to 70. The data points show a strong negative correlation, indicated by an r-squared value of 0.76. Both subplots include a dotted trend line. All values are approximated.
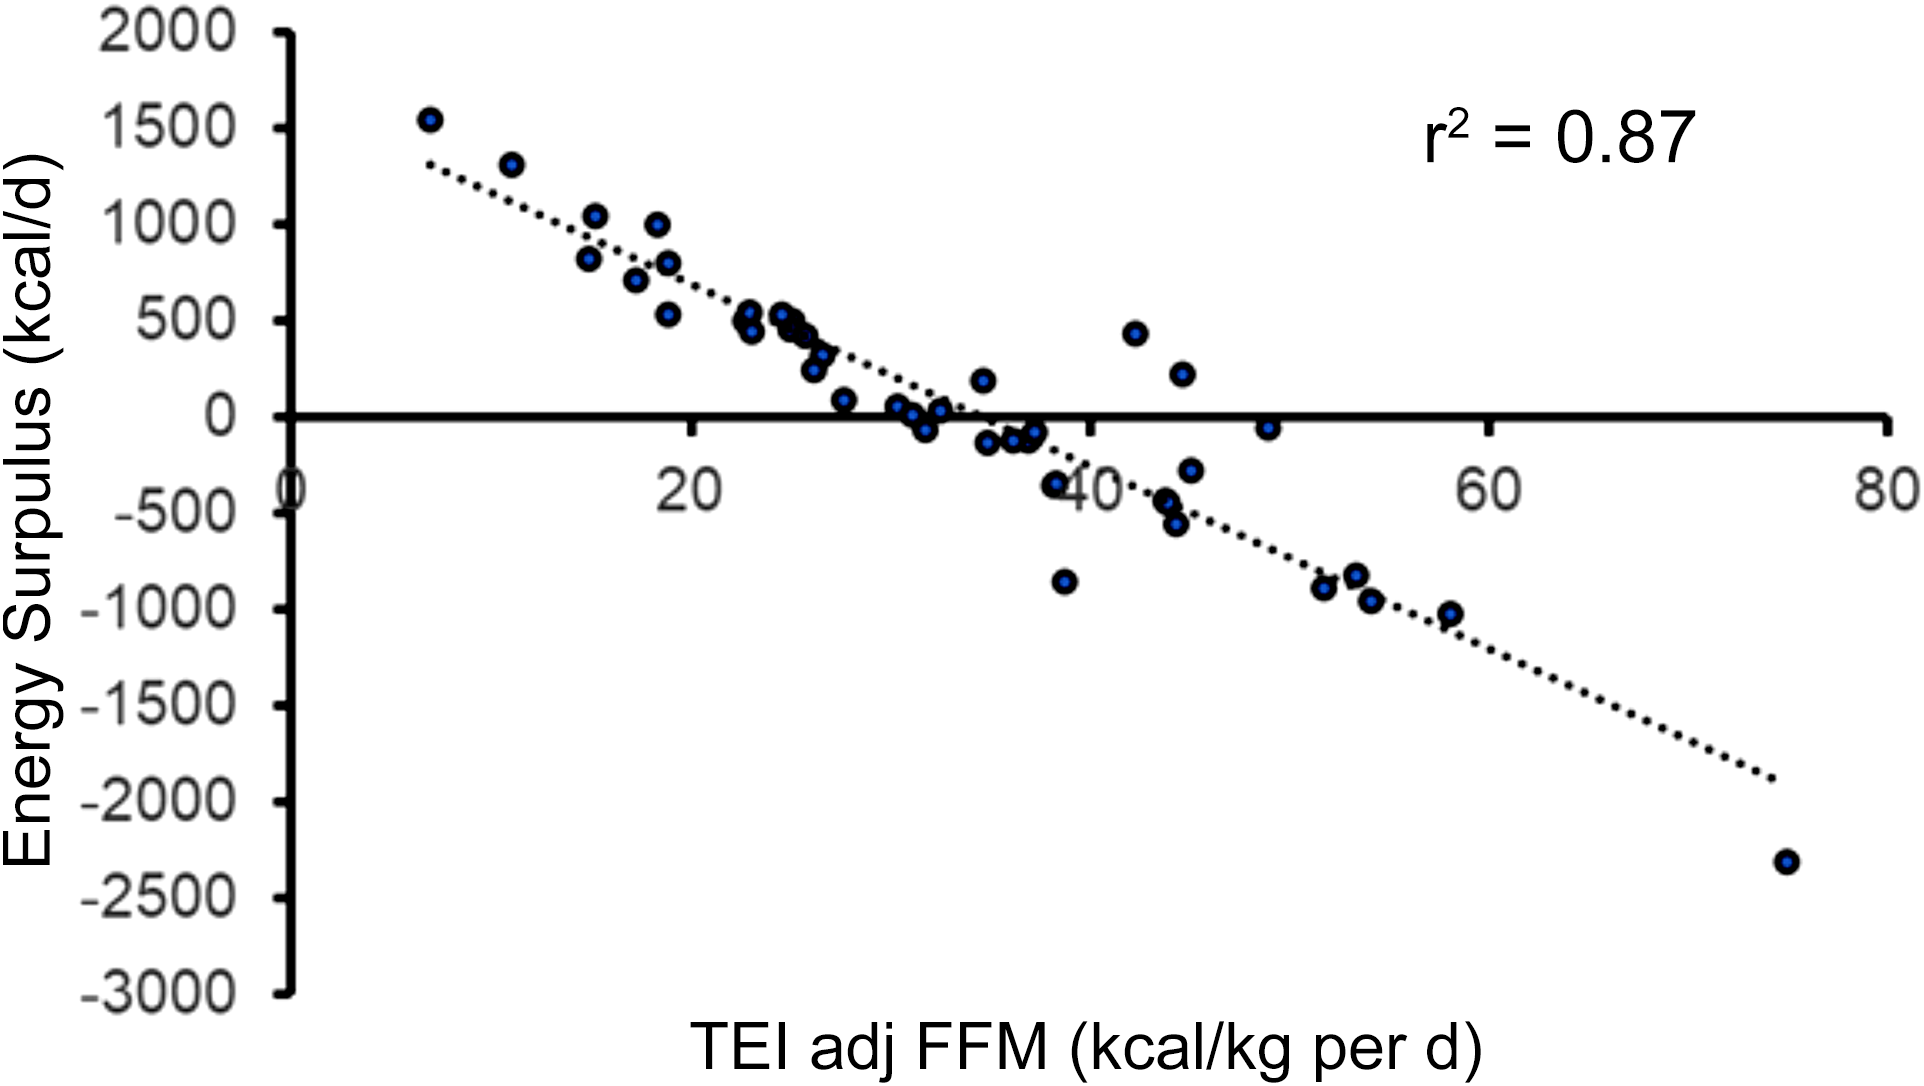
Furthermore, TEI adjusted to fat-free mass (FFM) explained 87 % of the variance in energy surplus (r 2 0·87, P < 0·001; Figure 4). The results indicated that a TEI adjusted to FFM of 34·7 kcal/kg per d is likely to balance TEI and TEE and results in zero energy surplus (Energy Surplus = –47·24 (TEI adjusted to FFM) + 1638). The sarcopenia index was not related to energy surplus in persons with SCI.
Linear regression analysis of TEI adjusted to fat-free mass (FFM) and energy surplus. Based on the regression analysis, a 34·7 kcal/kg per d hypothetical value was recommended to balance TEE and TEI.
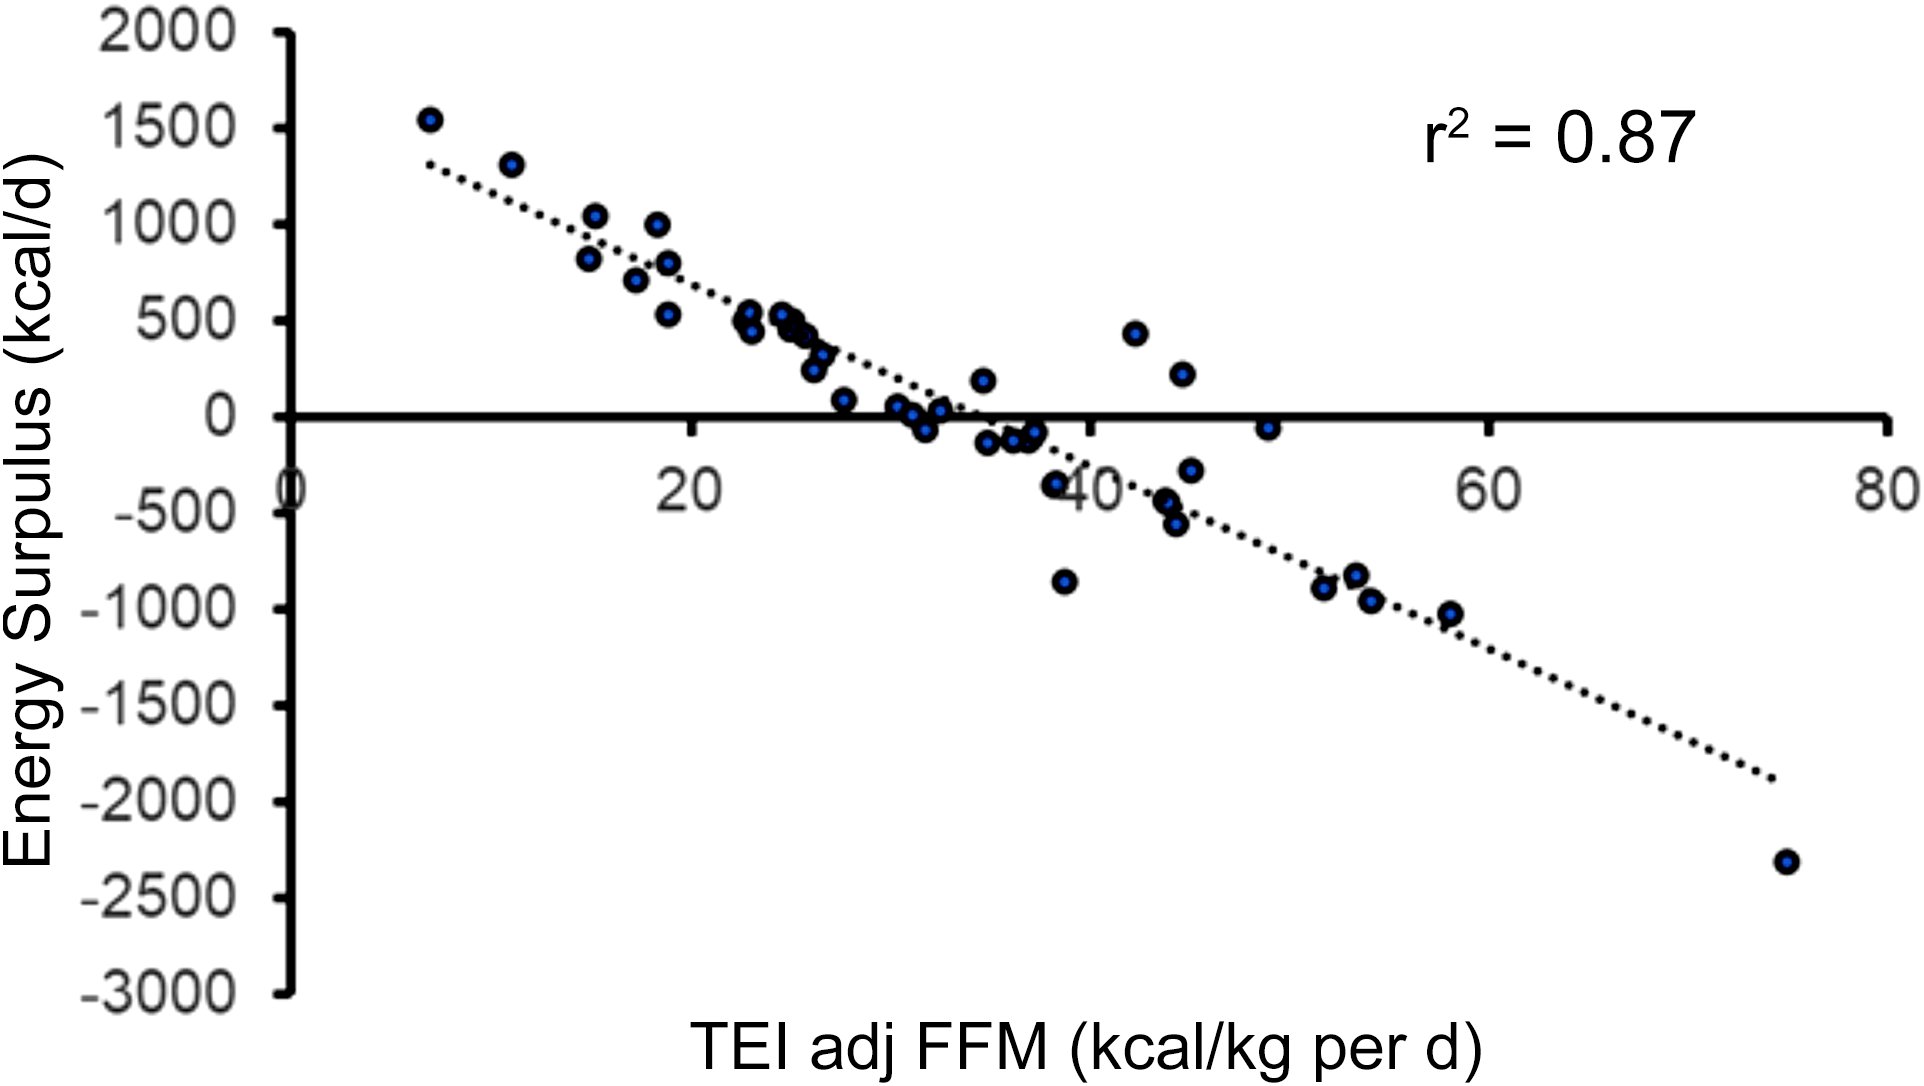
Figure 4 Long description
A scatter plot with a dotted regression line showing the relationship between TEI adjusted to fat-free mass and energy surplus. The x-axis represents TEI adjusted to fat-free mass in kilocalories per kilogram per day, ranging from 0 to 80. The y-axis represents energy surplus in kilocalories per day, ranging from -3000 to 2000. The plot includes dozens of data points, showing a negative correlation between the two variables. The r-squared value of 0.87 indicates a strong fit of the regression line to the data points. All values are approximated.
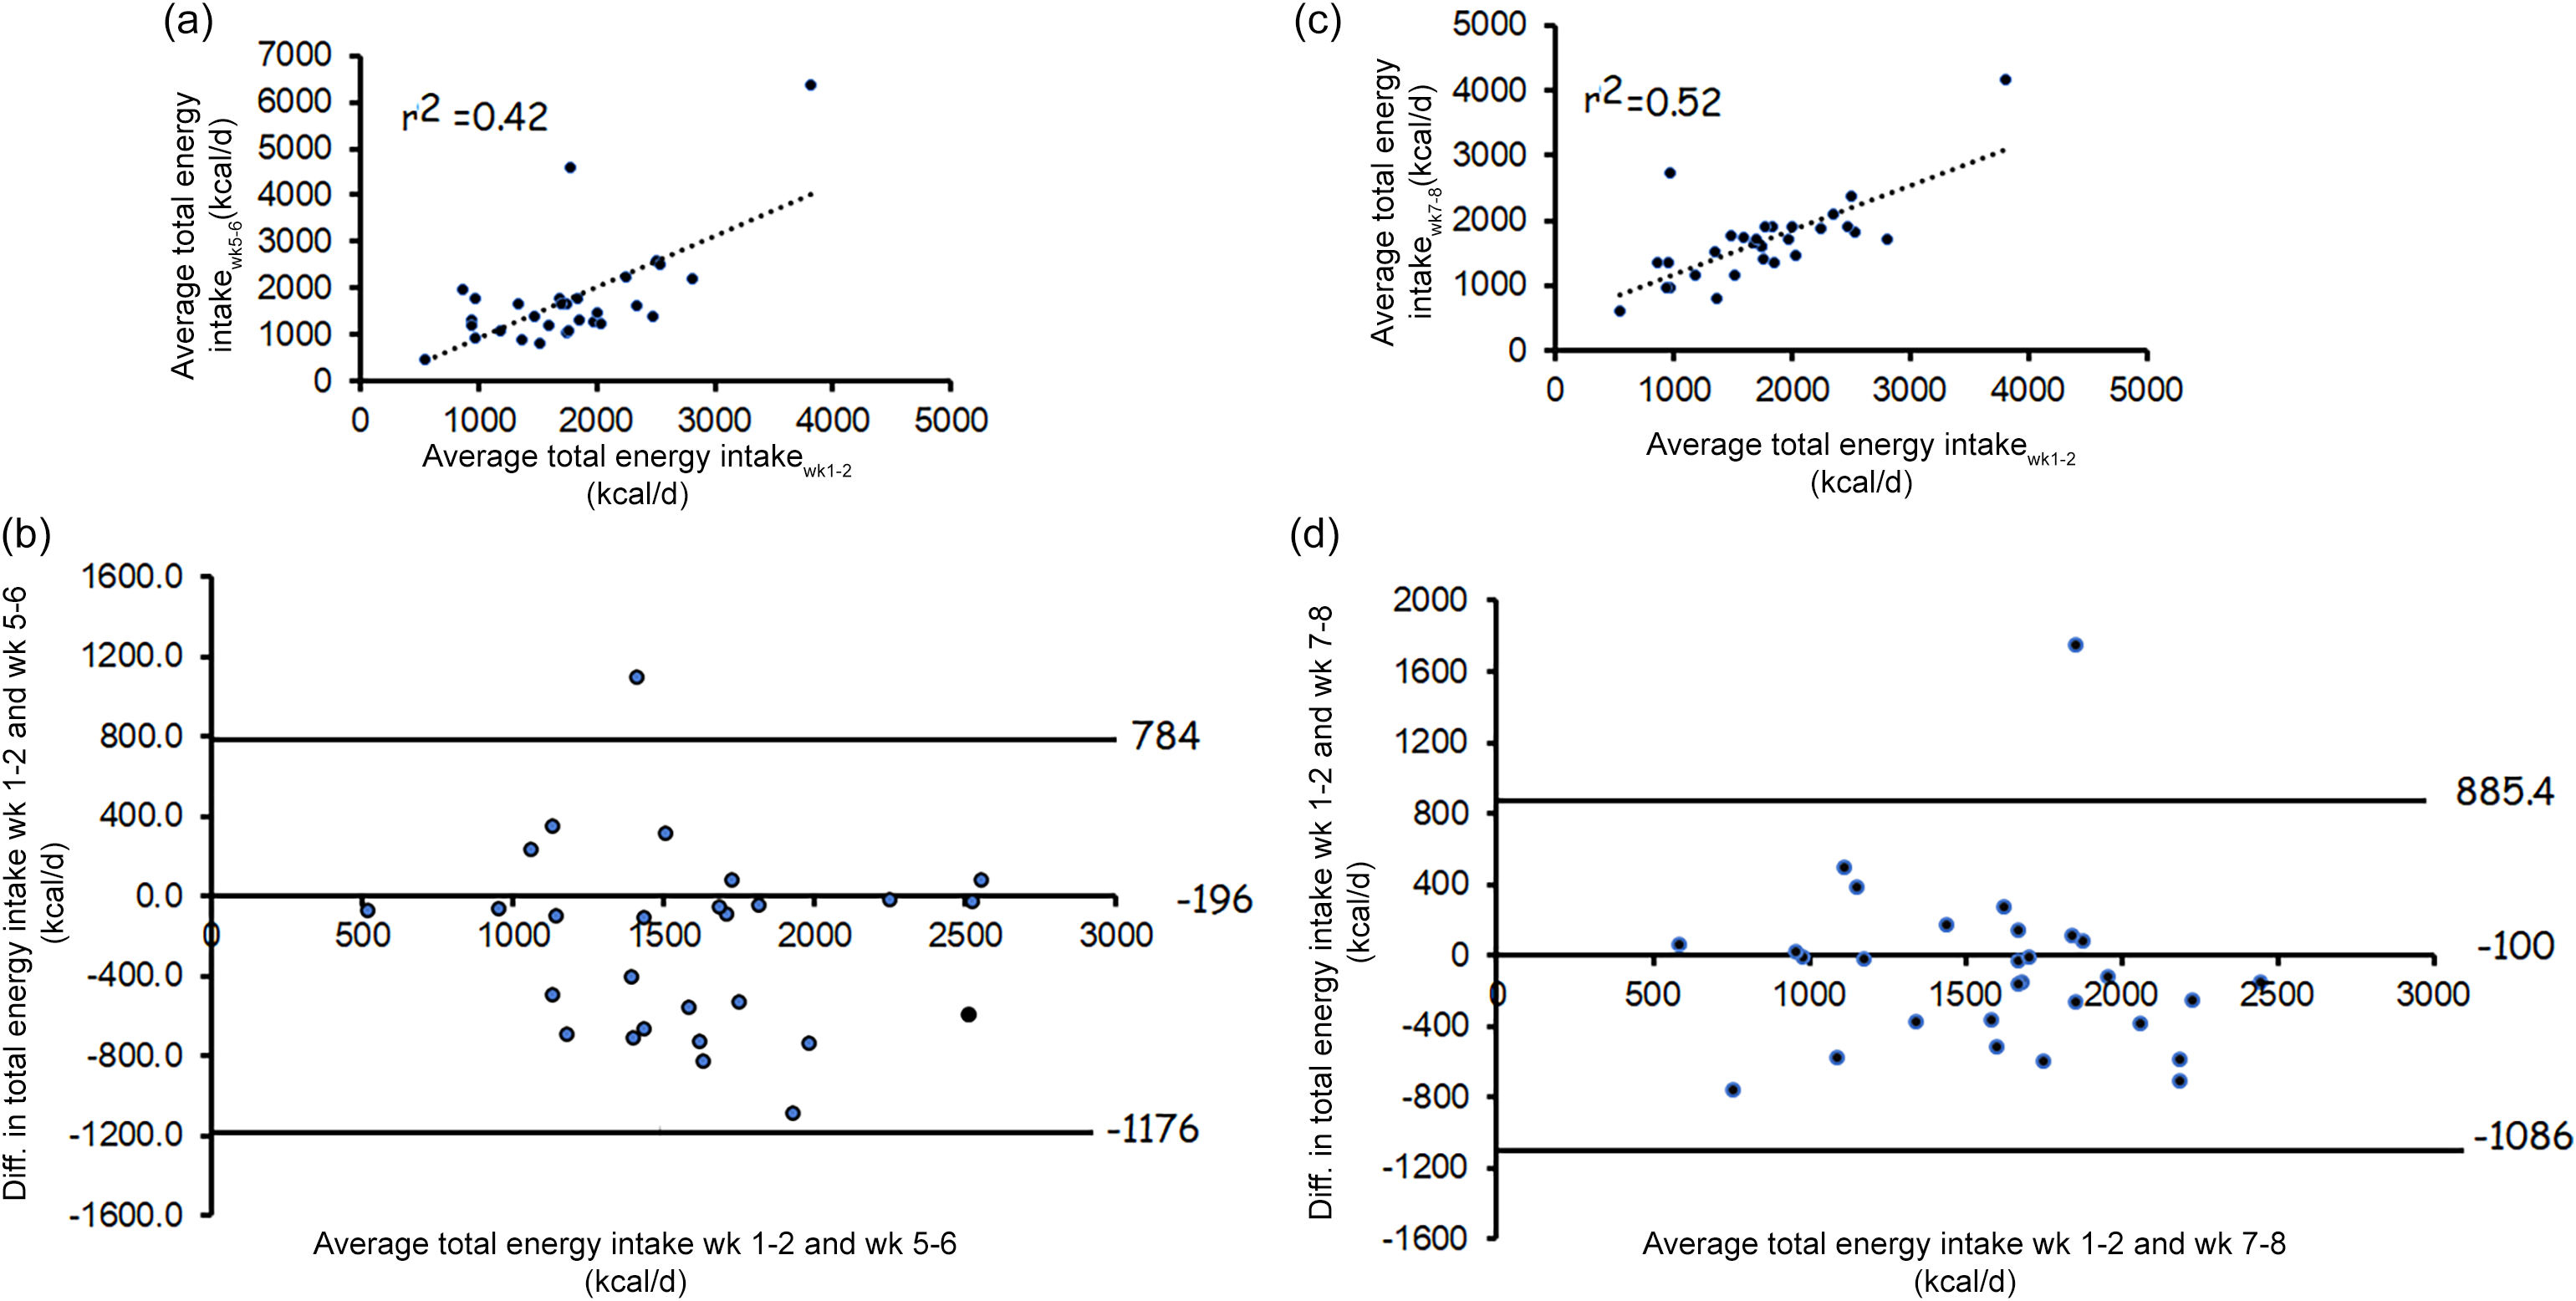
Regardless of the group assignments, the caloric intakes of thirty participants out of the forty-two participants were determined over time for weeks 5–6 and weeks 7–8. Repeated-measures ANOVA indicated that there was no difference (P = 0·80) in caloric intakes in weeks 1–2 (1753 (sd 681)), weeks 5–6 (1750 (sd 1154)) and weeks 7–8 (1675 (sd 646)). Linear regression analysis indicated that caloric intake in weeks 1–2 explained 42 % in weeks 5–6 (r 2 0·42; P < 0·001; Figure 5(a)) with a mean bias of 0·22 %; Figure 5(b) and 52 % in weeks 7–8 (r 2 0·52; P < 0·001; Figure 4(c)) with a mean bias of 0·27 % (Figure 5(d)).
Represents the agreement (n 30 participants) between total energy intake (TEI) at weeks (1–2), weeks (5–6) and weeks (7–8). (a) linear regression analysis between TEI at weeks 1–2 and weeks 5–6; (b) Bland–Altman analysis of the TEI between weeks 1–2 and weeks 5–6 (sem is 0·24 %); (c) linear regression analysis between TEI at weeks 1–2 and weeks 7–6; (d) Bland–Altman analysis of the TEI between weeks 1–2 and weeks 6–7 (sem is 0·22 %). The results highlight the variability in caloric intake in participants with SCI.
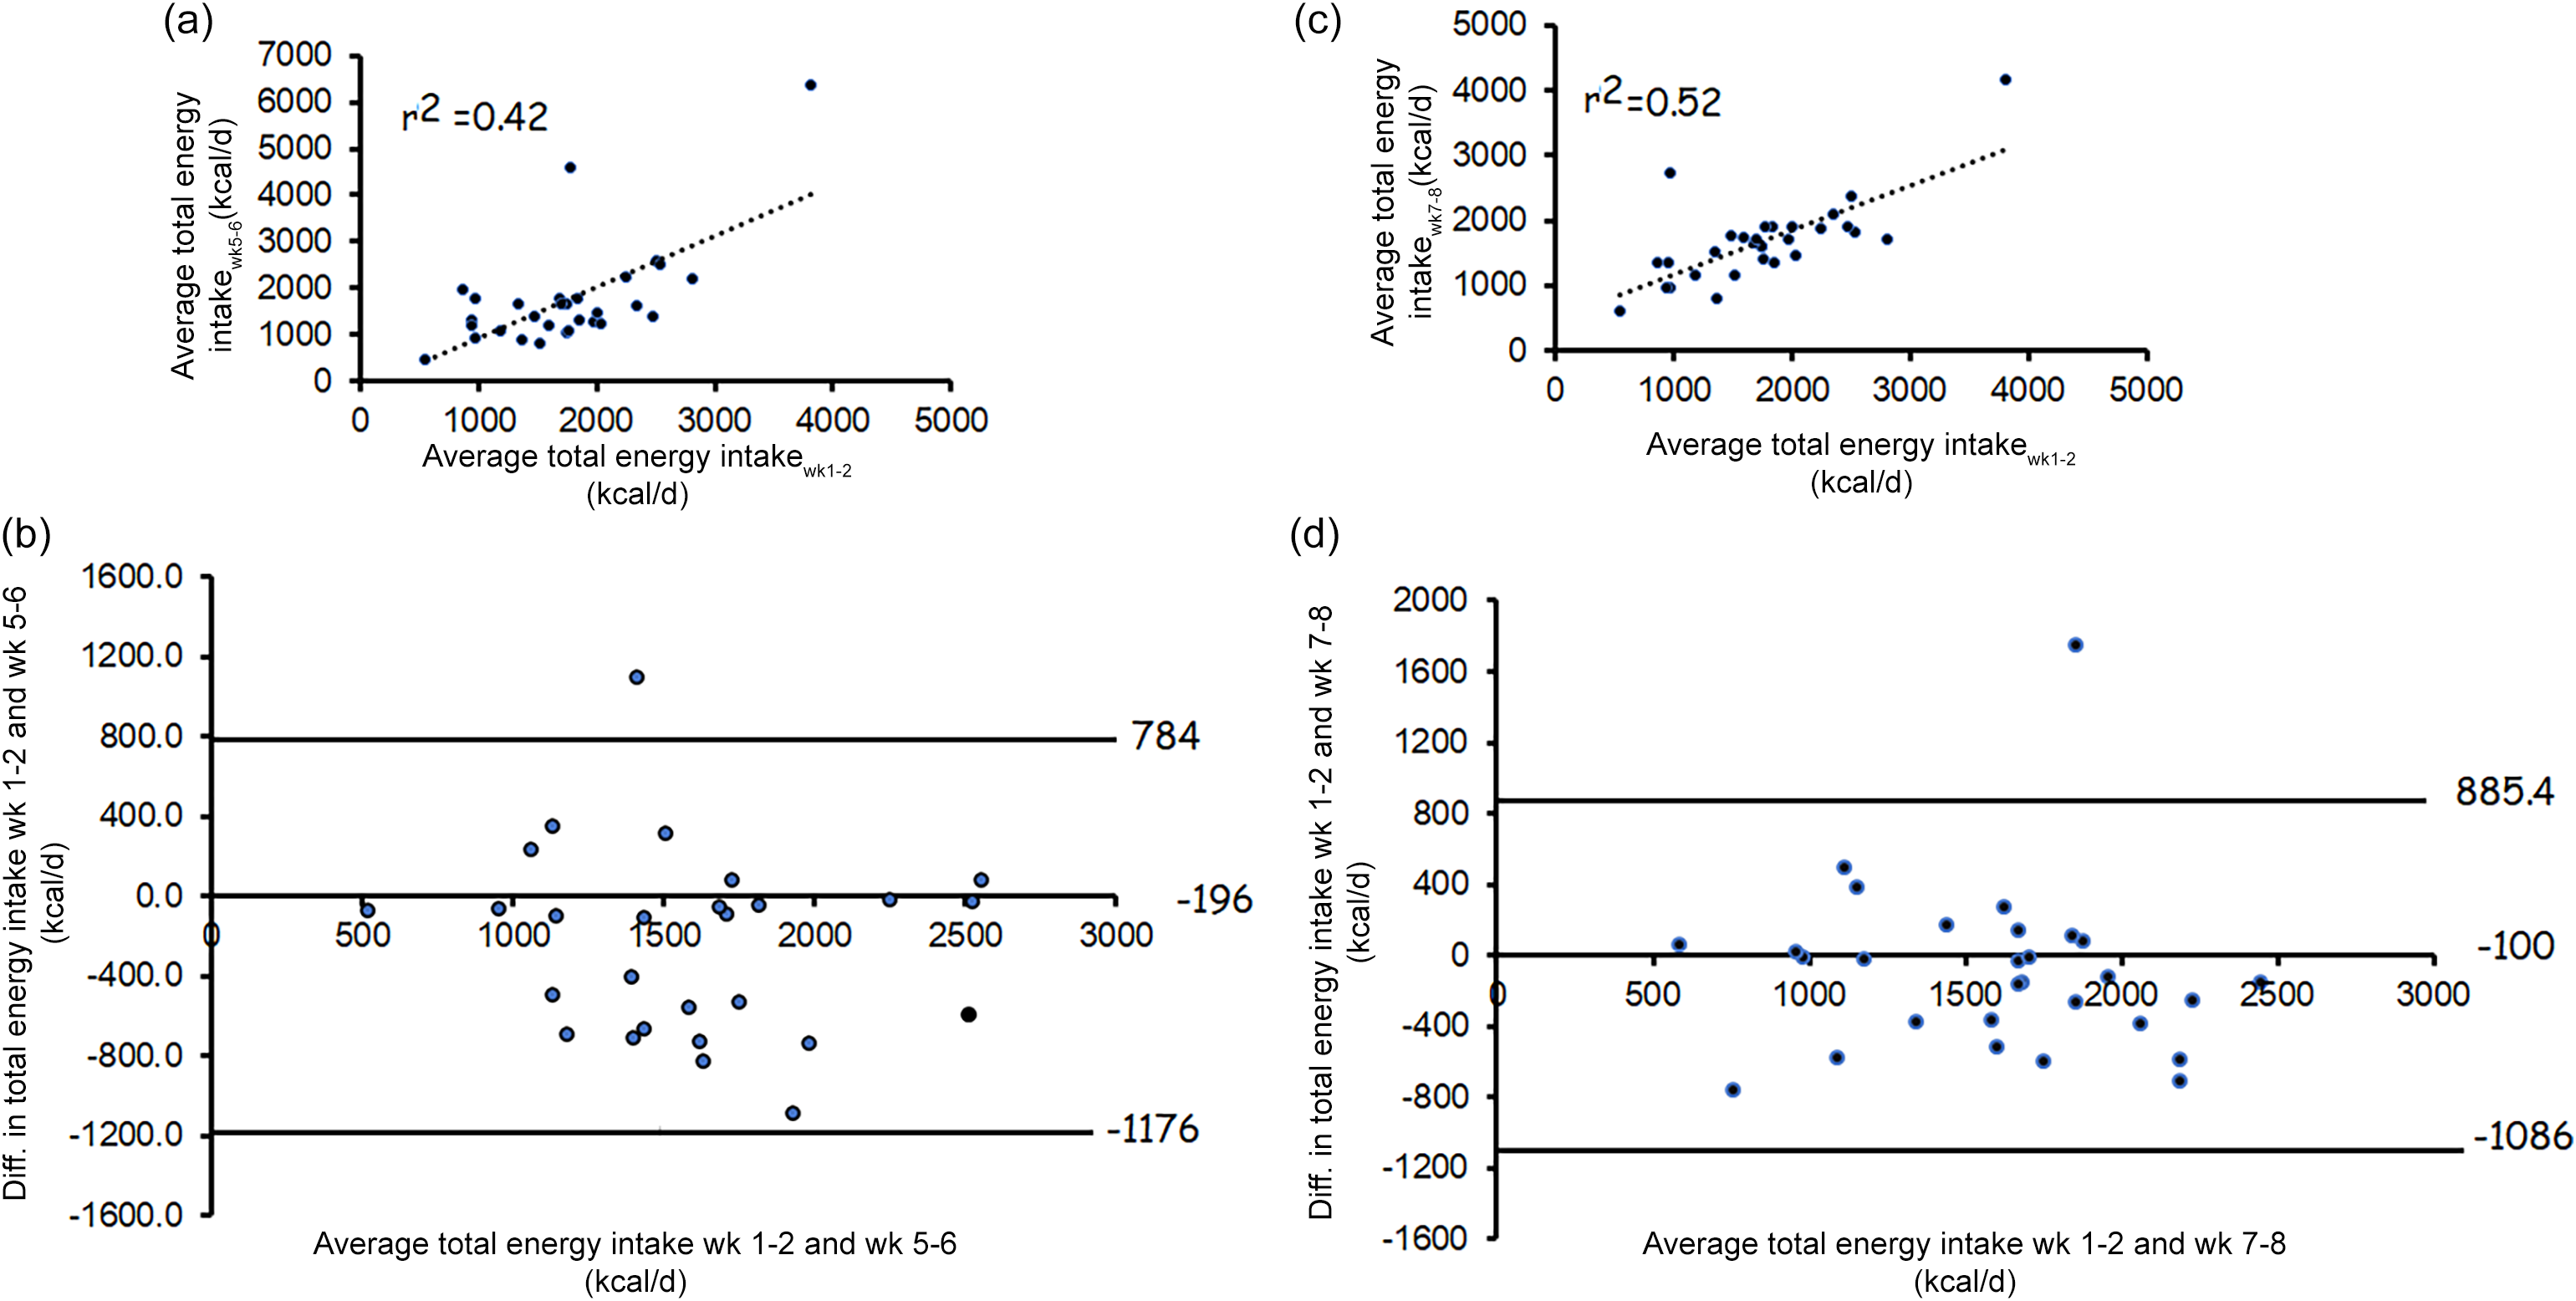
Figure 5 Long description
The image contains four graphs analyzing the agreement between total energy intake (TEI) at different weeks for participants with spinal cord injury. The first graph (a) is a scatter plot showing a linear regression analysis between TEI at weeks 1-2 and weeks 5-6, with an r-squared value of 0.42. The second graph (b) is a Bland-Altman plot showing the difference in TEI between weeks 1-2 and weeks 5-6, with a mean difference of 784 kilocalories per day and a standard error of measurement of 0.24 percent. The third graph (c) is another scatter plot showing a linear regression analysis between TEI at weeks 1-2 and weeks 7-8, with an r-squared value of 0.52. The fourth graph (d) is a Bland-Altman plot showing the difference in TEI between weeks 1-2 and weeks 7-8, with a mean difference of 885.4 kilocalories per day and a standard error of measurement of 0.22 percent. These graphs highlight the variability in caloric intake among participants with spinal cord injury.
Discussion
Persons with SCI experience a wide spectrum of energy balance as characterised by the difference in TEI and total TEE. This resulted in the classification of forty-two participants with chronic SCI based on their energy surpluses into either negative or positive energy surpluses. Notably, 57 % of the negative energy participants had lower caloric intake than their estimated TEE. TEE was calculated as the product of BMR × 1·15 (SCI-specific factor)(Reference Farkas, Gorgey and Dolbow21). The negative energy group was heavier than the positive energy group with favourable body composition as characterised by greater total body lean mass, trunk and leg lean masses. Additionally, the negative energy group consumes a greater % macronutrients of protein with a lower fasting insulin level compared with the positive energy group. There were clear independent associations of the percentage macronutrients of protein, carbohydrates and fats with energy surplus. However, a multiple regression model indicated that only the percentage macronutrients of protein explained 27 % of the variance in energy surplus. Finally, simple regression analysis indicated that TEI adjusted to FFM explained 87 % of the energy surplus. A recommended TEI of 34·7 kcal/kg per d is likely to balance TEE with TEI and results in an energy surplus of zero.
Rationale of conducting the trial
Dietary guidelines for Americans 2020–2025 indicated that positive energy surplus is a continuous problem that leads to the pandemic of obesity in the US population(33). Despite these recommendations, adherence of the US population to the dietary guidelines did not exceed 59 % over a 10-year period. As a result, 74 % of the US adults were either overweight or obese. In our study, 44 % (8/18) and 71 % (17/24) were considered obese (BMI > 22 kg/m2) in the positive and negative energy groups, respectively. In 2009–2010, the unadjusted mean caloric intake for men was approximately 2565 kcal/d(Reference Ford and Dietz34). This comparison may suggest that the positive and energy surplus groups with SCI consumed approximately 14 and 50 %, respectively, lower daily caloric intake than the average American adults. On the other hand, a positive energy surplus of 50–100 kcal/d may gradually accumulate to cause obesity in adults(Reference Hill, Wyatt and Reed35). Energy surplus in our cohort is approximately 5× more in the positive energy group. Therefore, the extrapolation of able-bodied dietary trends to adults with SCI may be misleading and clinically problematic.
Maintenance of adequate caloric balance is considered a successful approach to combating obesity and malnutrition in persons with SCI(Reference Gater, Farkas and Tiozzo1,Reference Farkas, Sneij and McMillan12) . Surprisingly, 57 % of the participants in the present study were classified as being on a negative energy diet (i.e. TEE > TEI). This is measured by the difference in the average daily caloric intake (TEI) of the first 2 weeks compared with their TEE. This pattern resembles caloric-deficit diet studies that have previously been shown to effectively manage obesity and reduce body weight(Reference Most and Redman18). However, it is established that lower caloric intake or caloric restriction negatively impacts BMR and may lead to induced cachexia(Reference Most and Redman18,Reference Olson, Marks and Grossberg36) . A previous review indicated that caloric restriction may lead to a 15 % decrease in BMR(Reference Most and Redman18). Caloric restriction also results in a loss in body weight, with a 30 % loss in FFM(Reference Most and Redman18). Similarly, a previous retrospective case report indicated that a caloric deficit of 445 kcal/d (25 %) resulted in an 8 % reduction in body weight, accompanied by decreases of 29 % in total body fat and 31 % in thigh subcutaneous adipose tissue(Reference Gorgey, Lester and Ghatas37). Finally, trunk visceral adipose tissue and subcutaneous adipose tissue cross-sectional area decreased by 12 and 22 % following 16 weeks(Reference Gorgey, Lester and Ghatas37). A Mediterranean low-fat diet with lifestyle changes in the form of circuit resistance training for 6 months resulted in 7 % decrease in body weight with improvement in cardiometabolic risk factors in three persons with SCI(Reference Bigford, Mendez and Betancourt38). Others have also shown that caloric deficit via conducting gastric sleeve surgery in a person with C5 AIS D SCI resulted in decreasing BMI by 34 % and improvement in gait parameters as measured by 6-min walking test and 10-m walking test after 52 weeks(Reference Perreault, Geigle and Gorman39).
The findings in the present study are in line with a previous trial that indicated that participants with perceived higher BMI consumed fewer calories than participants who perceived themselves with a lower BMI(Reference Mbarushimana, Gustafson and Gitungwa40). However, the current findings should be considered with caution because an extensive caloric deficit may induce malnutrition and other co-morbidities(Reference Areni, Capeci and Cassinis17,Reference Gorgey, Lester and Ghatas37) . Malnutrition is a common problem that occurs early in the acute stage because of associated anxiety and depression after SCI(Reference Areni, Capeci and Cassinis17). Therefore, it is important to ensure that these participants did not experience malnutrition, which may induce catabolic effects on lean mass and result in fatigue as well as a reduction of activities of daily living(Reference Olson, Marks and Grossberg36). Additionally, our findings indicated that balancing TEI with TEE may combat obesity and overcome the problem of malnutrition after SCI. A recommended TEI of 34·7 kcal/kg per d has mathematically equated to zero surplus in our model. This model may need accurate calculations of FFM either via DXA or body weight using previously proposed predicted equations in persons with SCI(Reference Gorgey, Dolbow and Gater41). However, this may need additional validation in a separate cohort with SCI.
The use of DXA as a three-compartment assessment technique provides an opportunity to measure fat mass, lean mass and bone mass(Reference Cho, Cho and Han32,Reference Lester, Ghatas and Khan42) . Compared with the gold standard technique, the use of DXA may introduce an error close to 5 % in measuring fat mass in persons with SCI(Reference Gater, Farkas and Dolbow28). In the current trial, fat mass index was used compared with %FM as a part of the nutritional science guidelines(Reference Peltz, Aguirre and Sanderson43). The use of %FM as an index of adiposity may be statistically problematic(Reference Wells44). This may result from dividing fat mass by body weight as fat mass may exist in both the numerator and denominator(Reference Wells44). Additionally, the increase in absolute FM may eventually trend towards an asymptote at 60 % fat mass(Reference Wells44). Despite this limitation, %FM may allow comparisons across different studies independent of the body composition assessment techniques in persons with SCI.
Total body lean mass explained more than 65 % of the variance in BMR after SCI(Reference Dora, Khalil and Adler23). The negative energy group has 9 % higher BMR (∼143 kcal/d) than the positive energy group. The difference in BMR is simply explained by the difference in body weight and primarily explained by the difference in lean mass. The precision of measuring BMR is highly important for the outcomes of TEE. Indirect calorimetry is considered the gold standard of measuring BMR(Reference Farkas, Sneij and McMillan12,Reference Alazzam, Alrubaye and Goldsmith19,Reference Alazzam and Gorgey20) . Therefore, we have adopted strict procedures including an overnight fast for 10–12 h immediate calibration prior to conducting the test according to the manufacturer’s guidelines and conducting the exam in a quiet, dark, thermoneutral room after awakening our participant(Reference Alazzam and Gorgey20). Additionally, the SCI-specific factor of 1·15 was used to ensure accurate reflection of the level of physical activity(Reference Farkas, Gorgey and Dolbow21).
The role of caloric intake and macronutrients on BMR is not well established after SCI. However, different macronutrient components may partially explain the variance in body composition parameters after SCI(Reference Gorgey, Caudill and Sistrun13–Reference Goldsmith, Holman and Puri15). Percentage macronutrients of fat explained more than 1/3 of the variance in body composition, especially fat mass in persons with SCI(Reference Gorgey, Caudill and Sistrun13). Total protein intake (g) was negatively correlated with trunk visceral adiposity and positively related to fasting insulin after accounting for trunk muscles(Reference Abilmona and Gorgey14). Furthermore, geometric framework analysis suggested that carbohydrate intake is important for body composition after SCI. Persons with SCI who consume lower than 150 g/d of carbohydrate intake are more likely to have greater subcutaneous adipose tissue(Reference Goldsmith, Holman and Puri15). This may suggest that the dynamic of adipose tissue storage is influenced by carbohydrate intakes(Reference Goldsmith, Holman and Puri15). In the same report, either macronutrients of protein or fats did not appear to influence the parameters of body composition after SCI(Reference Goldsmith, Holman and Puri15). Therefore, the current trial expanded our knowledge on how different macronutrients may influence energy balance and TEI after SCI.
High percentage macronutrients of protein explained 27 % of the variance in energy surplus compared with macronutrients of carbohydrates and fats. Furthermore, % macronutrients of protein negatively correlated with TEI. Previous work indicated that higher protein consumption is associated with increased satiety and increased thermogenesis and helps in the maintenance of FFM(Reference Paddon-Jones, Westman and Mattes45,Reference Ben-Harchache, Roche and Corish46) . We presented macronutrients as a percentage of total caloric intake to account for the large differences in caloric intake between the negative and positive energy groups. The positive energy surplus group had a 1·7× greater caloric intake than the negative energy surplus. Another systematic review indicated that protein intake is likely to suppress appetite with either positive or no effects on total caloric intake in older adults(Reference Gorgey, Goldsmith and Khalil47). Compared with carbohydrate intake, protein consumption seems to suppress appetite in persons with SCI and reduce caloric intake(Reference Farkas, Cunningham and Sneij16,Reference Gorgey, Lester and Ghatas37) . Previously, we noted that heavier persons with SCI experience greater muscle hypertrophy following surface neuromuscular electrical stimulation-resistance training(Reference Deitrich and Gorgey48). However, there were no differences in percentage macronutrients of protein between heavier and leaner persons with SCI(Reference Deitrich and Gorgey48). We also noted that body weight mediates the relationship between serum testosterone and bone mineral density in persons with SCI(Reference Morell and Fiszman49). Accordingly, it is plausible that protein may serve as an anorexigenic stimulus to the brain centres of appetite control and decrease total caloric intake. Although the exact mechanism is still unclear, it may involve postprandial release of glucagon-like peptide 1 and peptide YY following protein consumption(Reference Ravelli and Schoeller50).
Several reports have questioned the accuracy and validity of dietary logs and indicated that caloric intakes are either overestimated or underestimated(Reference Bailey51,Reference Nightingale, Williams and Thompson52) . In the current trial, we relied on the average of the first 2 weeks from two different clinical trials. In these trials, participants had originally met with a dietitian to provide them with clear instructions on how to accurately enter dietary logs and maintain percentage macronutrients of 45 % carbohydrates, 30 % fats and 25 % protein(Reference Gorgey, Caudill and Sistrun13–Reference Goldsmith, Holman and Puri15,Reference Gorgey, Khalil and Gill24,Reference Gorgey, Khalil and Carter25) . We have also measured the average of total caloric intake at weeks 5 and 6 and the average of weeks 7 and 8 to account for any potential underestimation in caloric intake in the negative energy group (see Figure 5). We noted that the caloric intake used to estimate TEE in the present study explained 42 and 52 % of the total caloric intake used in weeks 5 and 6 and weeks 7 and 8, respectively. Previously, Nightingale et al. estimated the inter-individual variability in TEI and TEE in persons with SCI(Reference Nightingale, Williams and Thompson52). They noted that 1 d is reasonable to measure TEE and 4 d to measure TEI(Reference Nightingale, Williams and Thompson52). The variability in measuring TEE is only 7 % (6–8 %) compared with 26 % (22–30 %) in the estimation of total TEI despite using 7-d dietary logs(Reference Nightingale, Williams and Thompson52). We have previously found that using 3-d dietary logs is as reasonable as 5-d dietary logs when estimating TEI and macronutrients in persons with SCI(Reference Gorgey, Caudill and Sistrun13). Therefore, measuring TEI in persons with SCI appears to induce considerable variation that may have influenced the outcomes of the current trial.
Metabolic profiles have been examined between groups. Fasting insulin was 2× lower in the negative energy group compared with the positive energy group. The negative energy group is characterised by heavier body weight, greater abdominal circumferences (data not shown) and larger leg lean mass compared with the positive energy group. The dissociation between markers of central obesity and hyperinsulinemia may be explained by the fact that both groups have circumferential measurements below or within previously established cut-offs(Reference Sumrell, Nightingale and McCauley26,Reference Gill, Sumrell and Sima27) . Circumferential cut-offs were previously established to distinguish those who are at risk of developing obesity and cardiometabolic disorders after SCI(Reference Gill, Sumrell and Sima27). However, the negative group had lower caloric intake and larger leg lean mass, which may have masked the risk of developing hyperinsulinemia independent of visceral adiposity after SCI(Reference Sumrell, Nightingale and McCauley26,Reference Gill, Sumrell and Sima27) . Hyperinsulinemia is an independent risk factor of cardiometabolic disorders after SCI and in other clinical populations(Reference Nash, Groah and Gater10,Reference Nash and Gater11,Reference Gater, Farkas and Dolbow28) . The results may shed light on the significance of monitoring TEI and providing rehabilitation regimens that are likely to evoke lower extremity muscle hypertrophy in persons with SCI(Reference Farkas, Sneij and McMillan12,Reference Gorgey, Khalil and Gill24,Reference Gorgey, Khalil and Carter25,Reference Bigford, Mendez and Betancourt38,Reference Perreault, Geigle and Gorman39) .
Limitations
The primary limitation is the small number of participants enrolled in the current trial. SCI is a heterogeneous population with wide physical and injury characteristics that may influence the outcomes of findings. As mentioned, participants were enrolled in two separate clinical trials, and the instructions provided by the dietitian may have influenced their caloric intakes or percentage macronutrients(Reference Gorgey, Khalil and Gill24,Reference Gorgey, Khalil and Carter25) . Therefore, future trials may consider a non-convenient community-based sample to verify the findings of the current trial.
The current cross-sectional design is unlikely to assume causality, and a longitudinal trial with a longer follow-up is highly warranted to understand the dispersed energy balance in this population. Dietary habits and meal frequencies are not well studied in persons with SCI. Furthermore, reliance on fast-food v. home-based meals may have influenced the outcomes of the current trial. Koutrakis et al. examined 174 community-based participants and noted that level and completeness of SCI, time since injury, mobility, percentage total body fat, and other co-morbid diseases were not associated with plasma 25(OH)D(Reference Koutrakis, Goldstein and Walia53). We also noted that in forty-eight persons with SCI, 97 % failed to achieve the required daily allowance for vitamin D, which may suggest the need to make dietary coaching by a registered dietitian throughout the life span of the persons with SCI(Reference Dora, Khalil and Adler23). Failure to control these factors may have confounded the outcomes of the current trial. Finally, we have intentionally excluded females from analysis because of the effect of gender differences on body composition and metabolic profile following SCI(Reference Gorgey, Farkas and Dolbow54).
Conclusions
Based on the difference between TEE and estimated TEI, persons with SCI may be classified into either negative or positive energy surplus groups. Those in the negative energy group tended to have higher body weight with greater consumption in percentage macronutrients of protein, as well as lower fasting insulin. The findings may indicate that greater protein intake may reduce the total caloric intake relative to total energy expenditure. Unlike other macronutrients, the percentage macronutrient of protein appears to influence the variance in energy surplus. Additionally, TEI adjusted to FFM is considered the best predictor for manipulating energy surplus after SCI. Collectively, the findings may underscore the widespread variability in energy spectrum among persons with SCI and provide healthcare specialists with clinical implications for tailoring dietary programmes in this population.
Acknowledgements
We would like to thank all SCI participants who contributed their time and effort to complete the current work. The material is the result of work supported with the resources and use of facilities at Central Virginia VA Medical Center located in Richmond, VA, USA. The contents of this study do not represent the views of the US Department of Veterans Affairs or the US Government.
The work is supported by the Department of Veteran Affairs, Veteran Health Administration, Rehabilitation Research and Development Service (B7867-W) and Department of Defense-Congressionally Directed Medical Research Programs (W81XWH-14-Spinal Cord Injury Research Program - Clinical Trial Award) to (A. S. G.).
Both authors contributed significantly to the work. A. S. G.: Secured Funding, Data Collection and Analysis, Manuscript Drafting, Editing and Revising; R. E. K.: Recruitment, Data Collection, Data Management and Organization.
Both authors have no conflicts of interest regarding the current work.