I. INTRODUCTION
The fracture properties of silicon are crucial in determining the manufacturing yield, device performance, and operational reliability of photovoltaic solar cells, very large scale integrated circuits, and microelectromechanical systems. Since it is well known that impurities (metallic and light element), structural defects, crystal orientation, and residual stresses all affect the mechanical properties of single- and multicrystalline silicon,Reference Yonenaga and Sumino1–Reference Ge, Minor, Stach and Morris4 achieving control of silicon fracture will ultimately depend on our fundamental understanding of the role of extended defect/impurity interactions and intragrain versus grain boundary (GB) sources of mechanical failure. Unfortunately, generally available multicrystalline silicon wafers consist of several microstructural factors which can impact the mechanical behavior of silicon wafers, e.g., grain orientation, nature of GB, intragrain defects (dislocations, inclusions, precipitates, etc.), and their interaction with impurities. For instance, the mechanical strength of silicon is impacted by the density of mobile dislocations, while immobilization or retardation of dislocation motion by the controlled introduction of light element impurities N or O has been shown to improve the strength and hardness significantly.Reference Spitznagel, Seidensticker, Lien, Hopkins, Mikkelsen, Pearton, Corbett and Pennycook2, Reference Shimura and Hockett3, Reference Sumino, Yonenaga, Imai and Abe5–Reference Murphy, Giannattasio, Alpass, Senkader, Falster and Wilshaw7 However, to fully understand the strength and breakage behavior (crack initiation/propagation) of multicrystalline silicon, it is critically important to independently quantify the influence of each factor mentioned above. Recently, the direct silicon bonded (DSB) wafer with hybrid orientation technology (HOT) has been recognized as a promising substrate for future complementary metal–oxide–semiconductor circuit due to the dependence of carrier mobility on the silicon orientation.Reference Yang, Chan, Chan, Shi, Fried, Stathis, Chou, Gusev, Ott, Burns, Fischetti and Ieong8 The (110)/(001) interface in DSB wafer is essentially a large-angle GB. It contains defects such as dangling bonds and dislocations, which act as an interesting gettering center for impurities. Therefore, from the viewpoint of defect engineering, the DSB wafer can be considered as an excellent model for the dependence of mechanical properties on grain boundaries, grain orientation, and impurities.
In addition, a primary factor impacting the failure of silicon wafers is the formation and movement of microcracks which develop during crystal growth and processing. Most strength-degrading cracks in silicon devices are surface localized and caused by saw damage, sharp particle contact from handling pins, debris generated during dicing, or localized packaging contacts. Hence to optimize the performance and maintain the appropriate electrical or electromechanical reliability of silicon devices, an understanding of the contact fracture process is required. Nanoindentation is a technique developed over the last two decades for probing the mechanical properties of materials at very small scales.Reference Pharr9 One of the great advantages of nanoindentation is that many mechanical properties, such as hardness, elastic modulus, and fracture toughness can be calculated from the indentation load, P, and indentation depth, h, (i.e., P–h curves) using the method of Oliver and PharrReference Oliver and Pharr10 or that of Doerner and Nix.Reference Doerner and Nix11 Another advantage of the nanoindentation technique is that measurements can be made on a thin film without having to remove the film from its substrate. Thereby, these advantages simplify specimen preparation and make measurements possible in systems which would otherwise be difficult to test. In this study, we present an elegant approach to understand and quantify the impact of grain boundaries and metallic elements on mechanical properties of silicon by examining DSB p-type (100) and (110) Si wafers containing a “model” GB interface, which is subsequently contaminated with Fe and Cu impurities.
II. EXPERIMENTAL
The 300-mm p-type DSB sample was formed by direct bonding of (110) and (001) Czochralski (CZ) silicon wafers. The boron concentration is 1 × 10¹⁵/cm3. After thinning the upper (110) wafer to 200 nm thickness by chemical mechanical polishing, the oxygen content at the (110)/(001) interface was intentionally out-diffused by a high-temperature preannealing, which was clarified to be below the detection limit of the secondary ion mass spectroscopy (SIMS) technique. These annealed samples will be denoted hereafter as clean wafer samples. Since Fe and Cu are among the most prominent metal impurities in mc-silicon, 1 × 1 cm pieces of this clean HOT wafer were contaminated with either Fe or Cu. After dipping in a Cu-spiked nitric acid solution, the samples were subjected to isothermal annealing at 800 °C for 30 min in an argon ambient, allowing Cu to homogenously distribute in the samples. Then, the samples were quenched to room temperature in an oil bath. Fe contamination was achieved by dipping in an Fe-spiked nitric acid solution and then annealing at 1100 °C in argon atmosphere. The annealed samples were either immediately quenched in an oil bath to room temperature or held for 30 min at 1100 °C before quenching. The concentration profiles of Cu and Fe were determined by SIMS method using an ion microprobe Cameca IMS 6F instrument (Cameca, Gennevilliers Cedex, France). High-resolution transmission electron microscopy (HRTEM) specimens were prepared using the focused ion beam technique. Cross-section and plan-view imaging of the specimens’ GB was examined in a JEOL 2010 TEM (JEOL Ltd., Tokyo, Japan) operated at 200 kV.
Nanoindentations were carried out on the clean, Fe-, and Cu-contaminated DSB wafers using a Hysitron TriboIndenter (Hysitron, Minneapolis, MN) with a three-sided 50 nm radius pyramidal Berkovich tip. Loads were varied from 100 to 8000 μN with constant loading/unloading rates of 250 μN/s. At least eight measurements were made for each load to check reproducibility of the data.
III. RESULTS AND DISCUSSION
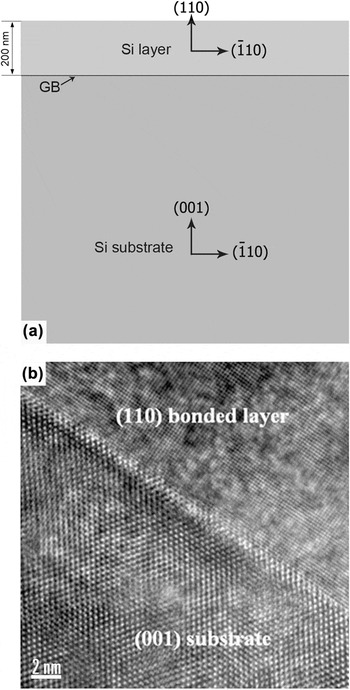
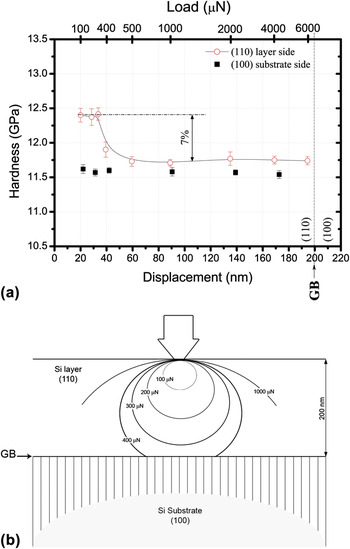
Figures 1(a) and 1(b) show a schematic and cross-sectional HRTEM image of the clean DSB wafer’s near-surface GB interface, respectively. The sample basically consists of a (100) Si substrate (∼900 μm thick) and a 200-nm-thick (110) capping layer whose bonded interfacial GB is very clean and reveals no interfacial oxide layer or oxide precipitates. Although many researchers have examined the effect of impurities on the mechanical properties of silicon using bending,Reference Sumino, Yonenaga, Imai and Abe5, Reference Hu and Patrick6 fracture toughness,Reference Chasiotis, Cho and Jonnalagadda12 and indentation tests,Reference Lawn, Marshall, Anstis and Dabbs13, Reference Lawn and Wilshaw14 application of highly localized contact loads with nanometer scale precision offers a unique means for evaluating the initial stages of deformation and fracture in small volumes of materials.Reference Pharr9, Reference Oliver and Pharr15–Reference Rozgonyi, Lu, Wagener, Yu, Park and Youssef17 To examine the effect of the clean GB interface on the mechanical properties, nanoindentation tests were performed on the plan view of the (110) cap layer of the clean wafer at different loads. Figure 2(a) shows the variation of hardness obtained from nanoindentation tests through the (110) layer as a function of the nanoindentation load (P) and the corresponding displacement (h) in the clean DSB wafer. It can be seen that, with increasing the indentation load from 100 to 300 μN, the penetration depth of the Berkovich tip gradually increases from 19 to 32 nm, respectively, without significant change in the hardness. The average hardness within that range of these loads is 12.45 ± 0.2 GPa, which is consistent with the expected hardness value for (110) oriented Si.Reference Ebrahimi and Kalwani18 Abrupt drop in hardness (7%) occurs after increasing the indentation beyond 300 μN and then reaches a steady state as the indentation load increases, see Fig. 2(a). The hardness profile in Fig. 2(a) demonstrates how the buried interfacial GB and associated orientation change affect the mechanical properties. Reviewing the nanoindentation loading process, we note that at low loads the contact surface deforms elastically as the indenter penetrates the sample; however, when the load reaches a critical value for which the maximum shear stress below the surface exceeds the critical shear stress of silicon, a small volume below the contact region deforms plastically, as shown schematically in Fig. 2(b). In general, the amount of excessive free volume generated during indentation increases with an increase in the indentation load,Reference Lawn and Swain19–Reference Chen and Bull21 see Fig. 2(b). The size of the plastic zone will be affected by the strength of the sample and the restriction from any obstacle, such as a GB, defects, internal strains, etc. At low load values [<300 μN, as in Fig. 2(a)], the size of the plastic zone is too small to be affected by the GB interface and the hardness values reflect the strength expected for a (110) Si. On further increasing indentation load from 300 to 8000 μN, indenter displacement gradually increases from 32 nm to ∼200 nm, respectively, with the plastically deformed region extending from the surface to the (110)/(100) GB interface, see Fig. 2(b). Therefore the drop in hardness shown in Fig. 2(a) can be attributed to the influence of the GB interface and the orientation variation between the bonded layer and substrate.
(a) a cross-section schematic representation of a direct silicon bonded (DSB) wafer, (b) a high-resolution transmission electron microscopy (HRTEM) image showing oxygen-free interface between bonded (110) layer and (001) substrate.

(a) Variation of the hardness as a function of the displacement and the corresponding load during indentation of the clean DSB wafer; (b) contours of the deformation zone at different nanoindentation loads across the sample.

Studies on micro-Reference Lawn and Wilshaw14 and nano-indentationReference Oliver and Pharr15 of brittle materials show a gradual drop of hardness with increasing indentation load, which has been attributed to the introduction of surface cracks. To determine whether the sudden drop in hardness of the clean wafer arises from formation of cracks or a contribution from the interface stress gradients and the orientation variation between the bonded layer and substrate, the (100) substrate side (900 μm thick) of the wafer was indented at different nanoindentation loads. As can be seen from the square-shaped data points in Fig. 2(a), no hardness variation was observed in the (100) substrate with increasing the load from 100 to 6000 μN. This behavior confirms that the drop in hardness for the (110) layer with increasing load is related to the differences in orientation and the restriction placed by the bonded GB interface on the plastic deformation zone under the indenter. Figure 2(a) also shows that the hardness from the (110) layer side is higher than obtained by indenting the (100) oriented backside of the sample. This is another evidence of the contribution of GB interface and the different orientation on the Si hardness. Ebrahimi and KalwaniReference Ebrahimi and Kalwani18 reported higher hardness and fracture toughness for single-crystal (110) Si than that for a (100) Si sample, which is consistent with our results in Fig. 2(a).
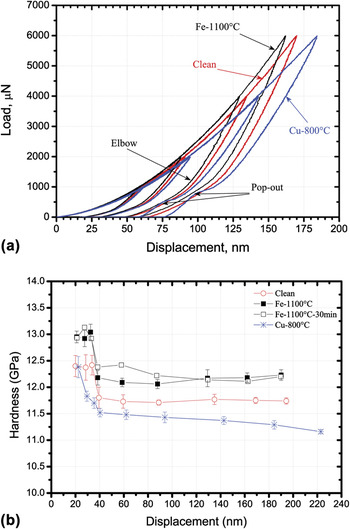
Figure 3(a) shows the influence of metallic impurities (Cu and Fe) on load–displacement curves. Note the consistency in measurements from the overlapping of the loading and unloading curves for different indentation loads. As can be seen from Fig. 3(a), the Fe-contaminated sample exhibits a reduced deformation (shift to lower displacement) compared to the clean sample curves for the same loads, which represents a lattice strengthening; however, a significant shift to higher displacement occurs for the Cu-contaminated sample, representative of a softening effect. It is worth to mention that all samples show an elbow shape during unloading, indicative of amorphous layer formation under the indentation tip.Reference Jang, Lance, Wen, Tsui and Pharr22 In addition, the Cu curves show discontinuities during unloading called “pop-outs,” see Fig. 3(a), which are never observed in the clean or Fe-contaminated samples. It is well reported that the pop-out feature is attributed to a transformation of the diamond cubic Si crystal structure to other metastable crystalline forms, e.g., Si-XII/Si-III crystalline phases.Reference Jang, Lance, Wen, Tsui and Pharr22, Reference Domnich, Gogotsi and Dub23 Jang et al.Reference Jang, Lance, Wen, Tsui and Pharr22 observed pop-out in Si and suggested that the formation of these metastable phases is enhanced by using high loads (>10,000 μN) and/or using sharp indenters, such as a cube corner indenter. Since pop-outs were observed only in Cu-contaminated samples at relatively low loads (4000 and 6000 μN), this finding introduces a new factor, namely, impurity type and perhaps concentration to induce the metastable phase transformation during nanoindentation. Experiments examining the effect of impurity type/concentration on the formation of metastable phases are currently underway.
(a) Load–displacement curves in clean, Fe-, and Cu-contaminated Si samples, (b) Variation of the hardness with increasing loads during nanoindentation of clean, Fe-, and Cu-contaminated samples.

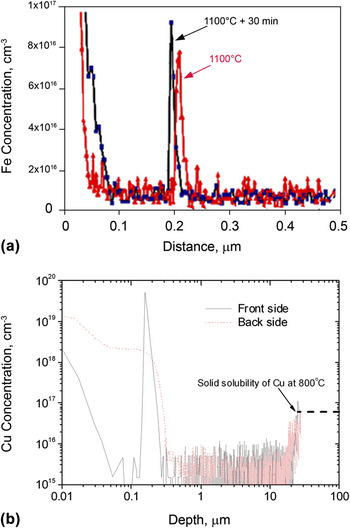
Variation of the hardness with increasing loads during nanoindentation is presented in Fig. 3(b), where all data exhibit a change at 30–40 nm as deformation volume senses the underlying interface between the (110) and (100) orientations. Fe-contaminated samples show consistently higher hardness values (average ∼7%) than that of the clean wafer at all loads used. The consistency of this trend is likely related to the GB gettering of Fe, which has been confirmed by the SIMS profiles in Fig. 4(a) that clearly shows a 20–30 nm wide Fe concentration peak across the (110)/(100) interface. The Fe distribution in and across the GB interface causes solid solution strengthening and probably precipitation hardening, which results in higher hardness than that of the clean wafer, see Fig. 3(b). We could not observe Fe precipitates in the transmission electron microscopy (TEM) analysis of the Fe-contaminated samples, which could be related to the lower Fe concentration than that of the Cu-contaminated samples.
Secondary ion mass spectroscopy data for Fe- and Cu-contaminated samples.

A significant drop in the hardness below that of the clean samples as a function of the indentation load was observed in the Cu-contaminated samples, see Fig. 3(b). It is also noticed from Fig. 3(b) that the hardness drop suddenly occurs in both the clean and Fe-contaminated samples, which can be attributed to the GB interface effect. However, in case of Cu, a steep gradual hardness drop was observed till the influence of GB interface was introduced (40 nm) and then the hardness decreases gradually with increasing the indentation load. The difference between the hardness behavior in the case of Fe and Cu can be plausibly explained by their distribution and concentration in the (110) cap layer near the surface and at the GB interface. The Cu depth profiles measured by SIMS technique from the front and back sides of the sample quenched from 800 °C are shown in Fig. 4(b). Note that a significantly high Cu SIMS signal appears at the (110)/(001) interface, which is much larger than that at the front surface. This indicates that the (110)/(001) interface in the DSB wafer can effectively getter the Cu impurities during quench cooling. It is well known that after introduced into the sample by isothermal annealing, Cu impurities will diffuse out during the sequent cooling. From Fig. 4(b), it can be seen that the Cu impurities in the near-surface region up to 20 μm have diffused toward the surface during quenching from 800 °C, while the Cu in the deeper region keeps at its solubility determined by the isothermal annealing temperature, about 6 × 10¹⁶/cm3. The out-diffused Cu can be gettered by the sample surface or the (110)/(001) interface. In the case of sample backside, since the surface is the unique gettering center, all the diffused Cu atoms have been gettered at the surface, see Fig. 4(b). These gettered Cu impurities should have formed precipitates, and the surface dangling bonds should be responsible for the nucleation of Cu precipitates.Reference Weber24, Reference Seibt, Griess, Istratov, Hedemann, Sattler and Schroter25 Therefore, the relatively high concentration of Cu near the surface may result in the steep gradual drop in hardness shown in Fig. 3(b).
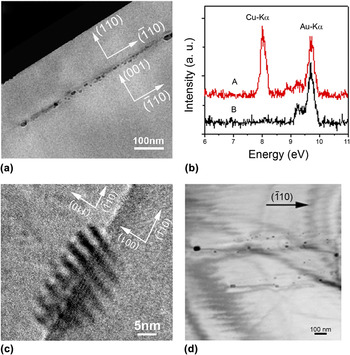
Figures 5(a) and 5(b) show the cross-sectional TEM micrograph of the 800 °C annealed sample and the energy dispersive x-ray (EDX) spectra obtained at different positions. The Cu impurities precipitate preferentially along the interface plane, without any noticeable extension into the adjacent silicon. This is not like the behavior of Cu precipitating in silicon bulk, where they are usually extended in different planes.Reference Seibt, Griess, Istratov, Hedemann, Sattler and Schroter25–Reference Xi, Yang, Chen, Xu, Ji, Que and Moeller28 The Cu precipitates (with typical sizes range from 5 to 20 nm) at the (110)/(001) interface tend to exist as groups, suggesting the colony-like precipitates have formed, see Fig. 5(a). All the precipitates grow up with their long axis in the  direction. A HRTEM image of one precipitate at the interface showing moiré fringes due to the lattice mismatch between the precipitate and silicon lattice is displayed in Fig. 5(c). The moiré fringes have a spacing of about 3.5 nm, resulting from the interference between the periodicity of the host lattice and the periodicity of the precipitates. This indicates that the interfacial Cu precipitates are single crystals that have a body-centered cubic structure with a lattice parameter close to silicon. The fringes are not exactly perpendicular to the g-vector
 in the present case and have a deviation of about 10°. It is obviously a result of strong strain field existing around the precipitate. Figure 5(d) shows a plan-view TEM micrograph of Cu precipitates at the (110)/(001) interface. It can be seen that these precipitates certainly form colonies. The colony formation must be based on the generation of dislocation loops,Reference Dash26, Reference Gottschalk27 even though no loops can be clearly seen in present case due to the disturbing of moiré fringes caused by lattice difference between (110) and (001) silicon. Domnich et al.Reference Seibt, Griess, Istratov, Hedemann, Sattler and Schroter25 reported that when Cu diffused into silicon at high temperatures, it is mainly dissolved on interstitial sites and predominately precipitates during quenching from high temperatures. In addition, our observations from Fig. 5 are in agreement with previous studies,Reference Weber24–Reference Gottschalk27 which stated that Cu precipitates consist of planar arrangements of spherical Cu silicides bounded by extrinsic dislocation loops. Colony growth is usually observed in the presence of extended defects like grain boundaries,Reference Broniatowski and Haut29 dislocations,Reference Dash26, Reference Gottschalk27 or stacking faultsReference Seibt30 but also in the state-of-the-art silicon materials which are initially dislocation-free, as in our case. These dislocations are responsible for enhancing the deformation process during loading. In addition, several investigatorsReference Weber24, Reference Dash26, Reference Gottschalk27 have shown that the growth of copper precipitate colonies in bulk silicon is strongly correlated with the formation of dislocations that can enhance local deformation via a dislocation climb motion process. Furthermore, DashReference Dash26 and Gottschalk,Reference Gottschalk27 using infrared light microscopy and TEM, reported that decorated glide dislocations exist around Cu precipitates in plastically deformed silicon. Accordingly, we believe that the low hardness values of Cu-contaminated samples, see Fig. 3(b), are due to the dislocation loops formed around Cu precipitates. These dislocation loops facilitate the deformation process during nanoindentation and therefore soften the material.
Transmission electron microscopy (TEM) micrographs and energy dispersive x-ray (EDX) spectra measured of the Cu-contaminated sample quenched from 800 °C: (a) a cross-sectional TEM micrograph; (b) the EDX spectra at different positions as described in (a); (c) a HRTEM image of one Cu precipitate at the (110)/(001) interface; (d) a plan-view TEM micrograph.

IV. CONCLUSION
In summary, our utilization of nanoindentation of a unique (110)/(100) GB, intentionally constructed close to and parallel with the sample surface via DSB allows for better understanding of the effect of crystallographic orientation and impurity contamination (Fe and Cu) on the mechanical behavior of silicon. The (110) orientation of silicon shows higher hardness (12.45 GPa) than that for (100). Fe contamination strengthens the Si, while Cu contamination introduces dislocations that facilitate the deformation process and soften the Si. We expect that these exact evaluations of the contribution of metallic impurities and known orientation will provide unique insights into developing a unified model describing the overall mechanical behavior of multicrystalline silicon.
ACKNOWLEDGMENTS
The authors would like to thank Mike Seacrist of MEMC Electronic Materials, Inc. for providing the DSB wafers. Financial support by the National Science Foundation and Silicon Solar Consortium is gratefully acknowledged.