





Sex steroid hormones, including androgens and oestrogens, are cholesterol derivatives that play key roles in regulating reproductive and non-reproductive characteristics. Testosterone is the principal androgen produced by Leydig cells in the testes and circulates primarily bound to sex hormone-binding globulin and albumin, with only a small fraction present in its biologically active free form(Reference Hammond and Bocchinfuso1). Testosterone is associated with sexual function, cardiovascular function and increased lean mass, muscle strength, bone density, work performance, concentration and sleep quality in men(Reference Kaur and Werstuck2–Reference Barrett-Connor, Dam and Stone4). Men experience a gradual decline in Testosterone levels with increasing age, known as andropause, which is accompanied by a relative increase in estradiol due to increased aromatase activity in adipose tissue(Reference Mauvais-Jarvis and Lindsey5).
This testosterone–estradiol interplay influences a wide range of physiological processes, including muscle mass maintenance, bone health, metabolism, cardiovascular function, brain health and prostate biology(Reference Kawano6–Reference Cooke, Nanjappa and Ko8). For example, testosterone promotes lean muscle mass and fat metabolism, while estradiol influences fat storage, particularly in subcutaneous and visceral areas. Men with lower testosterone and higher estradiol levels often exhibit increased central obesity and insulin resistance, elevating their risk for metabolic syndrome and type 2 diabetes(Reference Cheung, Luk and So9). In bone health, estradiol plays a crucial role in regulating bone density in men. Low estradiol levels, often due to decreased testosterone and reduced aromatisation, increase the risk of osteoporosis and fractures, underscoring the importance of estradiol in male skeletal health(Reference Finkelstein, Lee and Burnett-Bowie10). In the prostate, the testosterone–estradiol hormonal balance plays a key role in both benign prostatic hyperplasia and prostate cancer development. Understanding these dynamic interactions may help refine prevention and treatment strategies, particularly for aging men at risk of hormonal imbalances and diseases of the prostate(Reference Prins and Korach11,Reference Nicholson and Ricke12) .
Beyond individual nutrients, dietary pattern approaches may better capture the combined effects of foods consumed together. Among apparently healthy men, studies evaluating multiple dietary patterns have reported inconsistent associations with circulating sex steroid hormones(Reference Fung, Hu and Barbieri13–Reference Lopez, Liu and Smith-Warner16). Studies among healthy men found that a low-fibre, high-fat diet was marginally associated with elevated testosterone levels(Reference Nyante, Graubard and Li14) and significantly associated with lower mean urinary concentrations of estradiol(Reference Dorgan, Judd and Longcope15). Moreover, an analysis of data among men showed that sex hormone-binding globulin concentrations were higher and testosterone levels lower, with greater intake of a prudent diet among obese men. The prudent dietary pattern is characterised by higher intakes of fruits, cruciferous vegetables, legumes, fish and whole grains, identified by principal component analysis(Reference Lopez, Liu and Smith-Warner16). Collectively, findings from these three studies have been inconsistent, with reported associations varying according to the dietary pattern examined and the specific sex steroid hormone measured. Because humans consume combinations of foods rather than isolated nutrients, dietary pattern analyses may better capture the complex dietary exposures that influence endocrine regulation. Dietary patterns that capture the inflammatory and insulinaemic potential of habitual diet may be particularly relevant because chronic inflammation, insulin resistance and sex steroid metabolism are closely interconnected. The Empirical Dietary Inflammatory Pattern (EDIP) and Empirical Dietary Index for Hyperinsulinaemia (EDIH) have been associated with insulin resistance(Reference Shi, Aroke and Jin17), type 2 diabetes(Reference Lee, Li and Li18–Reference Jin, Shi and Aroke20) and multiple diseases(Reference Wang, Song and Eliassen21), yet their relationships with circulating sex steroid hormones have not been investigated.
Our study objective was to examine these dietary patterns in relation to concentrations of sex steroids in individual-level analyses, using the Healthy Eating Index (HEI)-2020 as a benchmark measure of overall dietary quality. Because previous findings have been inconsistent, we performed a systematic literature review to summarise findings on this association in observational and clinical trial studies to inform the development of relevant research hypotheses that may be tested in future dietary pattern intervention studies.
Methods
Methods for individual-level analyses in the osteoporotic fractures in men cohort
Study population
Data were obtained from the Osteoporotic Fractures in Men (MrOS) cohort, a multicentre observational study designed to identify risk factors for fractures in older men(Reference Orwoll, Blank and Barrett-Connor22). A total of 5994 men aged 65 and older from six USA locations: Birmingham, AL; Minneapolis, MN; Palo Alto, CA; the Monongahela Valley near Pittsburgh, PA; Portland, OR and San Diego, CA were enrolled between March 2000 and April 2002(Reference Blank, Cawthon and Carrion-Petersen23). The study received approval from the institutional review board at each site, and all participants provided written informed consent. Data from a total of 1622 men included for analysis after excluding men with missing dietary data or biomarker outcomes data, extreme BMI (<15 or >50 kg/m2), implausible energy intake (<600 or >5000 Kcal/day), the equivalent of <2510 or >20920 KJ/day, baseline cancer, androgen or anti-androgen use, testosterone injections or history of testicular surgery (eFigure 1).
Dietary assessment and computation of dietary scores
At the baseline visit (Visit 1), participants reported their dietary intake over the previous year using the Block 98·2 FFQ, a condensed version of the Block 98 FFQ tailored specifically for the MrOS study. This FFQ was developed using NHANES III data to focus on foods commonly consumed by men with similar demographic characteristics to capture key nutrients relevant to osteoporosis and prostate cancer risk. The questionnaire comprised sixty-nine questions about individual food items, fourteen questions about nutrient supplement use and thirteen questions about food preparation and low-fat options(Reference Rogers, Harrison and Judd24–Reference Shikany, Demmer and Johnson26). This modified FFQ was not independently validated, but it closely aligns with other shortened versions developed by the Block group that have been validated(Reference Block, Hartman and Naughton27). Participants selected one of nine frequency categories and one of four portion size options for each food or beverage item using graphical aids to assist in estimating portion sizes accurately(Reference Langsetmo, Shikany and Burghardt28). The Block Dietary Data Systems (Nutrition Quest) was used to analyse the FFQ(Reference Shannon, Shikany and Barrett-Connor25).
The development and validation of the EDIP and EDIH scores have been described(Reference Tabung, Smith-Warner and Chavarro29,Reference Tabung, Wang and Fung30) . Briefly, for EDIP, thirty-nine predefined food groups were incorporated into reduced-rank regression models, followed by stepwise linear regression analyses, to determine dietary patterns most predictive of plasma markers of inflammation including C-reactive protein, IL-6 and TNF-α receptor 2 (TNF-α-R2). The EDIP score is calculated as a weighted sum of eighteen food groups, with higher scores indicating a more pro-inflammatory diet. Similarly, for EDIH, stepwise regression identified a dietary pattern most predictive of plasma C-peptide levels, based on thirty-nine food groups in the initial list. The EDIH score, like EDIP, represents a weighted sum of eighteen food groups, with higher scores indicating a more hyperinsulinemic diet. Nine of the eighteen food groups overlapped between EDIP and EDIH, with each score also including nine unique food groups(Reference Tabung, Smith-Warner and Chavarro29,Reference Tabung, Wang and Fung30) .
The HEI-2020 is a thirteen food and nutrient component index that was designed to assess adherence to the Dietary Guidelines for Americans(31). HEI-2020 scores were derived using dietary intake data from the FFQ, with ten of the thirteen food components converted into cup or ounce equivalents and adjusted to reflect intake per 1000 kcal. The three remaining food components are assessed as either a percentage of total energy intake (added sugars and saturated fats) or as the ratio of PUFA and MUFA to SFA(Reference Krebs-Smith, Pannucci and Subar32). HEI-2020 total score ranges from 0 to 100, with higher scores reflecting higher adherence to the Dietary Guidelines for Americans. Therefore, for clearer interpretation, we reversed the EDIP and EDIH scores, labeling them as reversed Empirical Dietary Inflammatory Pattern (rEDIP) and reversed Empirical Dietary Index for Hyperinsulinemia (rEDIH), such that higher scores are indicative of more anti-inflammatory or lower insulinaemic dietary patterns.
Laboratory assessment of sex steroid hormones
Biomarker outcomes included circulating concentrations of testosterone (T), free T, sex hormone-binding globulin (SHBG), estradiol (E2), free E2 and free T/ free E2 ratio. Total serum T and E2 concentrations were determined using a gas chromatography/mass spectrometry assay (Taylor Technology)(Reference Cawthon, Ensrud and Laughlin33,Reference Vandenput, Mellström and Laughlin34) . A combined gas chromatographic negative ionisation tandem mass spectrometry (GC/NCI/MS/MS) and liquid chromatographic electrospray tandem mass spectrometry (LC/ESI/MS/MS) bioanalytical method was utilised to measure the biomarker concentrations in serum. Duplicate aliquots from each participant’s serum were assayed, and the results were averaged. The detection limit for T was 2·50 to 320 ng/dl; intra-assay coefficient of variation (CV) 2·5 % and inter-assay CV, 6·0 %. The detection limit for E2 was 0·625 to 80 pg/ml; intra-assay CV, 6·4 % and inter-assay CV 10·1 %. SHBG concentrations were determined using an Immulite Analyzer with a chemiluminescent substrate (Diagnostic Products Corp.). SHBG samples were not assayed in duplicate. The standard curve ranged 0·2–180 nm/l, and the intra-assay and inter-assay CV were 4·6 % and 5·8 %, respectively(Reference Cawthon, Ensrud and Laughlin33,Reference Vandenput, Mellström and Laughlin34) . The method described by Södergård was employed to calculate the free and bioavailable fractions of T and E2(Reference Södergard, Bäckström and Shanbhag35).
Covariate assessment
Covariates were measured using self-administered baseline questionnaires. We adjusted for the following potential confounding factors including age (continuous), race/ethnicity (White, Black/African American, Asian, Hispanic and others), physical activity (continuous), smoking status (never, past, current), marital status (married, widowed, separated/divorced or single/never married), education levels (less than high school, high school, college and higher), pack-years of smoking (continuous), family history of prostate cancer (yes v. no), number of nutritional supplements used (continuous), total alcohol intake (continuous), aspirin/other Non-Steroidal Anti-Inflammatory Drug (NSAID) use (yes v. no), BMI (continuous) and baseline comorbidity (continuous). These covariates were selected based on our previous and ongoing work on dietary patterns and circulating biomarkers(Reference Shi, Aroke and Jin36).
Statistical analyses
We examined the distribution of foods, nutrient intakes, demographic and lifestyle characteristics in quintiles of the dietary scores. Concentrations of T, free T, SHBG, E2, free E2 and the free T/free E2 ratio were log-transformed to improve normality prior to analyses. Spearman correlation analysis was used to evaluate the relationships among sex steroid hormones, age and BMI and the relationship between dietary scores. Mean concentrations of sex steroid hormones were assessed in categories of age (65–75 years and >75 years) and BMI (18·5 ≤ BMI < 25 and 25 ≤ BMI). Multivariable-adjusted linear regression analyses were used to estimate the relative difference (as a percent) in biomarker concentration per 1 standard deviation increment in the dietary score, adjusting for all the covariates listed above. Potential effect modification of the association between the dietary index score and biomarker levels by categories of BMI and race (White, Black/African American and Asian) was investigated by stratifying the linear regression models by levels of the potential effect modifier. The potential interaction between dietary score and continuous BMI was assessed using a Wald test. Additionally, multivariable-adjusted linear regression analysis was used to assess the joint association of dietary indices, categorised in tertiles and categories of BMI with sex steroid hormone biomarkers. All analyses were conducted using SAS version 9.4. All tests were two-sided. Statistical significance was defined as P < 0·05.
Methods for the systematic review of existing literature
Search strategy and registration
Published reports with the aim of studying the association of any dietary pattern and sex steroid hormones were included using comprehensive searches on PubMed and the NLM Gateway (for MEDLINE), Scopus and Institute of Scientific Information (ISI) electronic databases up to June 2024. The appropriate medical subject headings, Entry Terms and Emtree options were applied to carry out the most sensitive search operations. The search strategy was presented in Additional file 1: Appendix S1. A manual search was performed on Google Scholar database and the references listed in relevant reviews. This systematic review was registered with the Open Science Framework at osf.io/uvkw6.
Inclusion and exclusion criteria
Two reviewers (ZA and AEK) independently reviewed and screened the appropriate published papers based on title, abstract and full text. The third reviewer (FKT) resolved any discrepancy in choosing eligible records. All observational studies (cross-sectional, case–control or cohort) and clinical trials in humans were included in the review if they examined the association between dietary patterns and sex steroid hormones among apparently healthy men. Studies were eligible without restrictions on age group or year of publication (eFigure 2).
The papers with the following conditions were excluded: (1) duplicate publications (same study in multiple databases; (2) studies that included only single foods or single nutrients; (3) letters, abstracts, reviews, book or book chapter, editorials and study protocols; (4) in vivo (animal) studies; (5) non-English language studies; (6) case–control studies in which hormone assessment was not conducted exclusively in controls; (7) studies with repeated results and (8) studies with only female participants. The participants, intervention, comparators, outcomes, study design criteria and main findings are described in eTable 1.
Quality assessment
We assessed the quality of the studies using the Quality Assessment Tool for Quantitative Studies, modified from the Effective Public Health Practice Project(Reference Thomas, Ciliska and Dobbins37,Reference Armijo-Olivo, Stiles and Hagen38) . This tool, recommended by the Cochrane Collaboration, is suitable for both intervention and observational studies. Briefly, the tool evaluates study quality based on five criteria: (1) study design, (2) sample size, (3) confounders/randomisation, (4) data collection methods and (5) data analysis. For intervention studies, ratings for the six components were combined to provide an overall global rating of study quality. A score of 9 to 10 indicates high quality, 11 to 14 indicates moderate quality and 15 or above indicates low quality. For observational studies, scores of 10 to 11 were categorised as high quality, 12 to 15 as moderate quality and 16 or above as low quality(Reference Thomas, Ciliska and Dobbins37,Reference Armijo-Olivo, Stiles and Hagen38) .
Data extraction
Two coauthors (ZA and AEK) independently extracted the following information from each included study: first author; year of publication; study design; study population; country; age range/mean age; sample size; diet assessment tool; exposure variable (specific dietary patterns studied); outcome variable (specific biomarkers studied); outcome assessment methods; main results and covariates adjusted for. Any disagreements between the data abstractors were resolved by the third author (FKT).
Results
Results for the individual-level analyses in Osteoporotic Fractures in Men cohort
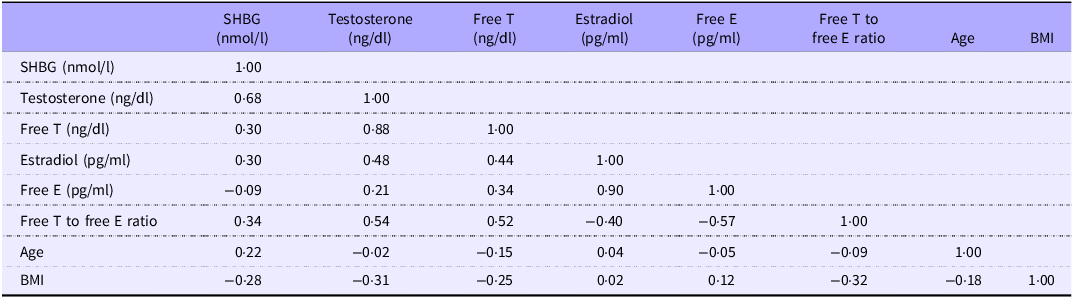
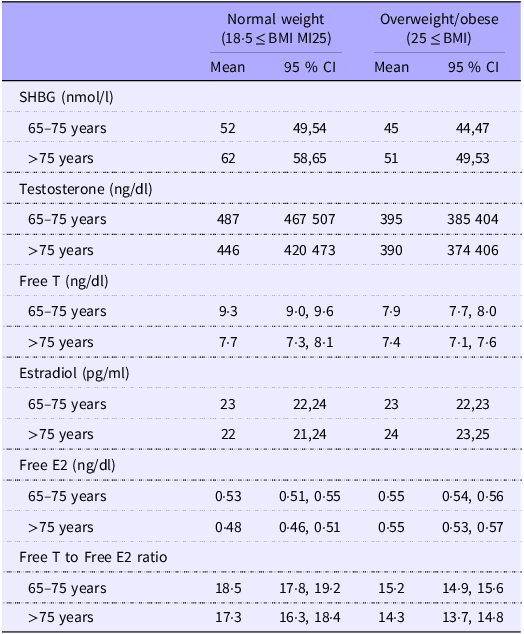
The individual-level analysis in MrOS included 1622 individuals with an average age of 73 years (sd = 6), of whom 70·8 % were White. Participants in the lowest quintile of dietary patterns (indicating the most hyperinsulinaemic, pro-inflammatory or lowest-quality diets) reported lower intake of fibre, carbohydrates, Ca, Mg, folate and vitamin D, and higher pack-years of smoking and Na intake, compared with those in the highest quintile of rEDIH, rEDIP and HEI-2020 (Table 1). BMI was inversely correlated with SHBG, T, free T, free T/free E2 ratio and age and positively correlated with free E2 (Table 2). Analysis of biomarker concentrations in subgroups jointly classified by BMI and age showed that T and free T levels were lower in men over 75 years compared with those aged 65–75, whereas SHBG concentrations were higher in the older age group. SHBG, T and free T concentrations were lower among men who were overweight/obese compared with those with normal weight (Table 3). In addition, rEDIH and rEDIP had a strong positive correlation of 0·76, but both dietary scores showed low correlations with HEI-2020 (0·15 for rEDIP and −0·03 for rEDIH).
Baseline characteristics of the study participants in quintiles of dietary indices in the MrOS cohort study

Table 1. Long description
The table presents baseline characteristics of study participants categorized by quintiles of dietary indices in the MrOS cohort study. It includes 1622 individuals with an average age of 73 years. The table is divided into columns representing different quintiles for Reverse Empirical Dietary Index for Hyperinsulinemia (rEDIH), Reverse Empirical Dietary Inflammatory Pattern (rEDIP), and Healthy Eating Index (HEI-2015). Each column provides data on various characteristics such as median dietary score, age, race, BMI, physical activity, smoking status, marital status, education level, and macronutrient intake. The table also includes specific values for each quintile, detailing the distribution of participants across different categories and their corresponding dietary and health metrics.
PASE, Physical Activity Score for the Elderly.
* rEDIH, rEDIP and HEI-2020 scores were adjusted for total energy intake using the residual method. Higher scores on all three indices indicate low-insulinaemic, low-inflammatory or higher dietary quality, respectively.
† Median HEI-2020 scores were not adjusted for total energy intake.
‡ Other race contains native Hawiian or other Pacific Islander, American Indian or Alaskan Native, multiracial and unknown race.
Spearman correlation coefficients between biomarkers

Table 2. Long description
A table with 10 rows and 9 columns displaying Spearman correlation coefficients between biomarkers. The columns are labeled SHBG (nmol/l), Testosterone (ng/dl), Free T (ng/dl), Estradiol (pg/ml), Free E (pg/ml), Free T to free E ratio, Age, BMI, and an empty column. The rows are labeled with the same biomarkers and Age and BMI. Each cell contains a correlation coefficient value. Row 1: SHBG (nmol/l), 1-00. Row 2: Testosterone (ng/dl), 0.68, 1-00. Row 3: Free T (ng/dl), 0.30, 0.88, 1-00. Row 4: Estradiol (pg/ml), 0.30, 0.48, 0.44, 1-00. Row 5: Free E (pg/ml), -0.09, 0.21, 0.34, 0.90, 1-00. Row 6: Free T to free E ratio, 0.34, 0.54, 0.52, -0.40, -0.57, 1-00. Row 7: Age, 0.22, -0.02, -0.15, 0.04, -0.05, -0.09, 1-00. Row 8: BMI, -0.28, -0.31, -0.25, 0.02, 0.12, -0.32, -0.18, 1-00.
SHBG, sex hormone-binding globulin.
Distribution of mean (95 % CI) concentrations of sex steroid hormones in categories of age and BMI

Table 3. Long description
The table presents the distribution of mean concentrations and 95 percent confidence intervals (CI) of sex steroid hormones, categorized by age groups (65-75 years and over 75 years) and BMI categories (normal weight and overweight/obese). The table includes data for SHBG (nmol/l), Testosterone (ng/dl), Free T (ng/dl), Estradiol (pg/ml), Free E2 (ng/dl), and Free T to Free E2 ratio. There are four rows and six columns, with the columns representing different hormone measurements and the rows representing different age and BMI categories. Notable trends include lower concentrations of SHBG, Testosterone, and Free T in the overweight/obese group compared to the normal weight group, and variations in hormone levels between the two age groups.
SHBG, sex hormone-binding globulin.
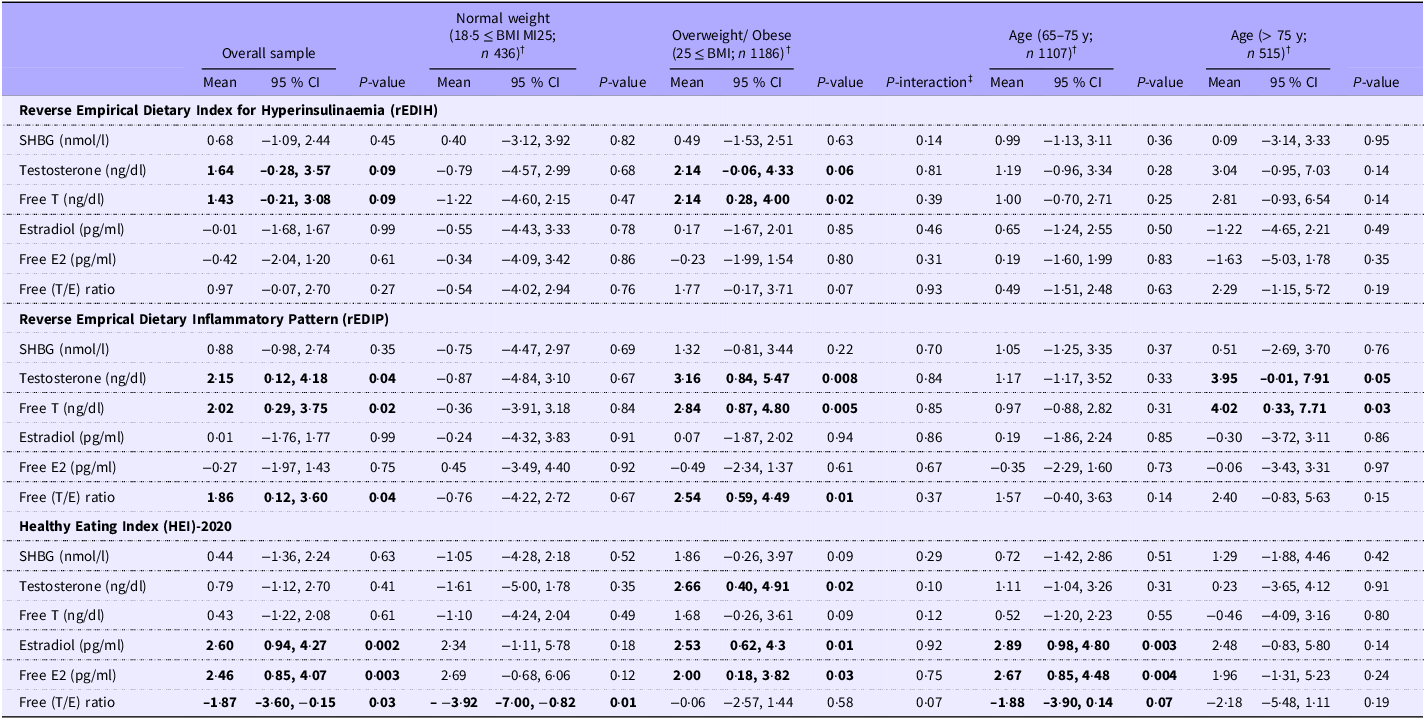
After adjusting for covariates, we found significant positive associations between higher anti-inflammatory dietary pattern (rEDIP) and both T (β = 2·15; 95 % CI: 0·12, 4·18; p = 0·04) and free T (β = 2·02; 95 % CI: 0·29, 3·75; p = 0·02). The low-insulinaemic dietary pattern (iEDIH) was (marginally) associated with higher total T (β = 1·64; 95 % CI: −0·28, 3·57; p = 0·09) and free T (β = 1·43; 95 % CI: −0·21, 3·08; p = 0·09). Higher HEI-2020 scores were linked to increased E2 (β = 2·60; 95 % CI: 0·94, 4·27; p = 0·002), free E2 (β = 2·46; 95 % CI: 0·85, 4·07; p = 0·003) and a lower free T/E2 ratio (β = −1·87; 95 % CI: −3·60, −0·15; p = 0·03) (Table 4). Subgroup analysis by BMI showed a positive association between rEDIH and free T (p = 0·02) in overweight/obese men, with significant associations between rEDIP and T, free T and the free T/E2 ratio (all p < 0·05) in this subgroup. Higher HEI-2020 was linked to higher T, E2 and free E2 (all p < 0·05) in overweight/obese men. Age subgroup analysis showed positive associations between HEI-2020, E2 and free E2, and an inverse association for the free T/E ratio in men aged 65–75 years (all p < 0·05). For men over 75, higher rEDIP was associated with greater T and free T (β = 4·02; 95 % CI 0·33, 7·71; p = 0·03) (Table 4).
Multivariable-adjusted associations of dietary pattern indices with circulating sex steroid hormones in the overall sample and in BMI categories *

Table 4. Long description
The table presents multivariable-adjusted associations of dietary pattern indices with circulating sex steroid hormones in the overall sample and in BMI categories. It has 12 rows and 18 columns. The columns are labeled as Overall sample, Normal weight (18.5 ≤ BMI < 25; n 436), Overweight/Obese (25 ≤ BMI; n 1186), Age (65–75 y; n 1107), and Age (> 75 y; n 515), each with Mean, 95% CI, and P-value sub-columns. The rows are labeled with different hormones and indices: SHBG, Testosterone, Free T, Estradiol, Free E2, and Free T/E ratio under Reverse Empirical Dietary Index for Hyperinsulinaemia (rEDIH), Reverse Empirical Dietary Inflammatory Pattern (rEDIP), and Healthy Eating Index (HEI)-2020. Each cell contains specific values for Mean, 95% CI, and P-value. Notable trends include significant associations between rEDIP and T, free T, and the free T/E ratio in overweight/obese men, and higher HEI-2020 scores linked to increased E2 and free E2 in the same group. Age subgroup analysis shows positive associations between HEI-2020, E2, and free E2, and an inverse association for the free T/E ratio in men aged 65–75 years. For men over 75, higher rEDIP is associated with greater T and free T.
SHBG, sex hormone-binding globulin.
* Values are biomarker concentrations obtained from multivariable-adjusted linear regression analyses, adjusting for the following variables: age (continuous), race/ethnicity (White, Black/African American, Asian, Hispanic, others), physical activity (continuous), smoking status (never, past, current), marital status, education levels, pack-years of smoking (continuous), family history of prostate cancer (yes v. no), number of nutritional supplements used (continuous), total alcohol intake (continuous, servings/day), aspirin/other NSAID use (yes v. no), BMI (continuous) and baseline comorbidity.
† Relative change (as a percent) in biomarker concentration per 1 standard deviation increment in the dietary score.
‡ Interaction between dietary scores and continuous BMI was assessed using a Wald test.
eTable 2 shows the joint associations of dietary index scores, assessed in tertiles and BMI with the biomarkers. Results were similar across the three dietary indices and appeared to be driven by BMI. Generally, overweight and obese men showed lower concentrations of SHBG, T, free T, lower free T/E2 ratio and higher E2, free E2. The trend of lower SHBG and T levels seemed to attenuate with higher adherence to rEDIP/rEDIH, but it remained significant. For HEI-2020, the trend of higher concentrations E2 became stronger with higher adherence to HEI-2020. eTable 3 presents the associations between dietary pattern indices and circulating sex steroid hormones in race categories. Findings among White men were reflective of the overall sample, while there were no significant associations in the other race groups except for lower free E2 (rEDIP) among Black men and lower free T/E2 ratio (HEI-2020) among Asian men.
Results for the systematic review of the existing literature (eTable 1)
The study selection process is described in the PRISMA flowchart as shown in eFigure 2. After applying the exclusions shown, twenty-one studies were included in the systematic review(Reference Lopez, Liu and Smith-Warner16,Reference Nassan, Jensen and Priskorn39–Reference Jurewicz, Radwan and Sobala58) , and four of them presented results that could be included in a meta-analysis(Reference Lopez, Liu and Smith-Warner16,Reference Chen, Pestoni and McGlynn42,Reference Zhang, Bian and Chen48,Reference Hu, Chen and Lin54) . However, the sample size of four was too small for meaningful meta-analysis of individual biomarkers. Based on the quality assessment tool, two studies were rated to be of high quality, thirteen as moderate quality and six as low quality. Study characteristics and detailed results for each study are presented in eTable 1. Twenty studies used a cross-sectional approach, and one was a clinical/feeding study(Reference Hill, Wynder and Garbaczewski43). Most studies (67 %) were conducted outside of the USA, with regional representation from Europe, Asia, Africa and Australia. The age range of participants was from 6 to 82 years, with two studies(Reference Qin, Liu and Liao40,Reference Ma, Li and Zhan52) including children (6–11 years) and adolescents (12–19 years), while all other studies included adults ≥18 years old. The studies had sample sizes ranging from 89 in the clinical study to 208 677 participants in the population-based studies. The population-based studies assessed dietary patterns using data from FFQ and 24-hour recalls, while the clinical study used 3-day food records for dietary assessments. Systematic review findings were further summarised in eFigure 3.
Eleven studies examined SHBG, and of these, five reported that higher intake of healthy dietary patterns including the alternative HEI, Dietary Approaches to Stop Hypertension (DASH), prudent and vegan or vegetarian dietary patterns were associated with higher levels of SHBG. Unhealthy patterns (n 4) including the Western dietary pattern, dietary inflammatory index, dietary acidic load and testosterone-related dietary pattern (a dietary pattern derived using reduced-rank regression to predict circulating testosterone concentrations), all sharing characteristics of being high in red/processed meat and processed carbohydrate-rich foods and low in fruits and vegetables, were not significantly associated with SHBG concentrations. The remaining two studies found no associations between dietary inflammatory index and SHBG in children and adolescents. Overall, healthier dietary patterns were generally associated with higher SHBG concentrations, whereas unhealthy dietary patterns showed little evidence of association with SHBG.
Of the twenty-one studies that investigated associations between dietary patterns and total T, ten studies reported either an increase in T levels with higher intake of healthy dietary patterns (n 4) or lower T with higher unhealthy patterns (n 6). Nine studies reported no association between any dietary pattern and T levels. Two studies reported results that were inconsistent with the trend of results for the same dietary patterns in other studies, showing lower T levels in vegetarians compared with omnivores(Reference Howie and Shultz55) or higher T levels with higher intake of the Western pattern in a study that also reported higher T levels with higher intake of a vegetarian-like dietary pattern(Reference Nassan, Jensen and Priskorn39). Eight of the twenty-one studies examined free T levels with mixed results. That is, five of the studies showed either no association between diet and free T, lower free T with higher unhealthy dietary pattern or higher free T with higher unhealthy dietary pattern(Reference Nassan, Jensen and Priskorn39,Reference Chen, Pestoni and McGlynn42,Reference Zhang, Bian and Chen48,Reference Key, Roe and Thorogood53,Reference Hu, Chen and Lin54) . The three remaining studies showed either higher total T with higher vegan, fish or poultry dietary patterns and lower free T in the same study(Reference Yeap, Marriott and Antonio49), no association between higher dietary acid load pattern and total T, but higher free T(Reference Storz and Ronco50), or no association between higher dietary inflammatory index and free T but lower total T(Reference Ma, Li and Zhan52). Taken in total, healthy dietary patterns were generally associated with higher total testosterone concentrations.
The association of dietary patterns and E2 was investigated in seventeen studies, with eleven showing no association between dietary patterns, healthy, unhealthy or traditional Namibian(Reference Christiansen44) and total E2 levels. Of the six studies reporting an association, three showed that higher intake of a Western dietary pattern or the traditional dietary pattern of Denmark(Reference Nassan, Jensen and Priskorn39) was associated with higher E2 levels(Reference Lopez, Liu and Smith-Warner16,Reference Ognjenovic, Ambrosini and Malacova56) . Consistent with these findings, one clinical study reported higher E2 levels among Black men consuming a traditional South African diet as compared with Black men consuming a Western diet(Reference Hill, Wynder and Garbaczewski43), with two cross-sectional studies reporting lower blood plasma E2 levels among vegetarians compared with omnivores(Reference Howie and Shultz55) and higher E2 excretion in the stool of vegetarians(Reference Pusateri, Roth and Ross51). Only one study examined free E2 levels and found that HEI was associated with lower free E2(Reference Chen, Pestoni and McGlynn42). Overall, healthy dietary patterns were associated with lower E2 and free E2 levels in men.
Discussion
We assessed the relationship between dietary patterns and sex steroid hormone concentrations in a cohort of older American men (MrOS) and through a comprehensive systematic review of the literature. In MrOS, higher adherence to an anti-inflammatory or low-insulinaemic dietary pattern was associated with increased T and free T levels, while higher adherence to the Dietary Guidelines for Americans, assessed using the HEI-2020, was associated with increased E2 and free E2 concentrations and a decrease in the free T/E2 ratio. Findings from the systematic review showed that higher intake of multiple healthy dietary patterns was associated with increased SHBG concentrations and may increase total T levels but were not strongly associated with free T levels. In addition, healthy dietary patterns were associated with lower E2 levels. Healthy dietary patterns included in most of the studies were the Mediterranean diet, DASH, alternative HEI-2010, vegetarian, vegan or prudent diets, while the unhealthy dietary patterns included the Western diet, dietary inflammatory index or omnivorous diet.
Our findings in the MrOS cohort that higher quality diets based on their low inflammatory or low insulinaemic potential are associated with higher T levels in older men aligned with findings from the systematic review on healthy dietary patterns linked to higher T levels in men. In contrast, our finding of no association with these dietary patterns and SHBG or that higher HEI-2020 is associated with greater E2 was not in line with the review findings. In the systematic review, only one study(Reference Chen, Pestoni and McGlynn42) directly investigated the HEI and found that higher HEI was not associated with total E2, total T or free T but was associated with lower free E2 and higher SHBG, which was in line with the overall finding from the systematic review. However, other healthy dietary patterns, such as alternative HEI, DASH or Mediterranean diet, which are strongly positively correlated with HEI, showed consistent results indicating that greater adherence to these healthy dietary patterns is associated with increased T and reduced E2 levels among men of various age groups. Aging is associated with increased inflammation and insulin resistance, which can disrupt hormonal regulation(Reference Uchoa, Moser and Pike59). Healthy dietary patterns may contribute to lower E2 production through favourable effects on adiposity, an important site of aromatisation while also improving insulin sensitivity and overall endocrine function(Reference Park, Kim and Lee60) and may modulate E2 levels to support optimal hormonal balance in an age-dependent manner. However, it remains unclear why only HEI was associated with higher E2 levels in our individual-level analysis in older men. One possible explanation is that the HEI-2020 captures overall adherence to dietary guidelines, whereas the rEDIP and rEDIH were specifically developed to reflect the inflammatory and insulinaemic properties of habitual diet, which may be more directly related to endocrine function. All seventeen studies that examined the association of dietary patterns and E2 included predominantly younger men compared with the men in the MrOS cohort. Furthermore, the systematic review included two studies of children and adolescents. Given the marked physiological changes in sex steroid concentrations during puberty, findings from these younger populations should be interpreted separately from those in adults. However, excluding these studies does not materially alter the overall conclusions of the review.
Chronic low-grade inflammation may suppress Leydig cell steroidogenesis through inflammatory cytokines and oxidative stress, while insulin resistance may impair hypothalamic–pituitary–gonadal axis function and alter sex hormone bioavailability(Reference Hayes61,Reference Kaltsas, Dimitriadis and Zachariou62) . Consequently, dietary patterns that reduce systemic inflammation and improve insulin sensitivity may support maintenance of testosterone concentrations during aging. Although these mechanisms cannot be evaluated directly in this cross-sectional study, they provide biological plausibility for the observed associations.
An important contribution of this study is the integration of findings from a well-characterised cohort of older men with evidence across diverse populations and dietary patterns. Although the specific dietary indices differed across studies, a consistent pattern emerged in which dietary patterns characterised by greater intake of plant foods and lower intake of processed and red meats tended to be associated with higher total testosterone and lower estradiol concentrations. The MrOS findings extend this literature by demonstrating that dietary patterns specifically designed to capture the inflammatory and insulinaemic potential of habitual diet show similar associations in older men, a population that has been underrepresented in previous studies. Together, these findings support the hypothesis that dietary patterns characterised by lower inflammatory and insulinaemic potential may contribute to maintaining a more favourable hormonal milieu during aging and therefore represent a modifiable lifestyle factor associated with the hormonal changes that accompany male aging, although prospective studies and randomised trials are needed to establish causality.
The strengths of this study include a well-characterised cohort, MrOS, for the individual-level analysis with a large sample size, the use of a validated dietary assessment tool and the inclusion of multiple potential confounding factors. We integrated findings from a comprehensive systematic review on the same biomarkers analysed in MrOS, which should provide a better direction for future research on the role of dietary patterns in circulating sex steroid hormones in men. To our knowledge, this is the first study to combine individual-level analyses of inflammation- and insulinaemia-related dietary patterns with a systematic review of dietary patterns and circulating sex steroid hormones in men. However, there are also limitations. MrOS included only older community-dwelling men, which makes generalisation of these findings to men of various ages and those living in institutions problematic, although this limitation is mitigated by the systematic review. The study population in the current analysis is only a subsample (27 %) of the total MrOS study population, which may induce selection bias, though this is less likely due to the random selection of the subsample, and importantly, the distribution of participant characteristics in this subsample is similar to a previous study that considered all participants at MrOS cohort baseline(Reference Nepal, Shi and Hoyd63). Most participants in MrOS are White, which may limit the generalisability of the results to other race groups. However, the systematic review included studies with participants of all racial backgrounds. Diet was assessed in MrOS using a self-reported dietary assessment tool (FFQ), which was not validated prior to use. However, FFQ have been shown to have high accuracy for dietary pattern studies(Reference Nepal, Shi and Hoyd63). Free hormone concentrations were calculated rather than directly measured. Hormone concentrations in the systematic review studies were assessed using multiple methods that may cause differences in the results across studies. Variation in the way results were reported made it challenging to meta-analyse the findings. We identified only four studies with results that could be meta-analysed, and robust conclusions could not be made from the meta-analysis results since only two to four studies reported on each biomarker.
Future studies should evaluate these associations prospectively to determine whether long-term adherence to anti-inflammatory and low-insulinaemic dietary patterns attenuates age-related declines in testosterone and alters estradiol concentrations. Randomised dietary interventions incorporating repeated hormone and diet measurements and mechanistic biomarkers of inflammation, insulin signalling and adiposity could help establish causality and identify the biological pathways linking dietary patterns with endocrine health in men. Studies in more diverse racial/ethnic populations and across different stages of adulthood are also needed to determine whether these associations vary by age or metabolic status.
Conclusions
Our study provides a comprehensive synthesis of the available evidence on what is known about different dietary patterns and the modulation of sex steroid hormones in men. Previous studies provided consistent evidence that healthy dietary patterns contribute to reducing chronic inflammation and improving insulin sensitivity. In this study, we observed that anti-inflammatory and low-insulinaemic dietary patterns are associated with more favourable sex steroid hormone levels in older men, potentially leading to healthier aging. The overall evidence in diverse populations of men of various ages and in different parts of the world suggests that multiple healthy dietary patterns are associated with reduced E2 and increased SHBG concentrations and may increase total T levels in men, but these differences are not strongly associated with free T levels. These findings provide a basis for designing randomised control trials to test the impact of anti-inflammatory and low-insulinaemic dietary patterns on circulating sex steroid hormones in men of different age groups, race/ethnicities and geographic locations.
Supplementary material
For supplementary material/s referred to in this article, please visit https://doi.org/10.1017/S0007114526109362
Data availability statement
Data from MrOS are available at https://mrosonline.ucsf.edu. The analysis dataset for this specific manuscript are also available from the corresponding author upon request.
Acknowledgements
None.
Financial support
No funding to disclose
Author contributions
Z.A.: Data curation-Lead, Formal analysis-Equal, Writing - original draft-Lead, Writing - review & editing-Equal; A.K.: Data curation-Supporting, Formal analysis-Equal, Writing - review & editing-Lead; S.C.: Writing - review & editing-Supporting; J.L.M.: Writing - review & editing-Supporting; E.O.: Data curation-Supporting; E.G.: Writing - review & editing-Supporting; F.K.T.: Supervision-Lead, Writing - review & editing-Supporting.
Competing interests
The author(s) declare none.



 Open access

