Introduction
Taking Denmark as my example, in this article, I argue conceptualising the Nordic welfare state in developmental egalitarian terms aids in clarifying the political status of basic income in the Nordic context. I argue that formation of a broadly incorporating developmental social contract tradition has contributed to a high level of social embeddedness of public governance, and shaped the evolutionary logic of the Danish welfare state. Progressive formation of universal social rights in Nordic states did not originate from a simple market-supporting system of equal transfers, but emerged alongside intentional pursuit of a diversified occupation inclusion structure.
The developmental contract tradition and developmental governance it supports has two key linked components: state regulation to promote equality in enjoyment of economic resources and status, reinforced by a cooperative system of public finance; and support by multiple stakeholders for human development processes, identifiable in the way core education and labour market institutions are structured (Haagh, Reference Haagh2012, Reference Haagh2015). Hence, as in other Nordic states, a high level of social equality in Denmark has derived from a complex structure of social inclusion with multiple parts. Historically, this structure has involved supporting occupational distinctions yet cushioning their impact on inter-generational and income stratifications through intentionally promoting a range of developmental solidarity systems. Public sector capabilities linked with developmental governance have been the foundation for recurrence of steps towards basic income in Denmark. However, neo-liberalisation in the form of flexicurity (Kongshøj-Madsen, Reference Kongshøj-Madsen, Auer and Cazes2003) entails that recent highly partial transitions to basic income from within pockets of the public sector can go in different directions. The developmental rights tradition in Denmark helped cushion the inherent instability and punitive tendency of the flexicurity model. Yet flexicurity also corroded developmentalism, generating a complicated scenario for basic income reform.
Basic income and social democracy
In the core literature, basic income can appear to be presented as an alternative to Nordic-style social democracy. In his classic work, van Parijs defined his project against ‘welfarist or outcome-oriented’ (van Parijs, Reference Van Parijs1995: 248 – note 30, 28) models, and social democracy as the pursuit of ‘the freedom to consume’ (ibid.: 33). Labour unions are often portrayed as linked with outdated welfare arrangements (Vanderborght, Reference Vanderborght2006; van Parijs and Vanderborght, Reference Van Parijs and Vanderborght2017), and social democracy has been placed at the forefront of a paternalist push for all individuals to labour (Standing, Reference Standing1999, Reference Standing2014: 15–16). At the level of discourse, the argument that basic income conflicts with the Nordic model is not unreasonable. Although a surprisingly large share – about half – of Europeans surveyed in recent opinion polls claim to be positively inclined towards basic income, scepticism is more marked in Nordic countries (European Social Survey, 2017).
On the other hand, analysing Nordic welfare state institutions in more general terms as governance systems presents a more complex picture. At one level, we can characterise the emergence of steps towards basic income in Denmark as a response to the exhaustion of dysfunctional regimes to sanction the unemployed that emerged in the course of the 2000s. However, the forces at work are politically complex. The attempt to ‘mix’ the rights and developmental traditions with a punitive regime that violates important personal freedoms led to sanctions being called into question, and partial steps to basic income coming about. Yet, if the developmental tradition thus came to the aid of basic income, will basic income come to the aid of the tradition that historically brought universal ideals such as those linked with basic income (Meyer et al., Reference Meyer, Helveg Petersen and Sørensen1978; Christensen, Reference Christensen2008) into being?
To answer this kind of question we need to move beyond the descriptive focus on individual institutions and sectors of the evolutionary literature. We have to recognise that ‘conversion’ of one institution (like benefit sanctions) may not necessarily spell ‘displacement’ (Thelen and Streeck, Reference Thelen and Streeck2005: 19) of the mode of governing – in this case the competition economy, that brought the offending policy (sanctions) – about. It is when we understand the Danish welfare state as a resilient but increasingly strained developmental governance system that we can see how steps towards basic income in Denmark today are fraught with tension.
The developmental social contract and the Danish welfare state
The Danish welfare state is recognised as sharing features with the Anglo-liberal type, although inclusion in basic universal schemes in both cases amounts to very different welfare models, with punitive benefits in the second case, but not the first (Esping-Andersen, Reference Esping-Andersen1990: 25–28). Pinning down what universalism in practice entails is difficult. Below I will discuss how models of social incorporation can help by showing how combinations of schemes drawn along the lines of pure universalism and developmental inclusion reinforce each other in raising the level of social inclusion.
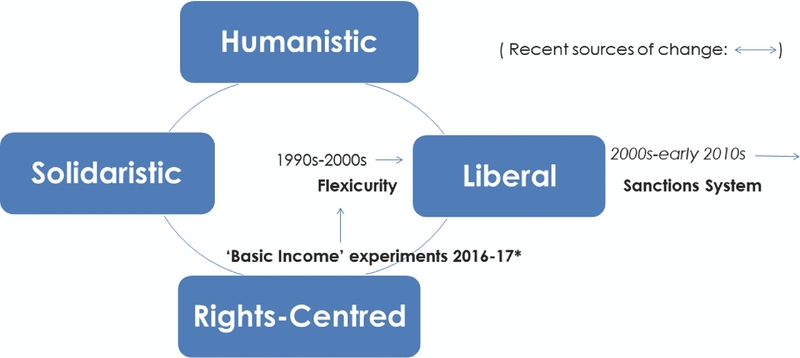
As set out in Figure 1, the Nordic welfare model emerges through a range of different incorporating movements under the aegis of the state. Recent opposing trends in the governance of labour markets and income security can be identified as encased within a model of governance that integrates liberal and developmental features. In the Nordic region, the kind of systemic vulnerability Tilly (Reference Tilly, Evans, Rueschemeyer and Skocpol1985) has linked with the formation of centralised European states combined with egalitarian social traditions to generate conditions in which over time many aspects of public governance became heavily embedded in society. From the seventeenth century, paternalist bonds between kings and peasantry forged during successive rounds of military conscription (Jensen, Reference Jensen1936: 5, 280–340) were reinforced through land reform to circumvent aristocratic power (Jensen, Reference Jensen1936: 129; Kananen, Reference Kananen2014). Revisiting of rural property boundaries (Nothin, Reference Nothin1926), along with emergent public regulation of rural labour (Hvid, Reference Hvid2016: 557), cemented a socially embedded form of public authority and legal tradition (Jonassen, Reference Jonassen1983: 34–5). Denmark was one of the first states in Europe to institute universal public education, in 1814, pushed by an emergent education movement in the countryside across the Nordic region (Sandberg, Reference Sandberg1979: 225–6).
Developmental governance in Denmark: historical foundations and contemporary sources of change

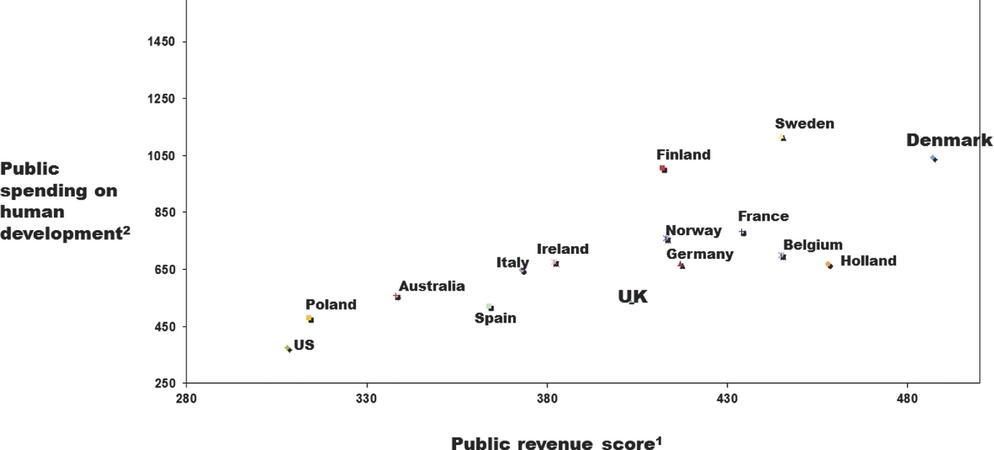
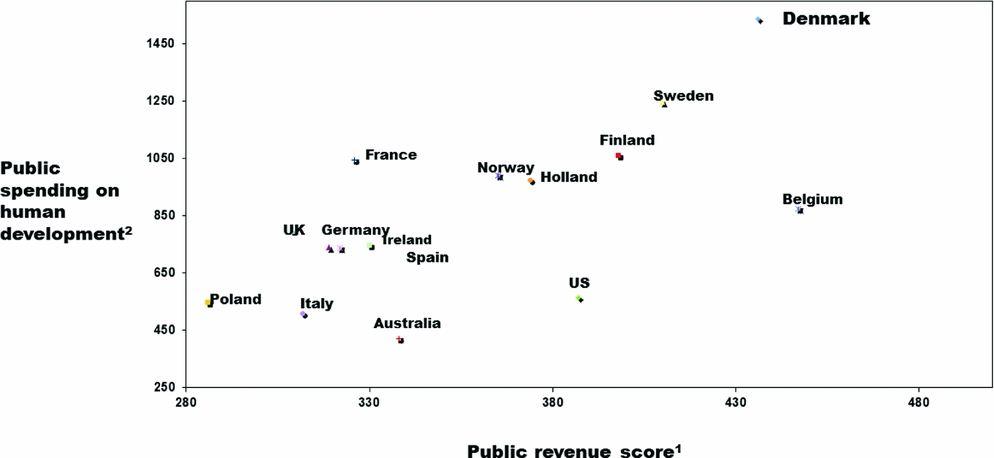
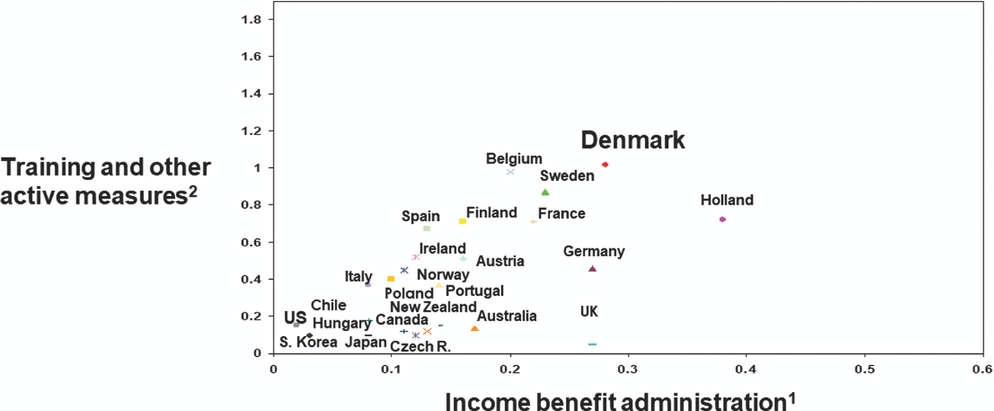
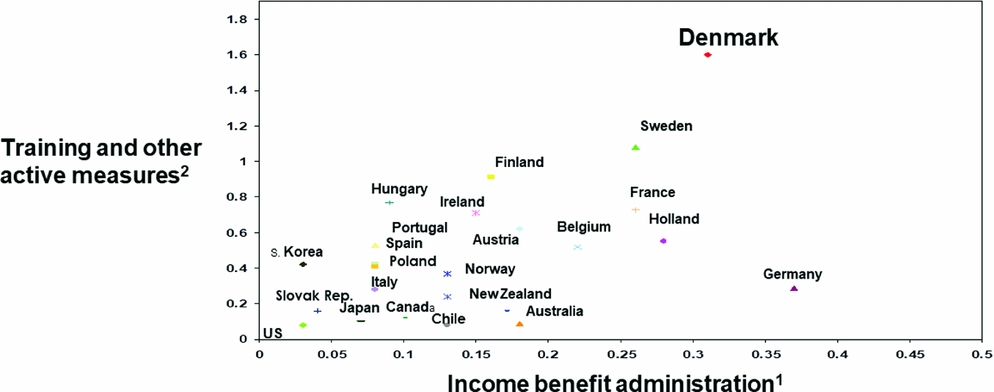
Today, a developmental form of social contract in Nordic states can be identified descriptively in two features of governing. First, as shown in Figure 2 (a and b), the Danish public finance system entails a high level of socialisation, and public spending is resiliently more human development-orientated compared with other countries. In addition, Nordic public policy tends to promote equality and incorporation along human development dimensions. Notably, the importance of ‘age-related social risks’ in the Nordic model is stressed and related with trust formation by Birnbaum et al. (Reference Birnbaum, Ferrarini, Nelson and Palme2017: 4), and with developmental freedom and public property rights in economic stability (Haagh, Reference Haagh2012). Here I argue, however, both phenomena are a consequence of a wider, dynamic developmental governance model that cannot be reduced to parts, static norms, or particular items of spending. Denmark has a cooperative system of public finance, defined as involving a high level of taxation across social groups as well as a high level of social inclusion in systems of human development spending. This model is distinctive not for its focus on age categories as much as the support of developmental processes and social relations.
Developmental governance (2000): cooperative public finance

Developmental governance (mid-2010s): cooperative public finance

To further explain, a developmental governance model tends to have a humanistic orientation, in the following three senses: the structure of education prioritises personal and social development; the governance of contributory expectations emphasises incentives over exclusions or punishment; finally, cooperative values and practices tend to be inculcated and governed through socialisation rather than compulsion. To exemplify, in the Danish education system, historically, a solidaristic element is manifested in regulation to promote parity in resourcing for students in public and private schools (Undervisningsministeriet, 2004; Haagh, Reference Haagh2012). A humanist element is involved in state intervention to delay exams, and suppress competition (Steinmo, Reference Steinmo2010: 71), and in an emphasis on ‘wholeness’ and the teaching of independence and critical thinking (Loftager, Reference Loftager2004: 118–121). Finally, a liberal element is perceptible in governance autonomy of schools, and a diverse offering of further education courses. The upshot is reciprocity in society tends to take a general social and temporal (inter-generational, cross-class) rather than a direct form.
The way developmental governance has intersecting humanist features contributes to the model's stability. After the 1990s, however, changes in social policy in Denmark – as in other Nordic states, imposed by global pressures, generated a push towards the market model, without abandoning the developmental contract model. Next, I explore how the focus on developmental governance extends on prevailing models of welfare comparison and social incorporation.
Comparative capitalism, social incorporation and the equality paradox
States are grouped by the extant comparative welfare literature according to how different actors have shaped capitalist development (Esping-Andersen, Reference Esping-Andersen1985). The welfare literature focuses on labour process, and the Varieties of Capitalism on the organisation of business (Thelen, Reference Thelen2014: 2–3). A problem, however, with an account of modernity as thoroughly capitalist is that equating economic formalisation with capitalist development presents an unrealistic idealisation of informal society.
An analogous problem is evident in the term ‘de-commodification’ used by Esping-Andersen (Reference Esping-Andersen1990) to set the Nordic states apart.
An alternative to thinking of freedom outside the formal economy is to enquire how individuals attain states of enjoying economic stability through the democratic development of shared property rights in multiple sources of security generated within society (Haagh, Reference Haagh2012). Relatedly, Offe (Reference Offe1984: 42) suggested a ‘developmental tendency’ in mature capitalism might bring about a basic income from ‘within’ the structure. Yet arguably, the tendency in question is not inherent in capitalism but in variants where – as in Nordic states – public support of human development has gained ascendency.
Accordingly, to explain how developmental incorporation has sustained high social equality in Denmark, and recent strain in this model frames the basic income debate today, below I adapt Korpi and Palme's (Korpi and Palme, Reference Korpi and Palme1998) analysis of alternative models of social incorporation.
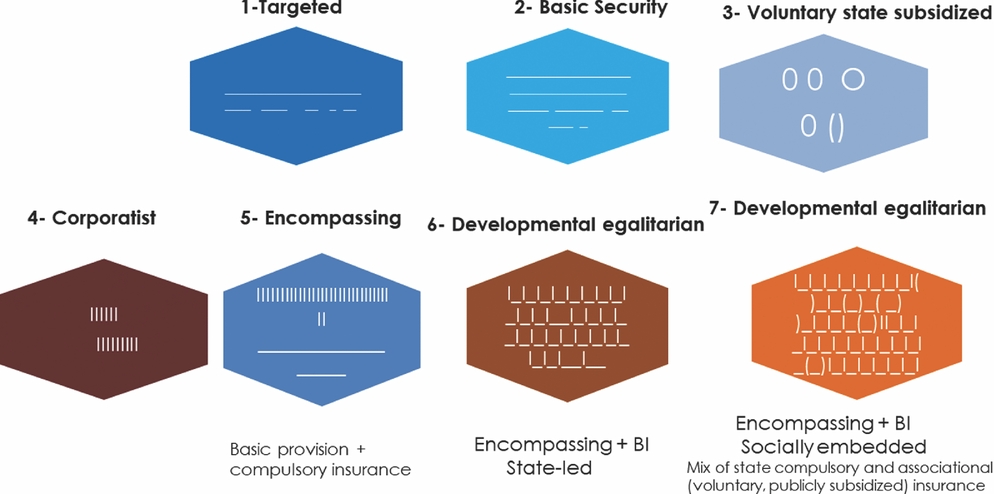
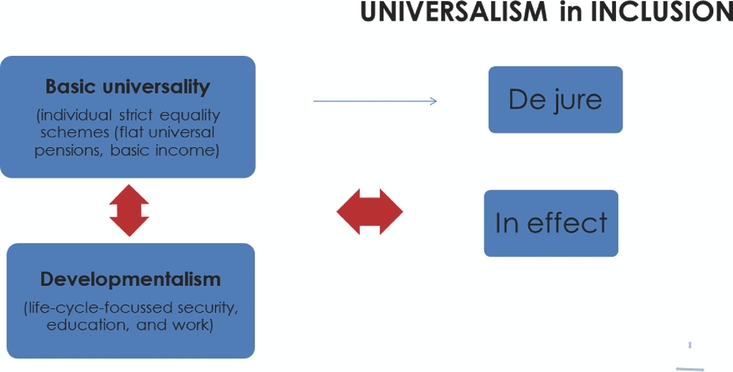
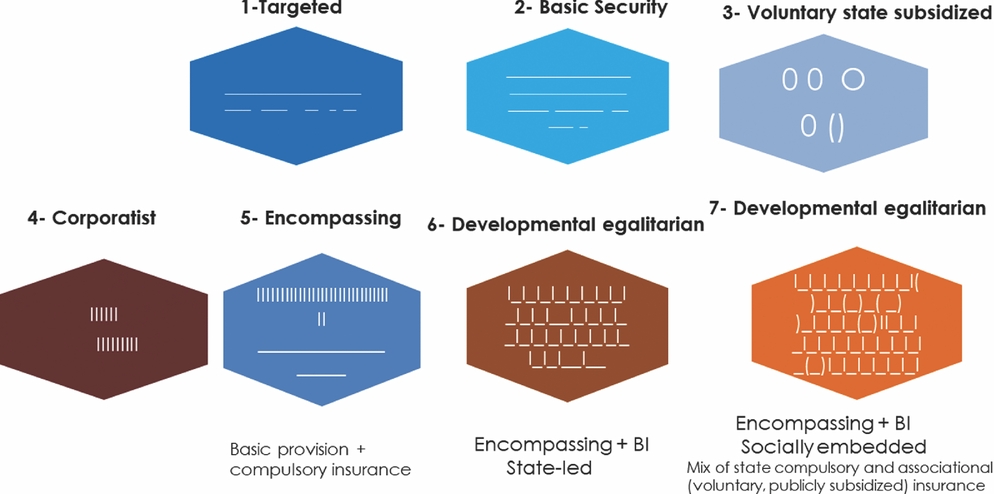
Korpi and Palme sought to explain how – paradoxically – public pensions systems characterised by inequality produced overall equality among pensioners (the redistribution paradox). Accordingly, in Figure 3 Diamond No 5, Korpi and Palme's ‘encompassing’ model represents a pension system based in a combination of basic and contributory provision, resulting in high coverage, class inclusion, and low inequality.Footnote 1 The lines in this model indicate the way society as a whole is covered by social security, through different schemes. The horizontal lines indicate the means-tested safety-net, the vertical lines indicate state-subsidised contributory systems. Critics of Korpi and Palme's model claim it is no longer relevant in the sense that, today, the link between targeting and inequality is less clear (Brady and Bostie, Reference Brady and Bostie2013; Marx et al., Reference Marx, Salanauskaite and Verbist2013). Yet, critics can say this and be right only because society has changed away from a form of social incorporation that promoted stable inclusion towards a labour market based on greater income stratifications and precarity. The effect is to reinforce Korpi and Palme's argument, being that comparably broader public incorporation raises the pool of shared welfare and lowers inequality. Where inequality in the market is higher, the public sector has to work much harder to even it out. Indeed, this is also Hills’ (Reference Hills2015: 38) conclusion when he observes it is still the ‘overall scale’ of welfare spend that matters for the effect of spend on social equality in a given society.Footnote 2 My argument is that the only way a scale effect can be (and in Nordic states has been) achieved is by promoting equality and developmental security both within and outside production (Haagh, Reference Haagh2002). Consequently, I suggest we need to rework the redistribution paradox as a broader Equality Paradox: developmental governance is an instrumental factor in translating the effect of basic universality in particular schemes into universalism in inclusion or in effect (Figure 4). This involves four basic adaptations of Korpi and Palme's argument.
Social security incorporation models
The equality paradox within the Nordic welfare state
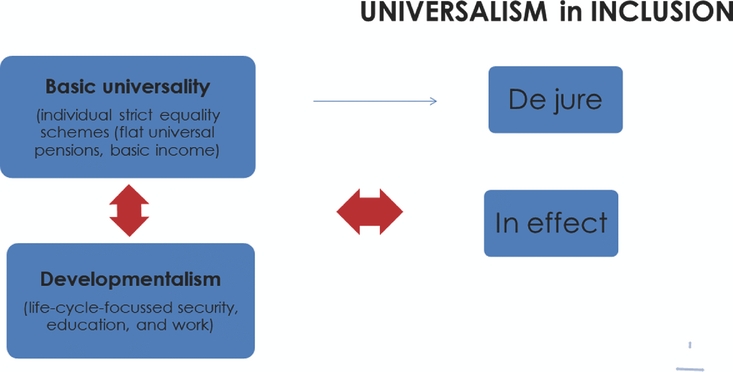
First, a basic distinction needs to be made to interpret Korpi and Palme's model: targeting by design involves means-testing through a particular scheme; in theory all are entitled if they are in a certain situation. Targeting by effect occurs where only certain groups enjoy real advantage from a certain scheme – what Esping-Andersen referred to as ‘flat-rate universalism’ (Reference Esping-Andersen1990: 25). The implication for basic income debates is important, by revealing how despite the universal (strict egalitarian) design of the scheme, a basic income may operate as an anti-poverty targeted scheme by effect. This would be the case where other inclusion structures are weak.
Consequently, second, to show how – in the case of Denmark – incorporation works through developmental governance, it is necessary to broaden Korpi and Palme's model beyond pensions. Korpi and Palme did not include Denmark in their model because their model focussed on pensions, and at the time Denmark had a flat-rate model compared with Sweden (Denmark has since also adopted a two-tier model). However, considering the two-tier income insurance model in Denmark (basic assistance and voluntary unemployment insurance (UI) contributions), dating to 1907, Denmark has had an encompassing model of welfare within the governing of labour market-related security for a long time. In addition, the Folk education system is in effect a two tier system: in countries like Denmark and Sweden, private schools charging small fees, yet heavily subsidised by the state (in Denmark to around 85 per cent of costs), are publicly ‘incorporated’ private schools (Haagh, Reference Haagh2012).
Third, arguably Korpi and Palme's model works best as an incorporation model rather than class-calculus model, because incorporation has the effect of diluting class. Another way of putting their argument is to say citizens in Nordic states are moved to support overall universality of outcome through socialisation in developmentally structured shared institutions.Footnote 3
Accordingly, fourth, I want to make Korpi and Palme's incorporation model more dynamic, by showing how developmental governance supports universalism in effect over time. Conversely, where developmental governance is curtailed, universalism begins to leak. ‘Leakage’ occurs where sizeable populations begin to fall out of formal systems to which they are entitled. Leakage can be linked with a more punitive form of sanctions regime (Haagh, forthcoming), and the likelihood of such a regime in the context of targeted and basic security models, in which the weakness of shared labour market security systems entails greater pressure to observe public case-load reduction targets (Haagh, Reference Haagh2018). Hence in Figure 3, leakage within the weaker incorporation models 1 and 2, based on minimal provision, is indicated in the break up of the lines at the bottom tier of social security. In contrast to this, I argue that developmental governance supports instead a positive mutual effect between different social aspects of freedom within and across the design of different welfare schemes. Developmental freedom is broadly the freedom to be secure in life-course terms (Haagh, Reference Haagh2015). Independence freedom is the freedom to enjoy security in your own name, as of individual right. Cooperative freedom is the freedom to choose affiliation. The Danish (and Finnish) UI systems share certain liberal rights features with a basic income institution, which speak to these forms of freedom combined. Unlike in other European systems, state-backed occupational insurance in Finland and Denmark is voluntary – indeed, it may be no accident that basic income (BI) experimentation is more advanced in Finland and Denmark. Although BI is non-contributory and UI is contributory, both are based on individual entitlement unrelated to spousal income and means. Both enhance economic stability: BI offers low, permanent security, and UI longer-term, generous, wage compensation. Finally, BI supports autonomy of action, UI voluntarism in contribution.
BI advocates often argue against public subsidy of the UI system, given the more generous level of UI compared with basic (non-contributory) security. In simple fairness terms they have a point. However, public subsidy of the UI system has not only enabled redistribution within the UI system (Bjørn and Høj, Reference Bjørn and Høj2014: 10). In addition, through interstate comparison we can surmise a more secure occupational system – attained through standards, wage bargaining, and income-related insurance (UI) – has the effect of ‘lifting’ the base (Haagh, Reference Haagh2012: 575).Footnote 4 The period in which Denmark came closest to a BI scheme – e.g. when administration of basic assistance was most lax, in the late 1970s and 1980s, coincided with the height of affiliation to occupational schemes. Accordingly, in Diamonds 6 and 7 in Figure 3 I suggest a resilient (if strained) model of Developmental Equality has obtained in Denmark and other Nordic states.Footnote 5 A basic income could play a pivoting (system-stabilising) role in consolidating such a model today, in conditions where other developmental security systems remain in place. However, next, I discuss how the practice of flexicurity has corroded developmental governance, generating a complicated backdrop for the debate about BI reform.
Welfare contractualism and the developmental ‘rebound’ effect
In the post-war period, contractualism in Denmark divides into three phases: ‘developmental’ till the 1980s; ‘new contractualism’ (Ervik et al., Reference Ervik, Kildal and Nilssen2017) involving flexicurity, after the 1990s; and neo-conservative market-contractualism – or the ‘competition state’ – during the 2010s (Petersen, Reference Petersen, Ervik, Kildal and Nilssen2017: 152), defined by the rise of directly punitive sanctions.
As in other countries, in Denmark state-led attempts to lighten the bureaucratic divide between different classes of basic benefits (e.g. basic unemployment, sick-pay, ‘job ready’ support, see Arbejdsmarkedsstyrelsen, 2007: 10–14) has been under way since the early 2010s. This exemplifies how in general a silent transition to very partial forms of BI is occurring within European welfare states. At the same time, the balance between market-administrative and developmental governance shapes how this is occurring. Implementation of British and Danish sanctions regimes since 2010 has been described as intense (OECD, 2012), in both cases affecting about 25 per cent of benefit claimants every year (Adler, Reference Adler2016; Haagh, Reference Haagh2018). However, in the UK, the roll-out of Universal Credit (simplification through uniting six different benefits) since 2014 has not led to abatement of sanctions (National Audit Office, 2016). By contrast, in the Danish case, a public culture of rights-scrutiny can be shown to have had a manifest impact on changes in the sanctions regime. Danish authorities have taken a lead in investigating and publishing health outcomes of sanctions, detailing the numbers receiving medication and effects on individuals facing homelessness or addiction to drugs, leading to suggestions for revision of practice (Ankestyrelsen, 2017: 16–7). One public report noted that municipalities that had a high use of sanctions were less effective (Arbejdsmarkedsstyrelsen, 2008: 4–5, 20–2), and another that sanctions are ‘too harsh’ (Arbejdsmarkedsstyrelsen, 2007: 14–5). In 2014, government-led investigations ensue in a more marked fall in sanctions following a reform of the system. As a share of unemployed, the number peaks at 23.9 per cent in 2011, and then begins gradually to fall, with a more marked fall in 2014, to 16.6 per cent of all benefit recipients (Beskæftigelsesministeriet, 2016: 5).
There is evidence that the more diverse form of developmental security in Denmark has softened the impact of sanctions. In the UI system, fewer sanctions are given, and claimants can anticipate sanctions (Bjørn and Høj, Reference Bjørn and Høj2014). In the basic assistance (BA) system, sanctions are more frequent, but have three distinctive features (compared with Britain): they are shorter, and more health-contained and education-defined. First, in the BA system, 96 per cent of all sanctions are point sanctions, reducing benefits for up to one or two days in a month (Klos, Reference Klos2014: 20; Beskæftigelsesministeriet, 2016), compared with 81 per cent in the UI system (ibid: 15). Second, there is evidence that social workers in municipalities avoid sanctioning vulnerable groups, and this explains why those sanctioned are in better health (Caswell et al., Reference Caswell, Andersen, Høybye-Mortensen, Karkussen and Thuesen2011: 10).Footnote 6 Third, sanctions are used ‘educationally’, with a large number (over 42 per cent) estimated to be linked with an intention to ‘bring up’ and ‘bring within’ young men in particular (Caswell et al., Reference Caswell, Andersen, Høybye-Mortensen, Karkussen and Thuesen2011: 41). Over time, Denmark increases spending on training (Figures 5a and 5b).
Activation systems (2007): benefit administration, spending in GDP
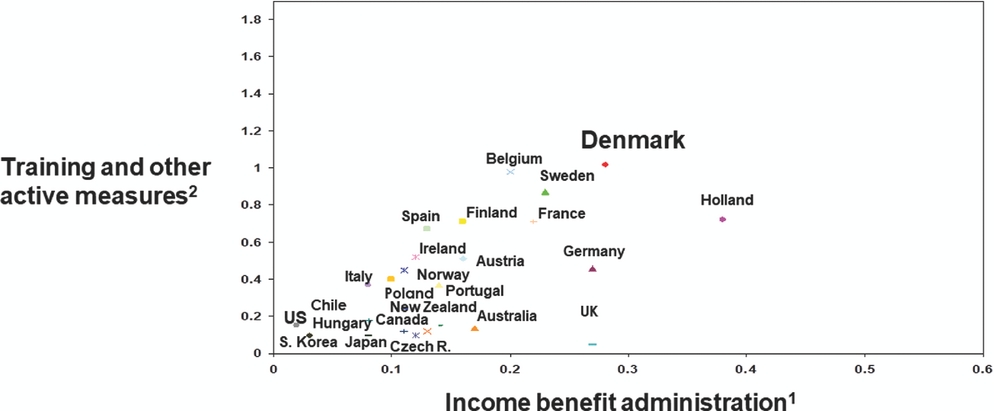
Activation systems (2014): benefit administration, spending in GDP

An obvious risk in benefit sanctioning is leakage, whereby the discouraging impacts of sanctions entail that citizens disappear from records and lose entitlements in effect. Leakage is occurring, but is comparably less severe, in the Danish case. At its height, in 2010, self-support without income affected 0.6 of the economically active labour force. By 2015 the size of this excluded population was halved, albeit still affecting just under 2 per cent of the unemployed (non-student) population (Danmarks Statistik, 2017). By comparison, in Britain, it is estimated non-take up of benefits doubles, from a third to two-thirds of individuals entitled, during the implementation of sanctions (The Money Charity, 2016).
In Denmark, public research led to state commissioning of experiments with lifting conditions and sanctions. The municipality of Kalundborg reported a doubling of activation rates after participation was made voluntary (Cuber, Reference Cuber2018; Solås, Reference Solås2018). Aarhus municipality combined the lifting of conditions with external funding to offer the unemployed additional resources to support self-employment. In the case of Aarhus, social workers who were interviewed reported how initial scepticism was overcome through implementation, as opportunities to ‘sit down with the client as an equal, as a citizen’ came to be valued.Footnote 7
In sum, it is plausible to argue transitions to basic income in Denmark are emerging from within the Danish developmental system of governing, yet this transition is complex. Next, I discuss how conversion of basic assistance systems to BI would address dysfunctions in post-war welfare design, yet entrenchment of the flexicurity ideal imperils the occupational governance of work that has been a dynamic factor in high social equality.
Developmental governance, flexicurity and the BI proposal in Denmark
Basic income reform – the lifting of conditionalities and means-testing in access to basic security – addresses short-comings in the post-war welfare model that flexicurity deepened. In the 1970s, debates about poverty traps linked with means-testing in Europe and America focussed on earnings disincentives: why give up public assistance for a paid job? As administration and compulsive regimes intensified after the 1990s, the poverty trap was compounded by class, security, administration, and ownership traps. In conditions of rising market uncertainty, the ‘dual citizen’ model regenerated an old stigmatising divide, between owning and non-owning citizens: means-testing entails a person must exhaust all savings before qualifying for public assistance (as noted, in Denmark this illiberal policy did not obtain in the occupational system). Basic income would resolve these basically unjust and unproductive status distinctions.
Consequently, BI is potentially ‘pivoting’ (Haagh, Reference Haagh2017, Reference Haagh2018) – e.g. it stabilises the conditions for systems’ effective function by consolidating the independence status of society's constituent parts. In Århus, for instance, findings of a 2016/7 experiment that followed 100 unemployed who received development grants without conditions (mentioned above) highlighted how in a majority of cases some ‘rehabilitation’ was a precondition for productive plans. This involved permission to prioritise spending on means to function, in the form of personal infrastructure: such as a bicycle, a computer, work-tools, or a driving licence, or/and spending on personal health and appearance (like dental treatment or glasses).Footnote 8 Second, restrictions on ‘owning’ (which legally remained) were exposed as a major barrier to productive endeavour. In one case, where a person decided to use his development grant to buy a van to start a business, social workers had to consider legally taking ownership of the van, or just to ‘hire’ it, to enable the experiment to continue.Footnote 9
To further understand the challenges connected with both developmental governance and basic income reform in Denmark it is important to appraise how ‘flexicurity’ did not work as prescribed. First, flexicurity failed to incorporate. If we count everyone under the age of sixty-four not in work, the ‘real’ number of non-workers in Denmark in 2015 was around 1 million people; that is nearly a third of the labour force (of 3.37 million, Beskæftigelsesudvalget, 2017). The main effect of flexicurity was to hollow out developmental incorporation systems without replacing them with dynamic alternatives. Cuts in entitlement (such as from four to two years in 2010) meant that a large chunk of the labour market – an estimated 80,000 persons since 2010 (Kirk, Reference Kirk2015) – fell outside the developmental (UI) system, becoming instead reliant on means-tested support. This raises the question: is flexicurity moving Denmark towards Esping-Andersen's (inherently low-level) ‘flat-rate’ universalism (1990, op.cit), and would basic income facilitate this transition?
Second, flexicurity did not work as a market-clearing system either. A hallmark of flexicurity is high turnover, with opening of 25 per cent of all employment positions on an annual basis. Average tenure is lower in Denmark than in other Nordic states. Yet, much higher mobility among young workers suggests flexicurity still conforms to a degree with Esping-Andersen's (Reference Esping-Andersen1999: 157) ‘Schumpeterian omnibus’, e.g. the bus of ‘undesirable’ (including short-duration) jobs is always full, but the passengers change.
The period of flexicurity has seen a seminal shift away from youth entering manual occupational training systems, from over 40 per cent in the 1990s (Anker, Reference Anker1998), to just under 20 per cent in the late 2010s (Tesfaye, Reference Tesfaye2013). Hence, third, it is not clear flexicurity has been a source of upgrading development. According to Hansen et al. (Reference Hansen, Lind and Møller2017, 4–5), businesses have responded to low-tax and high-fire incentives by pursuing wage compression rather than production innovation, resulting in a flat-productivity strategy (Productivity Commission, 2014, cited in Hansen et al., Reference Hansen, Lind and Møller2017: 4).
The politics of alternative basic income transitions in Denmark
To surmise, what we are seeing in Denmark is a form of stalemate, in the form of a slow decay of developmental governance: Flexicurity cannot incorporate, yet the sanctions system and absence of ‘real’ occupational policy entail a new development model cannot be born. In this context, it is interesting to revisit the current status of developmental governance and the BI debate.
First, though the developmental security tradition has been challenged, it has proven adaptable. The customary linkage of union and UI membership was weakened by legislation in the 1990s as part of liberalisation reforms. In addition, UI funds lost members by legal disqualification (above). Yet the fall in membership is less than expected, at around 4 per cent during the 2010s (Danmarks Statistik, 2017). UI institutions have adjusted to adversity by extending eligibility for the unemployed and students (Danske A-Kasser, 2014).
Moreover, despite challenges linked with falling membership, the UI and workers’ organisations still operate in many ways as an occupational system. In their online platforms, UI institutions encourage union membership. The workers’ movement is growing through the rise of cross-occupational unions.Footnote 10
Nevertheless, the question remains how occupational systems can remain broadly inclusive in the face of a high level of non-employment participation, and a clientelist basic social assistance system that works more as a pacification than an effective inclusion structure.
Some employer groups in Denmark have shown interest in basic income reform, and – as in other countries – tie it to further flexibilisation of the market in labour. Asked to imagine a basic income economy, the former CEO of a large supermarket chain in Denmark saw BI as complementing the existing system of collective frame bargaining, combined with greater flexibility in (local) labour relations (Josefsen, Reference Josefsen2018). Employers, he argued, would benefit, because workers not motivated to do the job required could leave, adding that through this power of ‘exit’ workers could even hold ‘bad employers’ accountable.
This possibility is contested by labour leaders and MPs of the core left party in Denmark, Enhedslisten, who envisage that, under a future (low) basic income, workers who wish to attain an acceptable standard of living would be forced to work with fewer protections (Sørensen, Reference Sørensen2016). Any vulnerability would lead to exclusion. Basic income is the so-called ‘red rose with blue thorns’, an ostensibly progressive proposal ushering in a conservative, right-wing, agenda and involving painful sacrifices in terms of rights in employment and welfare. Sorgenfrey, leader of the largest public sector union, believes the power of collective bargaining structures would be eroded by high local-level flexibility in labour relations, fearing ‘the neo-liberals would win’ in this scenario (Sorgenfrey, Reference Sorgenfrey2018).
Whilst I agree with Sorgenfrey and Sørensen's observations concerning the risk of a displacement route to basic income reform, e.g. basic income traded for the developmental systems of spend and regulation, I do not agree this trade-off is necessary (Haagh, Reference Haagh2011). Sørensen wants an offensive strategy focussed on strengthening ‘universal rights to education, health and welfare’. Basic income fits within this strategy, and does not need to entail breaking with public subsidy of other developmental security systems.
The ‘progressive BI’ strategy I suggest (of a careful reworking of developmental systems) has some similarities and differences with other proposals that involve a partial adaptation of flexicurity systems. As an example, Hansen et al.’s (Reference Hansen, Lind and Møller2017: 6–7) recent scheme for a revitalised ’unemployment system’, situates ‘opportunity for’ BI at the base along with a new compulsory UI system, with assistance for a full three month duration, and a public job guarantee (at the minimum wage). The key merit of Hansen et al.’s proposal is that it sets the employment and unemployment systems together.
Yet, Hansen et al.’s model relies on a high level of labour market-readiness, and to that end continues to cut life-course security in favour of enhancing labour mobility. A three-month UI cover for all is comparably very short. In addition, the premise individuals should choose UBI or activation generates a direct form of state administration of employment transitions which opens the door to reintroducing behaviour controls down the line. It is not clear if their proposal is a UBI scheme, in the sense that a UBI is continuous, guaranteed separately, and operates through the life course, and these features do not appear to be contained in their version of ‘UBI’.
By historical comparison, a downside of the Swedish Rehn-Meidner model was its curtailment of autonomy: individuals could be forced to move towns to continue to enjoy social benefits. An alternative is to rely on some features of the Rehn-Meidner model, specifically the stabilisation of production factors, through securing the rights-foundation of shared resources combined with new ways of tying collective development planning with reviving occupation economies. The idea of basic income sitting within a wider collective reclaiming of development is not radical in a Nordic context. An oft-forgotten historic aspect of Nordic public policy is heavy regulation of land and national ownership of natural resources (Sanders et al., Reference Sanders, Sandvik and Storli2016), and of course public money (Sandberg, Reference Sandberg1978). Recent proposals for rooting a basic income in a new public money system in Denmark (Christensen, Reference Christensen2017: 84–91) is in this tradition. In this sense, democratic (liberal) capitalism is quintessentially Nordic. In all, a continuous BI is more likely to support Hansen's goal of raising the (effective) wage level, although the quid pro quo is greater reliance on non-wage (such as developmental, social, and occupational) motivation, to encourage social contribution based on intrinsic incentives.
Conclusion
In summary, four broad points may be drawn from my discussion of the role of basic income in contemporary welfare state transformation in Denmark. First, an Equality Paradox may explain why basic income is emerging more rapidly in high equality countries such as Denmark, in which developmental incorporation translates universalism de jure into high levels of inclusion de facto. Second, however, the forces that in this argument make universalism effective and sustainable are under increasing strain.
Hence, third, the Danish case illustrates key background factors that are shaping ‘real-life’ transitions to highly partial basic income within and beyond Europe today. European states are stumbling towards very partial basic income almost unconsciously, as those in charge of social transfer systems are trying to streamline systems based in increasingly complicated and randomised labour stratifications. In this context, basic income can be a catalyst for two quite different developments, either a reworking of developmental governance or a further extension of the market. The concern in the second case is that if – in the Danish case – a BI were to be traded for a further corrosion of developmental security it would become in effect – if not by design – a targeted anti-poverty scheme, defined by those depending on it enjoying an overall much lower share of social resources. This also explains the ‘justification’ problem that paradoxically BI suffers in Nordic states. In the Danish case, the developmental tradition contained the punitive character of the state's reinforcement of the market, both historically and recently. Yet, flexicurity also drained the tradition that made this mode of governing initially plausible. The direction of basic income debate and transformation in Denmark therefore remain to be seen. The upshot is a reform such as basic income may depend on a high level of formal development of occupational systems. Because of the mixed features of Denmark's welfare regime – a liberal labour market with a tradition of developmental policies – the choices and trade-offs now faced in Danish society hold lessons with wider implications for the global debate.
Supplementary material
To view supplementary material for this article, please visit https://doi.org/10.1017/S1474746418000301.