I. INTRODUCTION
The ductile-to-brittle transition temperature (DBTT) is a materials property that has important consequences for safety and reliability in applications, but also requires an understanding of the energetics of fundamental deformation processes. It is strongly affected by both strain rate and environment, but a clear understanding of what the mechanisms are is still elusive. What is needed is an analytical model that accounts for all the important parameters governing the DBTT. Steps toward developing such a model are undertaken in this study; the authors contend that the critical concept for understanding the DBTT is crack tip shielding by dislocations, which is strongly affected by temperature, strain-rate, and hydrogen. The goal of this study is to develop such a model with a particular focus on the energetics of crack tip plasticity. This model will then be tested by applying it to previously published data, first on fracture toughness measured at different strain rates and second on fracture toughness with and without the presence of hydrogen, both as a function of temperature.
First, we introduce the concept of crack tip shielding by dislocations, which will be the basic physical principle of the proposed model, and how this is linked to the DBTT. DBTT concepts have origins in the thermally activated dislocation plasticity models of Cottrell Reference Kelly, Tyson and Cottrell1 and crack-tip plasticity models of Dugdale–Barenblatt. Reference Dugdale2,Reference Barenblatt3 From a materials science approach, St. John Reference St. John4 was possibly the first to discuss a definitive activation energy for the DBTT process in single crystals. This was done for silicon, which undergoes a DBTT within a few degrees, known as a hard transition. This was later compared with soft transitions (more gradual) in metallic systems. Reference St. John4,Reference Gumbsch5 Over the following three decades various dislocation nucleation Reference Lin and Thomson6–Reference Marsh and Gerberich8 and dislocation velocity Reference Samuels, Roberts and Hirsch9–Reference Roberts and Hirsch11 controlled approaches using discretized dislocation statics and dynamics were put forth. Although it is unclear whether dislocation nucleation or propagation controls the DBTT in a given material, the two processes have been suggested to be correlated and may in fact be viewed as a singular mechanism from the standpoint of thermal activation. For example, Roberts and Hirsch Reference Roberts and Hirsch11,Reference Devincre and Roberts12 have proposed that dislocation velocity is key to the magnitude of dislocation shielding that can take place. They calculate that the ability to emit subsequent dislocations from a crack-tip or an external source depends on the previous dislocation moving far enough away from the crack tip. This is due to the back-stress field of the previous dislocation inhibiting operation of the dislocation source. This means that the applied stress intensity factor for continued emission would be continually increasing until a critical point where the source operation is no longer favorable. Atomistic simulations using either external dislocation or crack-tip emission sources verified that such approaches could be used to predict the DBTT in silicon Reference Samuels, Roberts and Hirsch9,Reference Qiao and Argon13 and Fe–3% Si. Reference Huang and Gerberich14,Reference Song and Curtin15 Furthermore, dislocation mobility was later used as a key variable by utilizing test temperature and strain rate as experimental variables. As a result, similar theoretical and analytical models confirmed the validity of such approaches for tungsten. Reference Gumbsch5,Reference Giannattasio and Roberts16 Irrespective of whether crack-tip nucleation has major involvement with the DBTT, it is clear that dislocation velocity will control the number of dislocations emitted. As a result, the magnitude of dislocation shielding of the stress intensity factor must involve both strain rate and temperature effects on dislocation velocity and arrangement.
II. THEORETICAL MODELING
To utilize the crack-tip shielding concept, a kinetic-based, thermally activated barrier model for the ductile–brittle transition conditions is appropriate. Environmental conditions can be taken into account by modifying the thermal activation parameters. This would include test temperature and applied strain rate (or stress-intensity rate). The basis for such an analytical model was taken from a previous study wherein the dislocation mobility approach of Roberts and Hirsch Reference Samuels and Roberts10,Reference Roberts and Hirsch11 was adopted with a slight variation. Reference Gerberich, Stauffer, Beaber and Tymiak17 This was originally done to evaluate a fracture toughness K Ic size effect that had been largely measured on silicon nanoparticles and nanopillars of less than about 500 nm in diameter. Reference Gerberich, Tymiak, Grunlan, Horstemeyer and Baskes18–Reference Mook, Nowak, Perrey, Carter, Mukherjee, Girshick, McMurry and Gerberich20 The basis for the model from Appendix B of Ref. Reference Gerberich, Stauffer, Beaber and Tymiak17 is presented as Eq. (1), where the critical strain energy release rate, G Ic, can be expressed as:
 $${G_{{\rm{Ic}}}} = {{{\eta _0}{V^*}{\sigma ^*}{\varepsilon _{\rm{p}}}} \over {{b^2}}}\quad ,$$
where η0 is a constant based on Poisson's ratio, V* is the activation volume for dislocation emission from the crack tip, b the Burger's vector, σ* the thermal component of the yield stress, and εp the plastic strain. As such, G Ic is proportional to the plastic strain energy in the activation volume divided by the area of initiation of b 2. In Eq. (1), the original derivation used the yield stress σys rather than σ* due to the usage of a different dislocation velocity law than that which will be presented here.
The previous model used the stress dependency as a power law and a corresponding stress-free activation energy in the exponential. We propose using the previous model Reference Gerberich, Stauffer, Beaber and Tymiak17 for iron-based systems with two differences: a stress-dependent activation energy and a thermally dependent dislocation velocity law. Addressing the first proposed change, there is abundant literature on thermally activated dislocation glide for metals and alloys with which a soft transition might be more realistic than the hard transitions found in silicon. This requires use of a stress-dependent activation energy, which can be defined as:
 $${H_\sigma } = {H_0}-{\sigma ^*}{V^*}\quad ,$$
where the stress-free activation energy, H 0, is reduced by the stress work.
Again, σ* is the thermal component of the flow stress and is given in terms of how the yield stress σys is reduced by an internal or back stress, σ i , which arises from other strengthening mechanisms such as grain size or preexisting precipitate or dislocation structures. This gives the thermal component to be:
 $${\sigma ^*} = {\sigma _{{\rm{ys}}}} - {\sigma _i}\quad ,$$
as Cottrell and others Reference Kelly, Tyson and Cottrell1,Reference Cottrell and Bilby21 had accomplished previously. Regarding the second proposed change, rather than an empirical power law dependency of σ m where m might be 1 or more, the Cottrell approach uses a dislocation velocity v of:
 $$v \,=\, {v_0}{\rm{exp}}\left\{ { - {{{H_0} - {\sigma ^*}{V^*}} \over {kT}}} \right\}\quad ,$$
where the prefactor v
0 is a constant. Importantly, this approach incorporates temperature, where the previous one did not. Applying Eq. (4) to Eq. (1), with
 ${\dot \varepsilon _{\rm{p}}} = \rho bv$
(where ρ is the dislocation density), in the same way as was developed in Appendix A of the previous model,
Reference Gerberich, Stauffer, Beaber and Tymiak17
G
Ic becomes:
 $${G_{{\rm{Ic}}}} = \left\{ {{{{V^*}{\Psi _1}{\sigma ^*}{\varepsilon _{\rm{p}}}{v_0}} \over {b{{\dot \varepsilon }_{\rm{p}}}}}} \right\}{\rm{exp}}\left\{ { - {{{H_0} - \beta {\sigma ^*}{V^*}} \over {kT}}} \right\}\quad ,$$
with Ψ1 = η0ρ (with units m−2) and β a fitting parameter which will be discussed presently. To simplify, one can make the assumption that a failure criterion exists at a single value of Ψ0 = Ψ1εp v 0 b, such that
 $$G_{{\rm{Ic}}} = \left\{ {{{V^* \Psi _0 \sigma ^* } \over {b^2 \dot \varepsilon _{\rm{p}} }}} \right\}{\rm{exp}}\left\{ { - {{H_0 - \beta \sigma ^* V^* } \over {kT}}} \right\}\quad .$$
Here, Ψ0 is a fitting parameter as the dislocation density and preexponential velocity coefficient are unknown; however all contained parameters could be measured. Here, Ψ0 would have 1/s units and qualitatively is consistent with the order of strain rate effects observed. V* is typically in the 2–100b 3 range for body-centered cubic iron and its alloys at low temperature. Reference Garofalo22–Reference Gao26 However, it is unknown how σ* and V* will be impacted upon by high strain rates. Since σ* ∼ V*−1 in many cases, this might not be a serious deficiency outside the exponential as in Ref. Reference Gerberich, Stauffer, Beaber and Tymiak17, but inside as proposed here it is more problematic. There is caution here in that we have used two ways to describe strain rate, one through the dislocation density, ρbv, and one through Eq. (4), although these must be locally consistent. It should be noted that a fundamental relationship exists between K Ic and G Ic, such that G Ic = K Ic 2/E, where E is the elastic modulus. Roberts and Hirsch Reference Roberts and Hirsch11 have shown nearly a factor of three times change in fracture toughness with a change in strain rate of an order of magnitude. Similarly, a drop in K Ic of tungsten by a factor of two was observed by Gumbsch Reference Gumbsch5 with an order of magnitude increase in stress-intensity loading rate. These roughly translate into a drop in G Ic by a factor of 4–9 meaning that for some materials a linear drop in strain energy release rate might approach that depicted by Eq. (6). Finally, β represents the local stress variation away from the crack tip such that dislocation velocities decrease with distance after crack-tip emission, as the local stress at the crack tip driving emission is different from the stress in the plastic zone responsible for dislocation motion. This is partially due to the crack-tip stress gradient and partially the back stress from the prior dislocation emission. As a result there are unknown increasing stresses resulting from an increase in stress intensity during loading and unknown decreasing stresses from dislocation shielding. Assuming these nearly cancel for a simple analytical solution, a single value of β is picked with which to predict the effects of strain rate, test temperature, and thermally activated parameters on the DBTT. As such this is a two-parameter fitting procedure. The influence of the dislocation velocity on shielding of the crack-tip is proposed to be the dominant factor governing the temperature strain-rate dependence of the fracture toughness. It should be emphasized that because σ*V* appears both in the prefactor and in the exponential of Eq. (6) there is a strong coupling of the stress terms. Also still undetermined is the strain rate dependence of σ*V*, which may vary based on the material system. Therefore, at this stage of development, the prefactor term is necessarily ad hoc; however, the prefactor of Eq. (6) is still based upon fundamental ideas and can be improved as more definitive experimental data become available.
III. EXPERIMENTAL APPLICATIONS
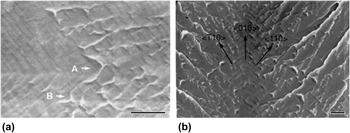
To test the model's accuracy, we use two sets of previously published data on Fe–3% Si. Reference Marsh and Gerberich8,Reference Marsh27 Fe–3% Si has been utilized frequently as a model material for studying the DBTT and hydrogen embrittlement as it can easily be produced as a single crystal. Figure 1(a) shows discontinuous crack growth in atmospheric hydrogen under sustained-load conditions. Reference Gerberich, Marsh and Huang28 The crack is growing from left to right in the <100> direction but locally in two <110> directions as shown in Fig. 1(b). At low stress intensities, the crack growth is almost exclusively on a single {100} plane but as it approaches higher local stress values, it produces twinning at the crack tip. The twins subsequently fracture on {100} planes in the twins which are out of plane. It should be emphasized that the dominant fracture process even well beyond the brittle-to-ductile transition temperature was cleavage for both coarse-grain polycrystals and single crystals as indicated in Fig. 1 but without arrest marks. Reference Marsh and Gerberich8,Reference Marsh27 This suggests that alternative crystallographic processes are not intervening.
Scanning Electron Microscopy (SEM) micrographs of Hydrogen-induced discontinuous crack growth in Fe-3% Si single crystal: (a) 1 μm steps for crack growth in the macroscopic <010> but locally in two <110> directions; (b) same orientations at higher KI, inducing twins and out of plane cracking on other {100} planes. Scale bar 5μm. (See Ref. 18, Parkins)

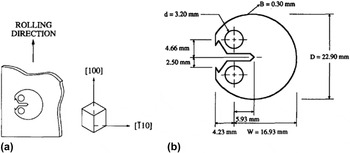
One data set contains polycrystalline Fe–3% Si with varying strain-rate and the second set contains single crystal Fe–3% Si that has been exposed to atmospheric hydrogen. For the polycrystals, Reference Marsh and Gerberich8 experimental techniques involved small compact round test samples 2.0-mm thick, in a temperature range of 160–300 K, loaded at an applied stress intensity rate of 0.15 to 1000 MPa m1/2/s. For reference, the orientation of the compact round fracture toughness samples with respect to the rolling direction is shown in Fig. 2. For the single crystals, Reference Marsh27 compact round specimens with a thickness of 4.8 mm were used, in a temperature range of 100–400 K at an applied stress intensity rate of 0.035 MPa m1/2/s, both with and without atmospheric hydrogen gas flow. Full experimental details can be found in the referred material. Reference Marsh and Gerberich8,Reference Marsh27,Reference Gerberich, Marsh and Huang28
Fe–3% Si coarse-grain-oriented samples: (a) rolling and crack growth directions; (b) compact round tension specimen dimensions (see Ref. Reference Marsh and Gerberich8).

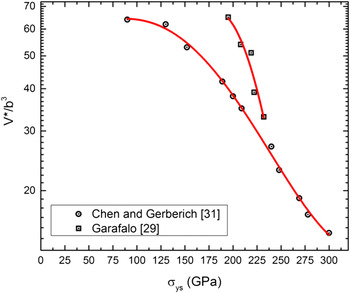
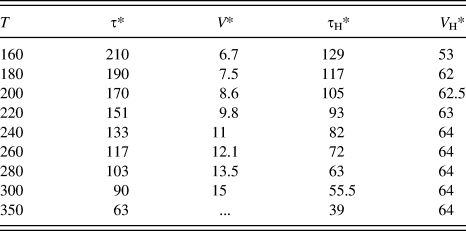
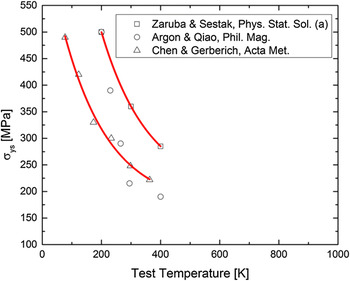
For the nonhydrogen-charged polycrystals, thermally activated rate parameters of σys, σ i , σ* are based on data from a study where the yield strengths from the coarse-grain crystals were consistent with reported yield strengths of single crystals at room temperature (300 MPa for both). With a reasonable value for the internal stress of σ i = 210 MPa, taken as one intermediate to those between Garafalo Reference Garofalo22 and Chen and Gerberich, Reference Chen, Atteridge and Gerberich23 it was also determined how V* varies with σ* as shown in Fig. 3. With these thermally activated parameters, as summarized in Table I, Figs. 3 and 4, measured stress intensity fracture toughness values could be compared as a function of strain rate. The only unknown besides Ψ0 and β was the strain rate. For the three selected applied stress intensity rates, strain rates were calculated at the elastic–plastic boundary to be 1.8 × 10⁻⁵/s, 1.6 × 10⁻³/s, and 0.11/s (see Appendix for details). Due to the low temperature, values of K I were much less than 30 MPa m1/2 for dislocation emission and yield strengths were greater than 200 MPa. The differentiated plane-strain estimate was used and evaluated at r = K Ic 2/3πσys 2 which would be appropriate for a perfectly elastic–plastic solid. It should be noted that this also applies to plane stress as noted in the Appendix. Strain rates were calculated using:
 $${\dot \varepsilon _{\rm{p}}} = {{2{{\dot K}_{\rm{I}}}{\sigma _{{\rm{ys}}}}} \over {E{K_{\rm{I}}}}}\quad ,$$
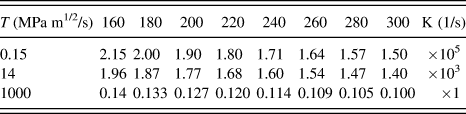
at a comparison stress intensity level of 30 MPa m1/2. For all three applied stress intensity rates of 0.1, 14, and 1000 MPa m1/2/s, calculated strain rates were determined over the entire loading range. These varied about ±15%/s for each case. For the lowest applied stress intensity rate, the strain rate ranged from 2.1 × 10⁻⁵/s to 1.5 × 10⁻⁵/s, for the intermediate from 1.964 × 10⁻³/s to 1.4 × 10⁻³/s, and for the highest from 0.14/s to 0.1/s. Since variations were small, singular average values of 1.8 × 10⁻⁵/s, 1.7 × 10⁻³/s, and 0.12/s were used to represent the stress intensity of 30 MPa m1/2.
Activation volumes in Fe–2.4% Si Reference Kircheim30 and Fe–3% Si Reference Marsh27 as a function of the effective shear strength at various temperatures. Red lines represent a power fit of the data.

Thermal activation stresses and activation volumes with and without hydrogen versus temperature.

Data for yield strength and activation volumes versus temperature as summarized from three sources. Reference Qiao and Argon13,Reference Marsh27,Reference Kircheim30 Red lines represent a power fit of the data.

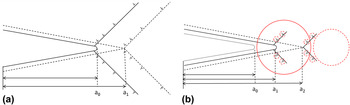
For the second part of the analysis, the parameters for the single-crystal hydrogen-charged samples are developed. All of the thermal activation parameters could be measured but were not presently available. Some assumptions regarding how these parameters are affected by hydrogen are made, based on experimental observations originally made by Barnoush and Vehoff Reference Barnoush and Vehoff29 on the ease of dislocation nucleation promoted by hydrogen during nanoindentation and the conceptual modeling of Kircheim Reference Kircheim30 on why this might be so. We again start by considering a physical picture of dislocation shielding of the crack tip, which is expected to proceed differently in the presence of hydrogen. The critical concept in Fig. 5 illustrates the difference between the no-hydrogen and the hydrogen-affected dislocation shieldings. As used by others, Reference Gumbsch5,Reference Samuels, Roberts and Hirsch9,Reference Roberts and Hirsch11,Reference Barnoush and Vehoff29 it is known that the faster dislocations move away from the crack tip the more shielding one can get. If it takes a high stress to nucleate the first dislocation, then this rapidly moves away from the nucleation site, e.g., the crack tip as illustrated in Fig. 5(a). Alternatively, if a low stress exists due to hydrogen promoting double kink nucleation at the crack tip, the dislocations nucleated move slowly, due to the much lower stresses, as they move out of the high concentration region. This is indicated in Fig. 5(b). As a result, much lower shielding exists with hydrogen than without.
Schematic of crack-tip shielding by dislocation for Fe–3% Si (a) without and (b) with hydrogen. Here, a 0, a 1, and a 2 are crack lengths at different stages of propagation, with length increasing with the subscript value for both parts (a) and (b). The circles in (b) represent a hydrogen atmosphere. The number of dislocations in (b) is significantly less than (a).

Quantification of this process required identifying how hydrogen affected both thermal activation parameters, σ* and V*. It is assumed that V* in the presence of hydrogen increased concordantly with the decrease in yield stress as the initial dislocations were emitted. This is indicated in Table I. Due to the local hydrogen environment, dislocation emission was much easier as has been discussed by Robertson, Sofronis and Birnbaum Reference Robertson and Birnbaum31,Reference Sofronis and Birnbaum32 and Kircheim. Reference Kircheim30 Also, it was recently confirmed by Barnoush and Vehoff Reference Barnoush and Vehoff29 that hydrogen reduced the stress for dislocation nucleation by 61.6%. Assuming this reduction was the same for both yield initiation and the thermal component of the flow stress, the tabulated results in Table I give much lower values of the thermal component of the flow stress, σH*. As a result, again assuming the scaling could be applied to Fig. 3, the activation volumes, V H*, in the presence of hydrogen were larger by a factor of four to eight. Note here that it was considered that the shielding was better represented by edge dislocations for the Mode I stress intensity at the crack tip. A discussion of the assumptions in this section can be found at the end of Sec. IV. Results and Discussion.
IV. RESULTS AND DISCUSSION
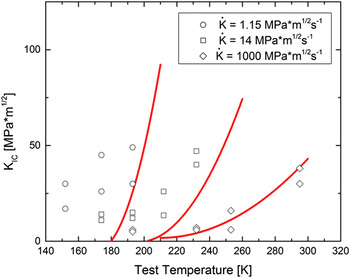
For the first objective of modeling strain rate effects, using the data from Figs. 3 and 4 and Table I, a two-parameter fit was conducted with some success for these polycrystalline samples. This was done for the parameter ranges cited in Table II with β and Ψ0 as the adjustable parameters. For the higher initial dislocation density or density of nucleation sites in the polycrystals, Ψ0 was higher as compared with the single crystals. Here, β was 2.3 and represents an elevation of the local stress associated with the crack tip stress field compared with the uniaxial stress of tension experiments which are normally used to measure dislocation velocities. Ideally, one would utilize a discretized dislocation velocity approach to represent realistic shielding of the crack. While the present analytical approach is inferior to such multiscale models, it nevertheless captures the shift in transition temperatures as shown in Fig. 6. It is noteworthy that the slower the applied stress intensity rate, the greater the deviation between the model and experimental data. This is due to the inapplicability of a few of the thermal activation parameters which were measured on other polycrystalline samples Reference Chen, Atteridge and Gerberich23,Reference Marsh27 because they do not allow for dislocation–defect interactions, which are maximized at slower test rates. In terms of the K Ic shift, one finds at 30 MPa m1/2 a shift of 50 K and 100 K from the lowest to the intermediate and highest strain rates, both experimentally and with Eq. (6). One can rationalize why an upward shift of the DBTT with increasing strain rate results if this decreases the amount of time for dislocation mobility, thereby decreasing the amount of crack-tip shielding. As an aside, a further change might be expected if hydrogen changed the product of the effective stress times the activation volume, but this will be addressed later. It should be pointed out that a similar but different approach has been used on pure Fe, resulting in a different temperature regime. Reference Tanaka, Tarleton and Roberts33

Effect of stress-intensity loading rate on coarse-grain fracture toughness showing a shift of 100 K in DBTT with an increase of three orders of magnitude in rate in polycrystalline Fe-3%Si. Solid red curves represent KIc evaluated using Eq. (6) and parameters from Tables I and II for these three experimental loading rates.

Tanaka et al. Reference Tanaka, Tarleton and Roberts33 approached this problem for pure Fe in two ways. First they suggested a single value of activation volume, V* = 20b 3, and back-calculated the stress-dependent activation energy from the shift in the DBTT to be 0.33 eV. Second, they also utilized an empirical power law for stress using a single activation energy (dictated by the transition temperature variation with strain rate). The approaches are somewhat different from the present model, which utilizes the activation volume as a function of test temperature, giving a stress-dependent variation in the activation volume. However, the average value of H σ was similar, i.e., 0.37 eV in this work to their calculation of 0.33 eV for the first method and 0.48 eV for the second. Differences also might be expected since their material was pure iron whereas the Fe–3% Si alloy used in this study had substantially higher yield stress. Two additional models Reference Xin and Hsia34,Reference Hartmaier and Gumbsch35 have been proposed, with the first giving a rapid rise in toughness for silicon and the second involving two models of discrete dislocation dynamics and a continuum viscoplastic model capable of larger-scale plasticity. Hartmaier and Gumbsch's Reference Hartmaier and Gumbsch35 first approach is similar to the present model, offering both empirical and thermodynamic dislocation velocity laws. They used an empirical law which led to fairly abrupt temperature transitions as appropriate to bulk silicon. This avoided the coupled stress-activation volume term used in the proposed formulation here. By using a temperature-dependent stress exponent to form a viscoplastic law they also suggested this could be used for soft transitions as well. It would be of considerable interest to evaluate both approaches with the needed parameters all measured on a material exhibiting a soft transition as shown in Figs. 6 and 7.
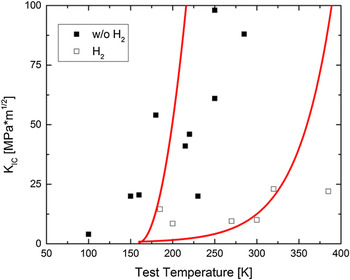
KIc vs. temperature at constant applied stress intensity rate for single crystal Fe-3% Si with and without the presence of gaseous hydrogen. Solid red curves represent KIc as determined by Eq. (6) using parameters from Tables I and II for these two cases of with and without gaseous hydrogen.

For the second objective of modeling hydrogen effects, with the parameters of Tables I and II, calculations of the strain energy release rate were conducted and compared with single crystal fracture toughness values in Fig. 7. Here, β was 3.08 without hydrogen and 0.58 with hydrogen. The model fit to the data using a two-parameter fit does capture both the low and higher temperature results with hydrogen producing a 20 K K Ic shift at very low temperature and a 150 K K Ic shift at higher temperatures. It is emphasized that even though the same activation energy of 0.8 eV is used for both cases with and without hydrogen in Table II, the stress-dependent activation energy H σ* is much different. Here it is 0.368 eV without hydrogen compared with 0.521 eV with hydrogen. The change in H σ* and β is consistent with hydrogen trapping or slowing of dislocations which provide less dislocation shielding and higher DBTT temperatures.
A discussion of the assumptions regarding the effects of hydrogen embrittlement is needed, since the situation is complex and they are crucial for the results presented in Fig. 7. To reiterate, we have assumed that hydrogen decreases σ* and increases V*, such that their product does not change largely. Nibur et al. Reference Nibur, Bahr and Somerday36 demonstrated that hydrogen softens face-centered cubic (FCC) austenitic stainless steel, and Barnoush and Vehoff Reference Barnoush and Vehoff29 have found similar results in body-centered cubic (BCC) Fe–3% Si. Theoretically, Kircheim, Reference Kircheim30 Devincre and Roberts, Reference Devincre and Roberts12 and Itakura et al. Reference Itakura, Kaburaki, Yamaguchi and Okita37 also found softening in BCC iron. Alternatively, as deformation proceeds, the resistance to dislocation motion with increasing concentrations of hydrogen can cause hardening, as proposed by Kircheim. Reference Kircheim30 Some theoretical and experimental studies Reference Barnoush and Vehoff29,Reference Robertson and Birnbaum31,Reference Sofronis and Birnbaum32 have strongly suggested that hydrogen should lower both the flow stress and the activation volume. Other studies have theoretically and experimentally concluded that hydrogen should either soften or harden the host material depending on the circumstance. Reference Devincre and Roberts12,Reference Barnoush and Vehoff29–Reference Sofronis and Birnbaum32,Reference Nibur, Bahr and Somerday36 We observe, however, that in both cases, the DBTT was a soft one, i.e., gradual over a considerable temperature range. What should be illustrated at this point is that the effects of hydrogen on crack-tip plasticity require additional study. Nevertheless, the moderate success of the model fit in Figs. 6 and 7 should support the physical interpretation outlined in the Methods section and Fig. 5. Regarding the fitting of Figs. 6 and 7, we emphasize that for the polycrystalline and single crystal data that differences in impurity content, initial dislocation content, and unrevealed subsurface grain boundaries could have caused some of the variation in the values of Ψ0 and β utilized.
V. SUMMARY
It is potentially significant that this simple modeling predicts that the DBTT with hydrogen closely approaches that which is hydrogen-free at low temperature. A macroscopic interpretation of this could be that hydrogen does not decrease the cohesive properties of iron as described by the theory of hydrogen-enhanced decohesion (HEDE). Under HEDE, hydrogen causes a substantial change in the Griffith value associated with little or no plasticity. One must acknowledge, however, that there are too many assumed or unknown factors that require substantiation prior to making such conclusions. A few of these are enumerated below as needing critical attention.
-
(i) In Table II, it is seen that all values are the same both with and without hydrogen except for β and the hydrogen-affected thermal activation parameters, σ*V*. Comparing β for no hydrogen (3.08) to with hydrogen (0.58) might imply that hydrogen should really decrease the activation volume even for the assumed edge dislocations as they move away from the crack tip region. This requires additional experimental and theoretical study.
-
(ii) Experimentally, the thermally activated parameters are best measured on the same samples that have produced fracture toughness results, including the variation of σ* and V* with temperature and strain rate. With validated comparison between nanoindentation and uniaxial tests, this could be possible.
-
(iii) Theoretically, additional studies of dislocation shielding using discretized dislocation dynamics and/or density functional theory and edge dislocations with and without hydrogen would be insightful.
To summarize, using previously published data, insight as to how dislocation shielding affects the ductile to brittle transition of Fe–3 wt% Si both without and with the involvement of hydrogen is presented. The key, as others have postulated above, is thermal activation of dislocation processes at the crack tip. The most important conclusion is that by assuming that hydrogen has the effect of reducing dislocation shielding of the crack tip, utilizing the proposed model, we have achieved a reasonable fit of the data.
APPENDIX: DETERMINATION OF THERMAL-ACTIVATION PARAMETERS AS DEPENDENT ON YIELD STRENGTH
Use of the yield stress in determining the effective stress and the strain rate from Eqs. (6) and (7) was invoked by choosing the selected distance from the crack tip to be the elastic–plastic boundary for convenience. This is accomplished here using a plane-strain estimate for the early stages of yielding, knowing that the same equation also applies to plane stress at the later stages. From McClintock and Irwin's early article on plasticity at crack tips, Reference McClintock and Irwin38 the continuum representation of the strain distribution for the Mode I analogy of the Mode III result is
 $${\varepsilon _{\rm{p}}} = {{{\sigma_{\rm{ys}}}} \over E}\left( {{{{R _{{\rm{p}}}}} \over r} - 1} \right)\,\sim\,{{{R_{\rm{p}}}} \over r}{{{\sigma _{{\rm{ys}}}}} \over E}\quad ,$$
where R
p is the plastic zone diameter, σys and E are the yield strength and modulus, and r is the distance from the crack tip. Given that
 ${R_{\rm{p}}} = {{K_{\rm{I}}^2} \over {3{\rm{\pi }}\sigma _{{\rm{ys}}}^2}}$
using the inverse method approximation for the plastic zone size, this gives
 $${\varepsilon _{\rm{p}}} = {{K_{\rm{I}}^2{\sigma _{{\rm{ys}}}}} \over {3\pi \sigma _{{\rm{ys}}}^2Er}}\quad .$$
This is differentiated with respect to time giving dε/dt as
 ${{\dot \varepsilon }}$
at R
p = r to be
 $$\dot \varepsilon = {{2{{\dot K}_{\rm{I}}}{\sigma _{{\rm{ys}}}}} \over {E{K_{\rm{I}}}}}\quad ,$$
which is Eq. (7) in the text. A value of K I ≃ 30 MPa m1/2 was used which approximately represented the mean value of K I applied. Choosing a different value of K I would only shift the curves in Figs. 6 and 7 slightly, which could be shifted back with a slight variation of Ψ0. The results for temperature varying from 160 to 300 for the three applied stress intensity rates used are given in Table A. Values of yield strength from Fig. 3 were utilized.
Values of strain rate versus temperature for three stress intensity rates.

A tabulation of the values at 20 K intervals for the extremes is shown in Table A.