I. INTRODUCTION
Colloidal Deposition Process (CDP) is a solution based methodology in which nanoparticles (NPs) can be used as building blocks toward the production of advanced devices, NPs can be assembled to form thin films, for instance. This method is versatile because it allows the use of inexpensive deposition process, such as spin-coating or dip-coating, on planar and nonplanar substrates, integrating low-cost approaches to produce advanced devices. Reference Kovalenko, Manna, Cabot, Hens, Talapin, Kagan, Klimov, Rogach, Reiss, Milliron, Guyot-Sionnnest, Konstantatos, Parak, Hyeon, Korgel, Murray and Heiss1 Our research group has been reporting the successful use of CDP of nanocrystals synthesized in organic media to produce photoanode thin films for water splitting devices, as well as to prepare transparent conducting oxide (TCO) thin films, for example. Reference Gonçalves and Leite2–Reference Conti, Chiquito, da Silva, Longo and Leite6
The pursuit of better optoelectronic devices is associated to the pursuit of materials that exhibit high transparency in the UV–visible region along with low electrical resistance. In this sense, a metal oxide semiconductor that has attracted attention and matched those requirements is the tin oxide, which has a band-gap of ∼3.6 eV (298 K). Reference Batzill and Diebold7,Reference Amma, Vaidyan and Manoj8 Over the last decades, researchers have been reporting that the change in electrical conductivity of semiconductor oxides can be strongly affected by the controlled addition of impurities, Sb for the SnO2 system (ATO—antimony-doped tin oxide), for instance. Reference Singh, Mehra, Yoshida and Wakahara9–Reference Wang, Brezesinski, Antonietti and Smarsly23 Nowadays, indium tin oxide (ITO) is widely used in advanced optoelectronic devices and it is well known that its price is very high and ATO has been explored as a potential replacement for ITO, both classified as TCO materials. Luo et al. successfully demonstrated the use of ATO nanocrystals, which is synthesized in organic media, in the production of optoelectronic devices and its potential to replace commercially available ITO transparent electrodes in organic light-emitting diode (OLED) displays. Reference Luo, Bozyigit, Wood and Niederberger24
TCOs are electricity conductors either due to the intrinsic defects or extrinsic dopants. The extrinsic dopant content in-general varies from 1020 to 1021 cm−3 and the electrical resistivity is in the order of 10−4 Ω cm for TCOs suitable for applications. In addition, the charge carrier concentration (n) is limited by the dopant solubility and the electronic mobility is limited by scattering of the charge carriers in the lattice. Several electron scattering mechanisms could be operative in a TCO such as scattering by ionized impurities, neutral centers, thermal vibrations of the lattice, structural defects, and grain boundaries, depending on the carrier concentration and materials crystal quality. Reference Hoel, Mason, Gaillard and Poeppelmeier25
Several articles in the literature reported the influence of the thickness on the electrical resistivity of the ATO thin film prepared by CDP and in a previous work we demonstrated that it is possible to obtain ATO ultrathin films (40 nm). In the present work, we are investigating the electronic transport mechanism for ATO ultrathin films produced by CDP of nanocrystals synthesized in organic medium. Reference Gonçalves and Leite2–Reference Conti, Chiquito, da Silva, Longo and Leite6,Reference Giraldi, Escote, Maciel, Longo, Leite and Varela21
II. EXPERIMENTAL PROCEDURE
NP synthesis and ultrathin film preparation: we reported the synthesis methodology and the ultrathin film preparation procedure in previous works. Under these circumstances, for more details on these matters see Refs. Reference Conti, Chiquito, da Silva, Longo and Leite6 and Reference Niederberger26–Reference Pinna28. Briefly, under a controlled atmosphere, SnCl4 and SbCl3 were stirred in a vessel with benzyl alcohol and then heated to 150 °C/48 h in a silicon oil bath. The product of this reaction was washed with tetrahydrofuran (THF) and re-dispersed in THF with oleylamine at 16 mg/mL. The thin film deposition is performed using a colloidal suspension on a pretreated glass substrate with oleic acid. A dip-coater withdraws the substrate from the colloidal suspension at a controlled rate, and the film thickness is dependent on the rates, i. e., different rates result in different thickness. The 40, 45, and 71 nm thin films were obtained under 32, 20, and 5 mm/s rates, respectively.
Characterization: The film morphology, including cross-sectional analysis of the cleaved sample, was characterized by field emission scanning electron microscopy (FEG-SEM; Inspect F-50, FEI Company, Eindhoven, the Netherlands). The crystalline phase and crystallite size were identified by x-ray diffraction (XRD; Rigaku D-Max 200 using Cu Kα radiation, Rigaku Analytical Devices Inc., Wilmington, Massachusetts). The ATO colloidal dispersion was deposited onto a carbon-coated copper grip and characterized by transmission electron microscopy (TEM) and high resolution transmission electron microscopy (HRTEM) operated at 200 kV (FEI—TECNAI F20, FEI Company). The atomic force microscopy (AFM) characterization of the thin film was performed using a Nanosurf Easyscan 2 equipment (Nanosurf AG, Liestal, Switzerland). Resistance and Hall measurements were taken across the sample at temperatures ranging from −260 to 27 °C (13–300 K ± 0.1 K), using a closed-cycle helium cryostat and at a pressure lower than 5 × 10⁻⁶ Torr. A digital SourceMeter (Keithley 2400, Keithley Instruments, Cleveland, Ohio) operating in the four-probe mode was used to eliminate the undesired resistances of the measuring circuit. Besides, the thin film metallic contacts were prepared using lithographic techniques. A gold–nickel metallic alloy (ratio 1:1) was used as contact and was prepared using an Edwards auto 306 e-beam evaporator (Edwards Global, West Sussex, United Kingdom).
III. RESULTS AND DISCUSSION
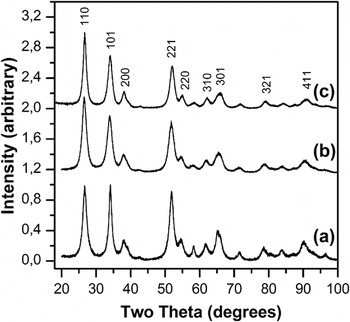
The crystal phase investigation was carried out through the XRD analysis of the as-synthesized nondoped and ATO, as well as a thermal annealed ATO nanopowder (500 °C at 1 °C/min for 2 h), which is shown in Fig. 1. All diffraction patterns [Fig. 1(a)] match the cassiterite structure of SnO2 (PDF No. 41-1445) and one may observe that a solid solution was formed due to the absence of other crystalline phases [see Fig. 1(b)]. The average crystalline size of the nanopowders, which were evaluated from the (110) and (101) peaks using the Debye–Scherrer formula, showed dimensions of 5.2 and 4.9 nm, respectively, suggesting the presence of elongated crystals. After thermal treatment, small crystal growth occurred and no other phases were identified, as indicated in the Fig. 1(c). One may note that no phase segregation and also no peak shift occurred.
(a) XRD of pure SnO2, (b) XRD of SnO2:9 mol% Sb powder before thermal annealing and (c) SnO2:9 mol% Sb powder after thermal annealing.

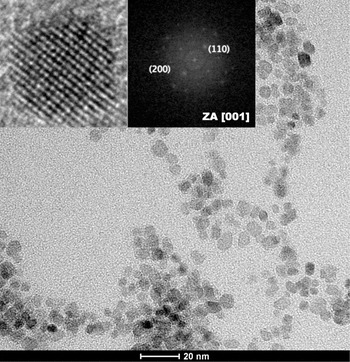
The bright field TEM (BF-TEM) image displayed in Fig. 2 shows highly dispersed and crystalline ATO NPs. The evaluation of size distribution reveals elongated and well faceted particles with a mean length of 6.5 nm, mean width of 4.4 nm, and mean aspect ratio of 1.5. In addition, HRTEM analysis [see the representative HRTEM image and the fast Fourier transform (FFT) of ATO in the inset of Fig. 2] indicated the formation of nanocrystals and the FFT analysis indicated the particle orientation along the [001] zone axis. The BF-TEM and HR-TEM analysis are in good agreement with the XRD analysis, confirming the formation of well crystallized ATO NPs, with elongated morphology.
BF-TEM image of crystalline ATO NPs. The inset shows the HRTEM image and the FFT of an ATO nanocrystal oriented along the [001] zone axis.

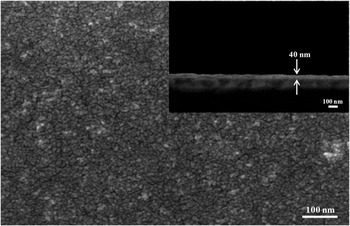
Figure 3 shows an FEG-SEM image of a thin film obtained according to the methodology detailed on the experimental section. One may note that the film has no cracks and also that the deposition occurs homogeneously along the substrate surface and, it is possible to observe the presence of aggregated ATO nanocrystals. In the inset, thin film cross section micrograph of a sample with 9 mol% Sb. The ultrathin films produced are polycrystalline and they were not textured.
Image of SEM (FEG-SEM) with 350,000-fold increase and in the inset, a ATO (9 mol% Sb) thin film cross section.

The FEG-SEM inset micrograph illustrated in Fig. 3 shows the cross section of the thinnest film obtained from stable colloidal suspensions, and it indicates that the film has a thickness of 45 nm and that it was possible to obtain a homogeneous and uniform coating. The results obtained with these ultrathin films show promising potential for the application of ATO NPs synthesized in organic medium. Reference Conti, Chiquito, da Silva, Longo and Leite6
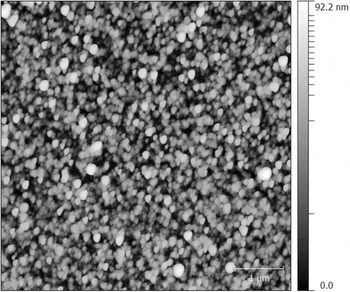
In addition, the ultrathin film topography was also investigated via AFM, as demonstrated in Fig. 4. All samples presented a smooth and crack-free surface and the agglomerate size and roughness were analyzed by means of the Gwyddion software. Through the root mean square (RMS) average of height deviations, taken from these images, this software evaluates the surface roughness (RMS), which for the films studied here presents a mean value of 9 nm.
AFM image of the ATO ultrathin film (9 mol% Sb) topography obtained via tapping mode in air.

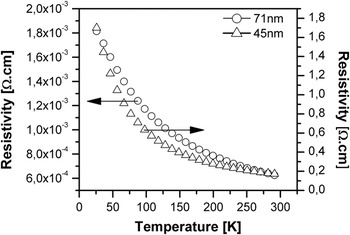
Giraldi et al., prepared ATO thin films by the polymeric precursor method and reported its relationship with the film microstructure, with the charge transport mechanism and the gas detection sensibility. Reference Giraldi, Escote, Maciel, Longo, Leite and Varela21 It was shown that the electrical resistivity varies with the film thickness and that it is inversely proportional to the film thickness, and thicker films have lower values of electrical resistivity. Figure 5 illustrates curves of electrical resistivity as a function of temperature for the film with thickness of 71 and 45 nm, both with 9 mol% Sb. One could observe that the films exhibit typical semiconductor material behavior, the electrical resistivity decreases when temperature increases. The ρ values obtained at room temperature are 1.85 × 10⁻³ and 1 × 10⁻¹ Ω cm, respectively, and it can be noted that there is a significant change in the electrical resistivity when the film thickness increases. Regarding the results of ρ for the 45 nm film, it is noteworthy that most studies reported so far show no electrical characterization results for a film of this thickness produced from colloidal nanocrystals. Giraldi et al. reported that for thin films derived from aqueous colloidal suspensions it was only possible to measure electrical signals from films thicker than 71 nm, which indicates the potential of the methodology used in this report and the use of nanocrystals as building blocks for advanced devices. Reference Giraldi, Escote, Maciel, Longo, Leite and Varela21 Moreover, the authors suggest that the decrease in electrical resistivity when the film thickness increases is related to the carrier charge scattering on the surface.
Electrical resistivity curves as a function of temperature, films of 45 nm and 71 nm thickness.

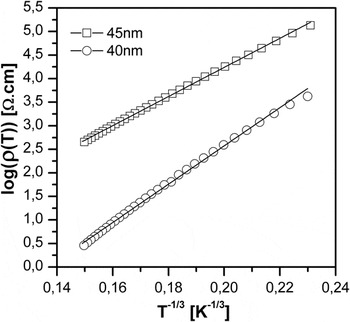
To investigate the transport properties of electrical charge in ultrathin films, (films with thickness of 40 and 45 nm), we evaluated log ρ as a function of T −1/3. The resistivity data were fitted to a generalized form of the activated hopping model, in which the electrical resistivity is given by
 $$\rho \left( T \right) = {\rho _0}\,\exp {\left( {{{{T_{{1 \mathord{\left/ {\vphantom {1 {1 + d}}} \right. \kern-\nulldelimiterspace} {1 + d}}}}} \mathord{\left/ {\vphantom {{{T_{{1 \mathord{\left/ {\vphantom {1 {1 + d}}} \right. \kern-\nulldelimiterspace} {1 + d}}}}} T}} \right. \kern-\nulldelimiterspace} T}} \right)^{{1 \mathord{\left/ {\vphantom {1 {1 + d}}} \right. \kern-\nulldelimiterspace} {1 + d}}}}\quad ,$$
where ρ0 is the residual electrical resistivity, T 1/1+d is a constant, and d the system dimension. Figure 6 illustrates the log of the electrical resistivity curves as a function of T −1/3. The linear behavior of the ln ρ(T) versus T −1/3 plot suggests that the conductivity is due to Mott's two-dimensional (2D) noninteracting variable range hopping (VRH), through all temperature ranges (13–300 K). In the 2D VRH regime, the characteristic temperature (T 1/1+d ) is related to the density of states at the Fermi level N(E F) and the localization length ξ is described as:
 $${T_{{1 \mathord{\left/ {\vphantom {1 3}} \right. \kern-\nulldelimiterspace} 3}}} = {{13.8} \mathord{\left/ {\vphantom {{13.8} {{k_{\rm{B}}}}}} \right. \kern-\nulldelimiterspace} {{k_{\rm{B}}}}}N\left( {{E_{\rm{F}}}} \right){\xi ^2}\quad .$$
Electrical resistivity curves as a function of T 1/3, films of 40 and 45 nm thickness.

The temperature dependence of the optimum hopping distance [R(T)] is given by:
 $$R\left( T \right) = {1 \mathord{\left/ {\vphantom {1 3}} \right. \kern-\nulldelimiterspace} 3}\xi {\left( {{{{T_{{1 \mathord{\left/ {\vphantom {1 3}} \right. \kern-\nulldelimiterspace} 3}}}} \mathord{\left/ {\vphantom {{{T_{{1 \mathord{\left/ {\vphantom {1 3}} \right. \kern-\nulldelimiterspace} 3}}}} T}} \right. \kern-\nulldelimiterspace} T}} \right)^{{1 \mathord{\left/ {\vphantom {1 3}} \right. \kern-\nulldelimiterspace} 3}}}\quad .$$
Based on data fitting, the localization length and the optimum hopping distance at room temperature is 5.48 and 8.9 nm, respectively, for the 45 nm film thickness and 8.23 and 10.2 nm, for the 40 nm film thickness.
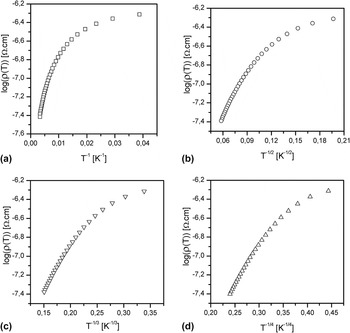
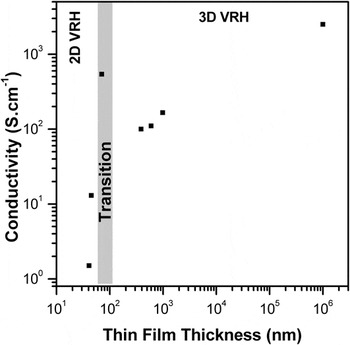
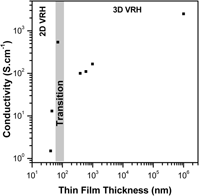
Figure 7 shows (a) log(ρ) as a function of T −1 (K−1), (b) log(ρ) as a function of T −1/2 (K−1/2), and (c) log(ρ) as a function of T −1/4 (K−1/4) for a 71 nm thick film. One could note that the curves do not match the good data fitting for the mechanisms proposed in the literature and also that the behavior of the 71 nm film, which has no good fitting on the VRH 2D model or VRH 3D model, could be related to a transition region (two dimension to three dimension). This transition region is under investigation and will be reported in detail in a future work. Figure 8 illustrates the thin film conductivity as a function of the thickness for this work and others previously reported by our group. Reference Gonçalves and Leite2–Reference Conti, Chiquito, da Silva, Longo and Leite6 This figure shows a strong dependence of the conductivity in relation to the film thickness and we clearly observe the presence of regions dominated by the 2D VRH and 3D VRH mechanism, in addition we suggest that there is a transition region around 70 nm. This transition area is under investigation and shall be reported in a future work.
Values of (a) log(ρ) as a function of T −1 (K−1), (b) log(ρ) as a function of T −1/2 (K−1/2), (c) log(ρ) as a function of T −1/3 (K−1/3) k film and (d) log(ρ) as a function of T −1/4 (K−1/4) for a 71 nm thick film. The curves have no good fitting on the VRH 2D model or VRH 3D model.

Conductivity as a function of the thin film thickness and its correlation with the Mott's 2D and 3D VRH model.

Indeed, in the earlier works reported by our group, we observed indicatives of the Sb segregation for preferable facets, which were correlated to the nanocrystal shape and the concentration of doping element. The electrical resistivity curves as a function of temperature show the typical behavior of highly doped and highly compensated semiconductors in the range of 9 mol% Sb. Skoromets et al. investigated the conductivity in ATO pellets obtained from nanocrystals synthesized in organic media using direct current (DC) and terahertz regime. Reference Skoromets, Nemec, Kopecek, Kuzel, Peters, Fattakhova-Rohlfing, Vetushka, Muller, Ganzerova and Fejfar29 The methodology used by authors can reveal important information on the charge carrier scattering process in the volume of the NPs and on its boundary interactions. Hence, one of the interesting results, which they reported, is that the DC conductivity is controlled mainly by interfaces rather than by the conductivity inside the NPs.
Additionally, the data reported here indicate that the electron hopping is in the order of the NP size and pores. As a result, the data suggest that electric charge transport mechanism in this system is occurring preferably by the particles surface or boundary, as also observed by Skoromets et al., indicating that the average hopping is in the order of the average impurity separation distance. Besides, this effect does not vary as a function of the temperature, since the VRH mechanism by thermal activation was not observed in the studied temperature range (13–300 K). One may note that such a mechanism has not yet been reported for this system, i.e., the ultrathin film obtained by the deposition of colloidal nanocrystals synthesized in organic media. In addition, the 2D VRH behavior suggests quantum confinement in one dimension, which tends to a transition to the 3D VRH behavior as the film thickness increases.
IV. CONCLUSIONS
We have presented an investigation on the charge transport mechanisms of ultrathin films deposited by CDP from highly crystalline ATO NPs synthesized by the solvothermal method in organic media, and the successful use of this material as nanoscale building blocks for ultrathin film deposition. The films with 70 nm of thickness showed good data fitting to Mott's 2D noninteracting VRH at the entire measured temperature range (13–300 K). Further, the electric charge transport mechanism is occurring preferably by the nanocrystals surface or boundaries. Finally, it is important to mention that the 2D VRH behavior was not yet observed for ultrathin films prepared by the CDP.
ACKNOWLEDGMENTS
FAPESP/CEPID 2013/07296-2 and CNPq are gratefully acknowledged.