Introduction
Mithun (Bos frontalis) is an important semi-domesticated animal species found in hilly region of India, China, Myanmar, Bhutan and Bangladesh. Within Bhutan, they are reared in small numbers throughout the country. Unlike other countries where Mithun is kept for meat purpose, utility of the species in Bhutan is unique. They are kept for crossbreeding with traditional Nublang cattle (Bos indicus) to produce hybrids for milk and draft purposes. These crosses are well adapted to sloppy terrain and transhumance system of cattle management in the country. The documentation on this breeding practice exists as early as the seventeenth century and also vividly described in Report of British Mission to Bhutan (RGoB, 2002).
Mithun is believed to have originated from wild Indian gaur (Bos gaurus) more than 8 000 years ago (Simoons, Reference Simoons1984; Mondal and Pal, Reference Mondal and Pal1999; Dorji et al., Reference Dorji, Mannen, Namikawa, Inamura and Kawamoto2010; Tanaka et al. Reference Tanaka, Takizawa, Murakoshi, Dorji, Nyunt, Maeda, Yamamoto and Namikawa2011). The literature on genetic diversity studies of Mithun is generally scarce. Mithun in India are classified into four distinct strains; Arunachalee, Mizorami, Nagami and Manipuri based on their phenotypic and genetic characterization (Bhusan et al., Reference Bhusan, Sharma and Rajkhowa2009). And considering the proximity and initial source of animals, Mithun in Bhutan are likely of Arunachalee strain.
To meet the demand for Mithun bulls and sustainable management of Mithun genetic resources in the country, two conservation farms were established in mid 1970s at Wangdigang, Zhemgang (WZ) and Arong, Samdrupjongkhar (AS) (Figure 1). These farms produce and supply Mithun bulls to farmers for selective inter-breeding and for production of frozen semen for artificial insemination on Nublang cattle (Bos indicus). The animals are maintained under free range and forest grazing and follow random mating. The population of Mithun in Bhutan was 1 559 (DoL, 2013) and declining (1 826 (DoL, 2006)). Therefore in view of the small and declining population size, this study attempted to assess the genetic diversity of Mithun population in Bhutan to provide insights into conservation and sustainable management of the species in the country.
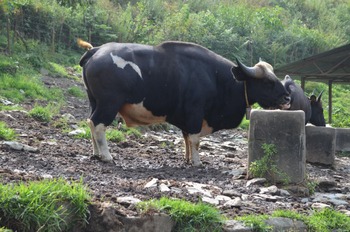
Mithun bull at Regional Mithun Breeding Farm, Arong, Bhutan.

Materials and methods
Samples, microsatellite DNA markers and polymerase chain reaction (PCR) amplification
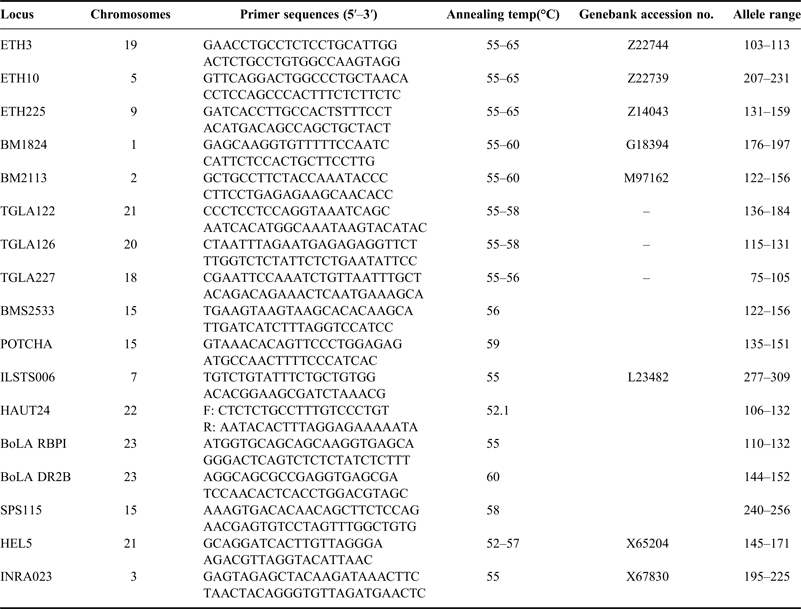
A total of 105 tail hair samples, including 36 from AS and 69 from WZ, were collected. These hair samples were put into an individually labelled envelope and stored at room temperature. A total of 17 highly polymorphic microsatellite DNA markers recommended by FAO (2011) for cattle and validated in Mithun (Qu et al., Reference Qu, Nguyen, He, Huang, Yuan, Zhang and Zan2012) were used in this study (Table 1). Two-step PCR was performed (Arandjelovic et al., Reference Arandjelovic, Guschanski, Schubert, Harris, Thalmann, Siedel and Vigilant2009) for multiplex and individual markers separately. Two sets of multiplex markers, set A containing nine non-labelled markers (ETH225, ETH10, ETH3, BM1824, BM2113, SPS115, TGLA122, TGLA126 and TGLA227) and set B containing eight non-labelled markers (BMS2533, POTCHA, ILSTS006, HEL5, HAUT24, INRA023, BoLADRBP1 and BoLADR2B), were used to perform the first PCR. In 20 µl of master reaction mixture, 10 µl of 2× buffer, 4 µl of dNTPs, 0.4 µl of polymerase (KOD FX Enzyme and kit, Toyobo Co., Ltd., Tokyo, Japan), 1.35 µl each of 20 p forward and reverse primers and H2O were added. The mixture was divided in 10 µl aliquots and added 6 hair roots per sample (in duplicates) to test repeatability. PCR was performed with following thermal-cycling conditions: 94 °C for 2 min, 35 cycles of (98 °C for 10 s, 58 °C for 30 s and 68 °C for 30 s) and 10 °C hold. The products of the first PCR were stored at 4 °C or −20 °C until the second PCR.
Primer sequences, chromosomes numbers and annealing temperature for 17 microsatellite loci employed for diversity analysis of Mithun population in Bhutan.

For the second PCR, 12.5 µl reaction mixture contained 6.25 µl of ×2 buffer, 2.5 µl of dNTPs, 0.25 µl of polymerase (KOD FX Enzyme and kit, Toyobo Co., Ltd., Tokyo, Japan), 0.375 µl each of 5 p forward and labelled reverse primers, 2.250 µl H2O and 0.5–1.0 µl of the first PCR products. Thermal-cycling conditions for this reaction was set up as 94 °C for 2 min, 45 cycles of (98 °C for 10 s, 58 °C for 30 s and 68 °C for 30 s) and hold at 10 °C. The PCR products were stored at 4 °C/−20 °C.
A loading cocktail containing 960 µl of Formamide (FA) and 9.0 µl of molecular size marker (ROX 400HD) enough for 6 runs (96 samples) were prepared. Each well contained 9.8 µl aliquots of loading cocktail and 1 µl of the second PCR products in 96 well plates. They were heated at 95 °C for 3 min and immediately snap cooled in ice for few minutes and applied to Genetic Analyzer (ABI PRISM 3130xl) to read the fragment size. Microsatellite data and allele scoring were performed using GeneMapper software (Version 4.1).
Statistical analysis
Microsatellite data were analyzed to estimate the observed number of alleles (Na), the number of effective alleles (Ne), observed (Ho) and expected (He) heterozygosity, F-statistics, Hardy-Weinberg equilibrium (HWE) and Nei's genetic distance using GenAlEx 6.501 software (Peakall and Smouse, Reference Peakall and Smouse2006, Reference Peakall and Smouse2012). Polymorphic information content (PIC) value of marker was calculated using Cervus version 3.0.6 (Kalinowski et al., Reference Kalinowski, Taper and Marshall2007). Mode-shift test for the distribution of allele frequencies classified into 10 frequency classes was performed using BOTTLENECK 1.2.02 (Piry et al., Reference Piry, Luikart and Cornuet1999).
STRUCTURE version 2.3 (Pritchard et al., Reference Pritchard, Stephen and Donnelly2000) was employed for Bayesian identification of genetic clusters and the degree of admixture that best fit the data. Ten independent runs were performed for K = 2 with burn-in period of 100 000 iterations followed by 200 000 iterations of the Markov chain Monte Carlo algorithm. STRUCTURE HARVESTER (Earl and vonHoldt, Reference Earl and vonHoldt2012) was used to reformat data using Evanno method (Evanno et al., Reference Evanno, Regnaut and Goudet2005). CLUMPP version 1.1 (Jackobsson and RosenBerg, Reference Jackobsson and Rosenberg2007) was employed to obtain optimal matrices for 10 replications for K = 2 and this output file was visualized using DISTRUCT version 1.1 (Rosenberg, Reference Rosenberg2004).
Results and discussion
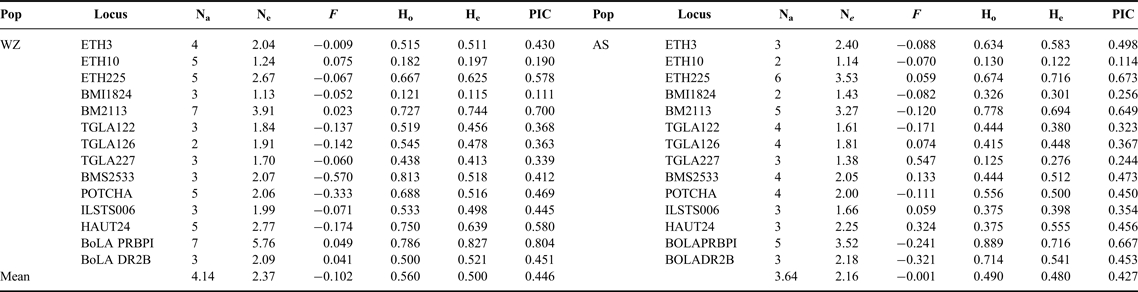
A total of 14 loci were successfully amplified from hair samples while three loci (SPS115, HEL5 and INRA023) failed. The genetic variability estimates (Ho, He and inbreeding coefficient (F)) by marker and populations are presented in Table 2. Na per locus ranged between 2 (TGLA126) and 7 (BM2113 and BoLADRBP1) in WZ and between 2 (ETH10 and BM1824) and 6 (ETH225) in AS. Mean Na per locus was 4.14 and 3.64 for WZ and AS, respectively. These parameter estimates of the two farms were similar, which is obvious considering the same source of the animals. The microsatellite loci in current study as per Barker (Reference Barker1994) may be useful to evaluate the genetic diversity of Mithun in Bhutan. The overall N a of Bhutanese Mithun population was lower than Yunnan Mithun (7.88) (Qu et al., Reference Qu, Nguyen, He, Huang, Yuan, Zhang and Zan2012).
Number of alleles (Na, observed; Ne, effective), heterozygosity (Ho, observed; He, expected), polymorphic information content (PIC) and Wright's fixation index (F).

Observed heterozygosity (Ho) ranged between 0.121 (BM1824) and 0.813 (BMS2533) for WZ and between 0.125 (TGLA227) and 0.889 (BoLA DRBP1) for AS. Expected heterozygosity (He) ranged between 0.115 (BMI1824) and 0.827 (BoLA DRBP1) for WZ and between 0.122 (ETH10) and 0.716 (ETH 225, BoLA DRBP1) for AS. Mean Ho and He were 0.56 and 0.50 in WZ, and 0.49 and 0.48 in AS respectively. The mean Ho (0.53), He (0.49) and PIC (0.44) for all the loci in this study are low. Ten loci from WZ and 11 from AS were moderately informative (0.25 < PIC < 0.50) and four loci from WZ and three loci from AS were highly informative (PIC > 0.5), indicating a moderate polymorphism across all loci (Bolstein et al., Reference Bolstein, White, Skolnick and Davis1980). Overall, there is low level of genetic diversity among the Mithun population in Bhutan. These estimates of genetic diversity is similar to Yunnan Mithun in China (Ho (0.53), He (0.63) and PIC (0.60) (Qu et al., Reference Qu, Nguyen, He, Huang, Yuan, Zhang and Zan2012). But higher than two rapidly declining zebu cattle breeds of India (Mukesh et al., Reference Mukesh, Sodhi, Bhatia and Mishra2004) and lower than the cattle breeds in Europe (Schmid et al., Reference Schmid, Saitbekova, Gaillard and Dolf1999; Del Bo et al., Reference Del Bo, Polli, Longeri, Ceriotti, Looft, Barre-Dirie and Zanotti2001). A low genetic diversity in current study may be attributed to small population size and repeated introduction of animals from same source (Aurnachal Pradesh, India) over the years.
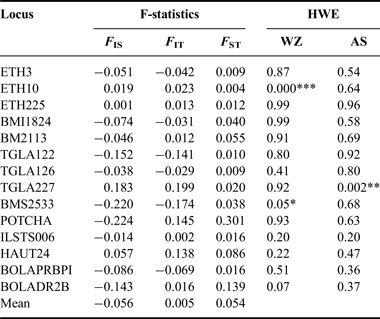
The Wright's fixation indices (F) to measure local inbreeding ranged between −0.570 and 0.075 with average of −0.102 for WZ and between −0.321 and 0.547 with average of −0.001 for AS (Table 3). The overall population inbreeding estimate (F IS) was −0.056 (P = 0.001) and subdivision estimate (F ST) was 0.054. This indicated that there was no inbreeding within the population, which possibly is a result of random mating in the population. Test for HWE revealed that two loci (ETH10 and BMS2533) in WZ and one locus (TGLA227) in AS deviated significantly (P < 0.05). Overall, these values suggest a low level of population differentiation and limited out-breeding. This is evident as period of isolation of these populations is only from mid 1970s.
F-statistics and Hardy-Weinberg equilibrium (HWE) values for 14 microsatellite loci in Mithun of Wangdigang, Zhemgang (WZ) and Arong, Samdrupjongkhar (AS).

* Significant at P < 0.05; ** Significant at P < 0.01; *** Significant at P < 0.001.
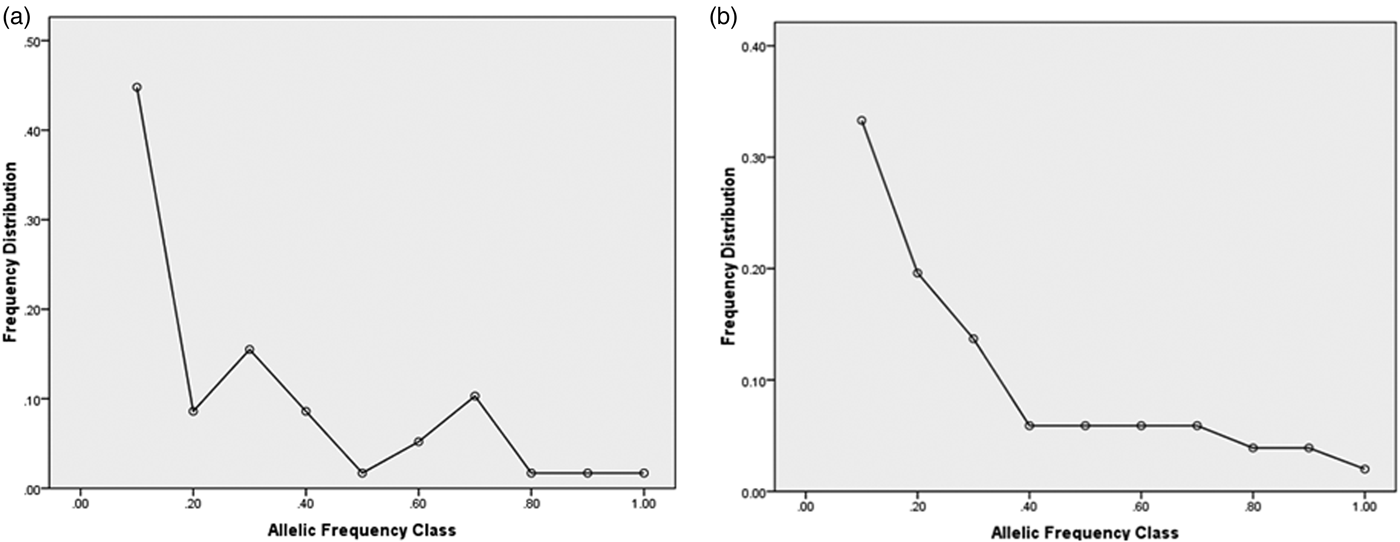
Analysis of molecular variances (AMOVA) showed 5 percent of total variation was between populations, 37 percent among individuals and 58 percent within individuals. A high within-individual variation is a result of high expression of genetic drift in small population size (Excoffier et al., Reference Excoffier, Smouse and Quattro1992). Further, there was a close relationship between farms (Nei's genetic distance 0.145) (Nei, Reference Nei1987). Despite small population, there was no recent bottleneck as per mode-shift distortion graph (Figure 2a and 2b). The lack of recent bottleneck according to Luikart et al. (Reference Luikart, Allendorf, Cornuet and Sherwin1998) further supports lack of inbreeding in these populations and presence of optimum population size at the source.
(a) Modeshift test for bottleneck analysis in Wangdigang Mithun population; (b) modeshift test for bottleneck analysis in Arong Mithun population.

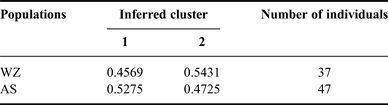
STRUCTURE software was employed to compute the proportion of the genome at multiple markers to observe overall population structuring and to assign individuals to one of the two populations. At K = 2, the populations of WZ and AS did not cluster distinctly to the inferred populations. Nevertheless, membership coefficients (Q) values indicated subtle level of genetic clusters as shown in Table 4. There is no clear differentiation of two populations further supports the absence of distinct genetic characteristic between the farms (Figure 3). Each column represents the genetic proportion in which an animal belonged to the population, with green colour representing WZ and Yellow AS Mithun.
Distinct plot for 84 Mithun by model-based clustering in STRUCTURE for K = 2 with green colour representing WZ and Yello As Mithun. Individuals are represented by thin vertical lines and population separated by bold line.

Population membership Q values in the two inferred clusters using STRUCTURE analysis.

WZ, Wangdigang, Zhemgang and AS, Arong, Samdrupjongkhar populations.
The animals in these two farms have not undergone genetic differentiation. They also, have low genetic diversity and very low/no inbreeding. Therefore periodic assessment of levels of inbreeding in the population, exchange of animals between the farms is recommended to guide the need for introduction of Mithun from elsewhere.
Conclusion
This study revealed that a panel of 14 polymorphic microsatellite DNA markers of cattle can be useful for assessment of genetic diversity in Mithun. There is overall a low genetic diversity in Mithun population in Bhutan. Considering the small population, periodic assessment of inbreeding levels and exchange of animals between farms is recommended to manage levels of inbreeding and guide on the need for introduction from its sources.
Acknowledgements
We would like to thank farm managers, Regional Mithun Breeding Farms, Wangdigang & Arong, Bhutan for collaboration on collection of hair samples and EU RNR SSP for funding our travel to Primate Research Institute, Kyoto University for DNA fragment analysis and molecular genetics training.
Statement of interest
The authors do not have any conflict of interest that will influence the judgment and potentiality of being biased. Further, authors did not have any financial arrangements or connections pertinent to submitted manuscript.