Introduction
Bird nests are micro-ecosystems with diverse communities of invertebrates, from ectoparasites to commensal species. Most studies of the arthropods in bird nests have focussed on the presence and impact of ectoparasites (Møller et al. Reference Møller, Allander and Dufva1990; Loye and Zuk Reference Loye and Zuk1991; Krištofík et al. Reference Krištofík, Mašán and Šustek2001, Reference Krištofík, Šustek and Mašán2002, Reference Krištofík, Mašán, Šustek and Kloubec2003, Reference Krištofík, Mašán and Šustek2007; Fairn et al. Reference Fairn, Hornsby, Galloway and Barber2014), including fleas (Siphonaptera) (Phipps and Bennett Reference Phipps and Bennett1974); mites (Acari) (Wasylik Reference Wasylik1971); and nest-associated Diptera in the families Muscidae (Lowenberg-Neto Reference Lowenberg-Neto2008), Calliphoridae (Bennett and Whitworth Reference Bennett and Whitworth1991; Whitworth and Bennett Reference Whitworth and Bennett1992), and Carnidae (Cannings Reference Cannings1986a, Reference Cannings1986b; Dawson and Bortolotti Reference Dawson and Bortolotti1997). However, nests also support diverse communities of commensal arthropods, including mites, flies, moths (Lepidoptera), beetles (Coleoptera), and various other Insecta. The first significant publications documenting the general fauna associated with bird nests were by Hicks (Reference Hicks1959, Reference Hicks1962, Reference Hicks1971), who started building a checklist of arthropod species occurrence and their associated bird species. Since then, several studies have documented the Arthropoda communities associated with passerine (Passeriformes) birds, but relatively few have treated the communities associated with birds of prey. Some of the raptors for which associated insect communities have been documented include Eurasian griffon vulture (Gyps fulvus (Hablitz); Aves: Accipitridae) (Dražina and Špoljar Reference Dražina and Špoljar2009), boreal owl (Aegolius funereus (Bonaparte); Aves: Strigidae) (Krištofík et al. Reference Krištofík, Mašán, Šustek and Kloubec2003; Majka et al. Reference Majka, Klimaszewski and Lauff2006), lesser spotted eagle (Aquila pomarina Brehm; Aves: Accipitridae) (Krištofík et al. Reference Krištofík, Mašán, Šustek and Karaska2009), American kestrel (Falco sparverius Linnaeus; Aves: Falconidae) (Philips and Dindal Reference Philips and Dindal1990; Neubig and Smallwood Reference Neubig and Smallwood1999), northern saw-whet owl (Aegolius acadicus (Gmelin); Aves: Strigidae) (Philips et al. Reference Philips, Root and DeSimone1983; Majka et al. Reference Majka, Klimaszewski and Lauff2006), red-footed falcon (Falco vespertinus Linnaeus; Aves: Falconidae) (Soltész et al. Reference Soltész, Seres and Kovács-Hostyánszki2018), saker falcon (Falco cherrug Gray; Aves: Falconidae) (Merkl et al. Reference Merkl, Bagyura and Rozsa2004), and screech owl (Megascops asio (Linnaeus); Aves: Strigidae) (Philips and Dindal Reference Philips and Dindal1990).
Here, we document the Diptera species found associated with three species of raptors occurring in Nova Scotia, Canada: American kestrel (Falco sparverius), boreal owl (Aegolius funereus), and northern saw-whet owl (Aegolius acadicus). This follows the confirmation that the boreal owl now has a breeding population in Nova Scotia (Lauff Reference Lauff2009), where it is now known to be sympatric with the northern saw-whet owl. This could lead to competition for available nesting area and resources, so it is important to fully understand the nesting environment. Majka et al. (Reference Majka, Klimaszewski and Lauff2006) did preliminary work on the Coleoptera communities associated with raptor nests in an earlier stage of this study, while the work reported here considers the Diptera in a larger number of nests. Diptera are diverse and abundant in nests (Rotheray Reference Rotheray1991; Iwasa et al. Reference Iwasa, Hori and Aoki1995; Gatt Reference Gatt2001) and include a large number of commensal species. It is not currently known whether these nest-associated fly communities differ between the nest boxes of different raptor species.
Materials and methods
Following the discovery of boreal owls breeding in Nova Scotia in 2004, nest boxes were installed in habitat suitable for the species to provide additional nesting sites for breeding pairs (Lauff Reference Lauff2009). The nest boxes followed the design of Korpimaki (Reference Korpimaki1985) and were built from rough-cut pine lumber. Wood shavings were placed in the box to a depth of approximately 5 cm. Nest boxes were mounted 3–4 m high on living trees, with the entrance hole typically facing between south and east.
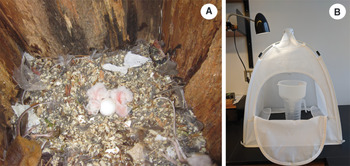
Active nests were periodically visited to verify if the nest was still active, to ascertain when nestlings (Fig. 1A) would be ready to leave the nest and to record some other details including clutch size, abundance, and type of stored prey. Once the young owls had fledged, the nest material was transferred into wooden or plastic totes for transport to the laboratory where it was then placed into Berlese funnels inside emergence chambers; a 60-W incandescent bulb, approximately 50 cm from the funnel and set outside the chamber, was used to drive the funnel (Fig. 1B). The funnels collected arthropods crawling downwards, while insects flying upwards were retained in the emergence traps; collections ceased when a week went by with no further captures. The insects extracted were preserved in 70% isopropyl alcohol except for the specimens from two nests collected in 2018, which were placed in 95% ethanol to allow better DNA extraction. All adult dipterans were dried using a critical-point-dryer prior to mounting on paper points.
A, Inside the nest box with young chicks, feathers, guano, and prey; B, emergence trap with Berlese funnel inside and lamp on the outside.

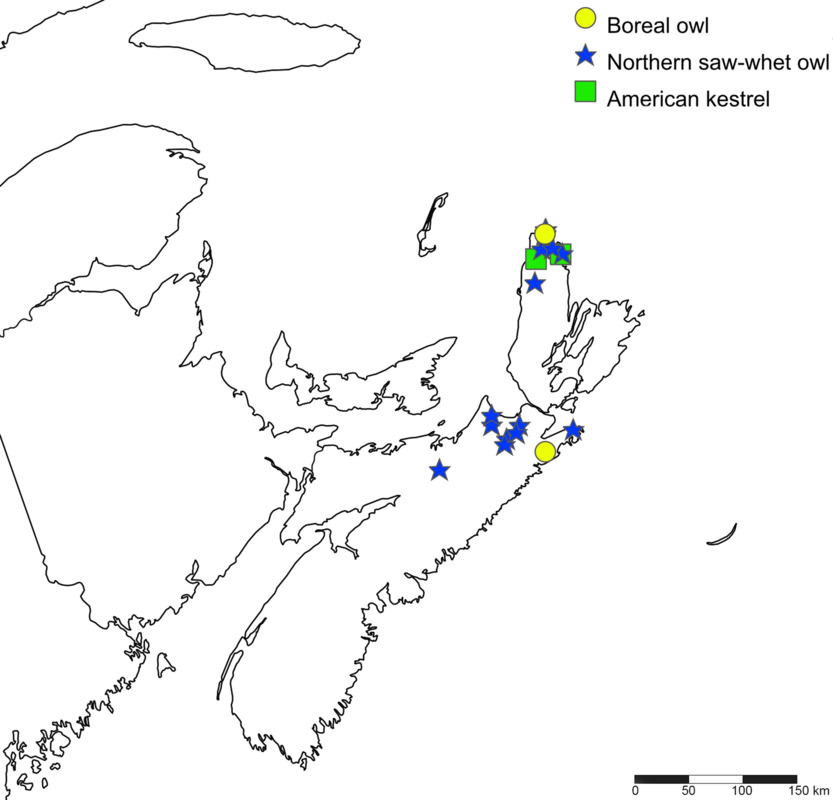
In total, 28 nests were collected: two American kestrel, two boreal owl, and 24 northern saw-whet owl, all located in northern Cape Breton Island and the northern mainland of Nova Scotia, Canada (Fig. 2). The fly communities associated with each raptor species were assessed for richness, abundance, and trophic guild. Dominance was calculated as the percentage abundance of each species in comparison to the total number of specimens collected across all nests, regardless of the bird species. Constancy of occurrence was given as the number of nests where the species occurred compared to the total number of nests collected. These measures provided some indication of whether the presence of certain species was expected in the nests or accidental. Measures of richness and abundance of flies were compared to the number of fledglings per nests to see if there was any correlation.
Location of the 28 nests in Nova Scotia for each bird species.

A microplate of 95 specimens, including all apparent morphospecies, was sequenced for cytochrome c oxidase I (COI) prior to detailed examination of the material by specialists. This yielded sequences corresponding to most of the species later recognised by Diptera taxonomists involved with the project. All the sequences were uploaded to the Barcode of Life Database System (BOLD: http://boldsystems.org) (Ratnasingham and Hebert Reference Ratnasingham and Hebert2007). Most species met the requirements to be successfully assigned to a barcode index number (BIN), which is considered a good proxy for species for most groups (Ratnasingham and Hebert Reference Ratnasingham and Hebert2013). A maximum likelihood tree was generated with Mega X using general time reversible model with gamma distributed with invariant sites to show the molecular diversity of the nests. For the species not represented among the successful sequences, a public sequence was included for representations when available (except for Ornithomyia bequaerti Maa (Diptera: Hippoboscidae) and unidentified morphospecies, e.g., Chironomidae (Diptera) species). All of these are released publicly through BOLD (https://doi.org/10.5883/DS-OWLNS) and GenBank (www.ncbi.nlm.nih.gov/genbank/). All vouchers are split among these institutions: Centre for Biodiversity Genomics (Guelph, Ontario, Canada), Canadian National Collection of Insects, Arachnids, and Nematodes (Ottawa, Ontario, Canada), University of Guelph Insect Collection (Guelph, Ontario, Canada), Nova Scotia Museum (Halifax, Nova Scotia, Canada), Department of Lands and Forestry, Nova Scotia (Halifax, Nova Scotia, Canada), and St. Francis Xavier University (Antigonish, Nova Scotia, Canada).
Results
Richness
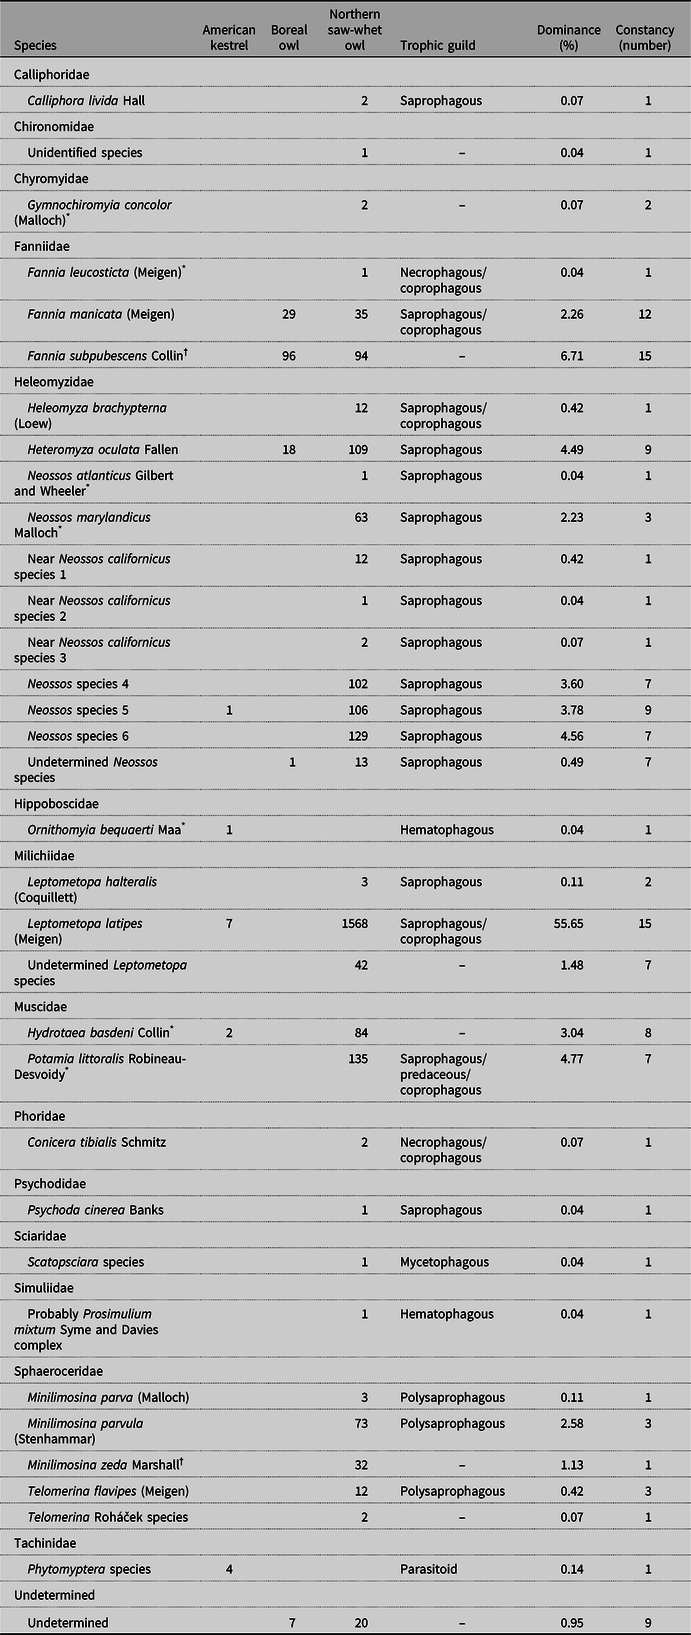
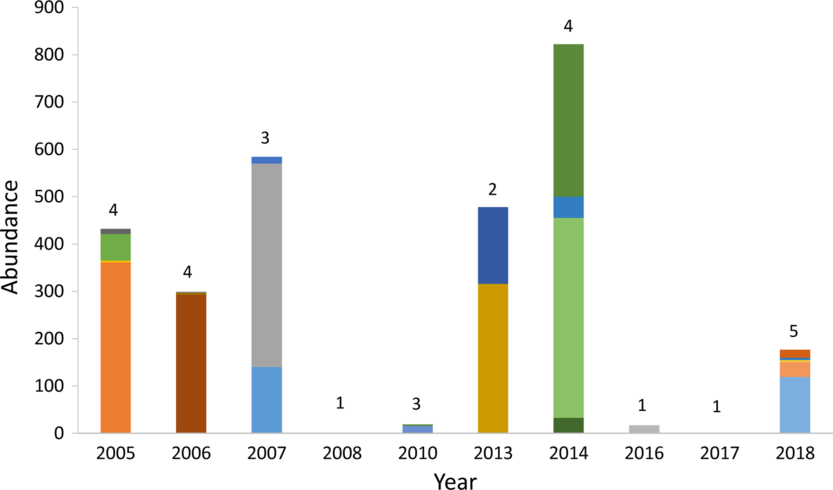
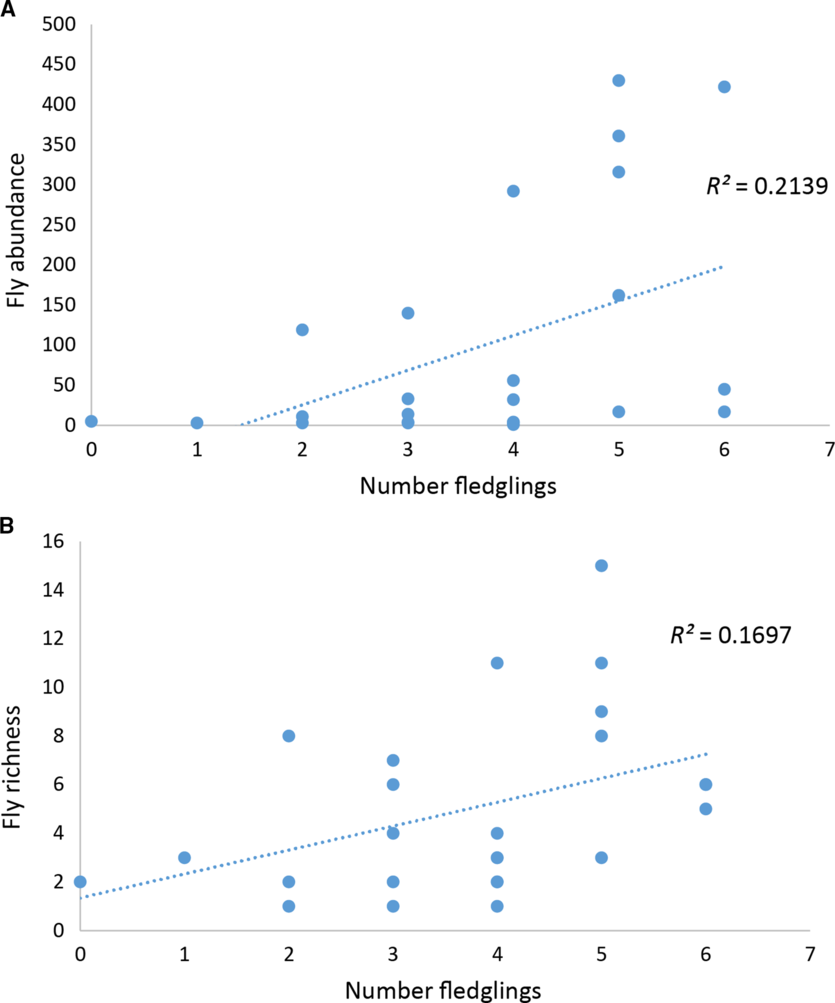
A total of 2830 specimens were extracted from the nests, representing 31 species/morphospecies (excluding the specimens that could not be identified due to specimen quality) from 14 families of flies (Table 1). Most of the abundance and richness were from northern saw-whet owl samples. There was no unique species found in boreal owl nests, but two species were only collected from American kestrel nests (Ornithomyia bequaerti and Phytomyptera Róndani (Diptera: Tachinidae) species). The number of nests sampled and the number of flies collected varied greatly between years (Fig. 3). The number of fledglings was not strongly correlated with either the abundance of flies (Fig. 4A) or the species richness (Fig. 4B) of flies that emerged from the nest.
Diversity of Diptera species per bird species with their trophic guild, dominance across the number of specimens and constancy of occurrence across all 28 nests.

* First Nova Scotia record.
† First record from eastern North America.
Yearly fly abundance per nest collected each year, with each nest represented by a unique colour. The number atop each column represents the total number of nests collected that year.

Correlation to the number of fledglings. A, fly abundance; B, fly richness.

Only one known bird ectoparasite, Ornithomyia bequaerti, was collected. This single specimen probably fell off the bird into the nest, as adult hippoboscids are usually collected by physically inspecting birds or bats (Mammalia: Chiroptera). One black fly (Prosimulium Roubaud; Diptera: Simuliidae) was collected, but members of this genus normally do not feed on birds (Adler et al. Reference Adler, Currie and Wood2004); the fly was therefore likely in the surrounding area to feed on humans servicing the nest. Most of the flies collected during this study were saprophagous or coprophagous (Table 1), which is not surprising due to the presence of wood shavings, feathers, guano, regurgitated pellets, and others detritus upon which to feed (Fig. 1A).
The dominance and constancy of occurrence did vary according to species and family of flies, with some groups abundant and predictably encountered in bird nests, while others are occasional or accidental visitors (Table 1). Accidental species might have been attracted by the proximity of resources found in the nest or by the other insects already present. For that reason, taxa rarely reported from nests in the literature or those represented only by singletons and doubletons (i.e., species with a dominance < 0.1) are here considered as accidental or incidental nest inhabitants: Calliphora livida Hall (Diptera: Calliphoridae) (Hicks Reference Hicks1959), Chironomidae, Gymnochiromyia concolor (Malloch) (Diptera: Chyromyidae) (McAlpine et al. Reference McAlpine, Peterson, Shewell, Teskey, Vockeroth and Wood1987), Conicera tibialis Schmitz (Diptera: Phoridae) (Disney Reference Disney1994), Hippoboscidae, Psychoda cinerea Banks (Diptera: Psychodidae) (Hicks Reference Hicks1959), Scatopsciara Edwards (Diptera, Sciaridae) (Hicks Reference Hicks1959, Reference Hicks1962), and Phytomyptera (parasitoid of Lepidoptera: Tortricidae (Arnaud Reference Arnaud1978)). The more common flies reared from the nests, as expected based on Hicks (Reference Hicks1959, Reference Hicks1962, Reference Hicks1971) and other literature, belonged to the families Fanniidae, Heleomzyidae, Milichiidae, Muscidae, and Sphaeroceridae. Those dominant families also included a few species represented only by singletons and doubletons.
Family-level summaries
Fanniidae and Muscidae
Of the three species of Fanniidae, the widespread species Fannia manicata (Meigen) has the longest history of documentation from nests of birds and is also found in nests of hornets and wasps (Hymenoptera: Vespidae) (Hicks Reference Hicks1959, Reference Hicks1971; Chillcott Reference Chillcott1960; Iwasa et al. Reference Iwasa, Hori and Aoki1995; Rozkošný et al. Reference Rozkošný, Gregor and Pont1997; Adamska et al. Reference Adamska, Niewiadomska and Grzywacz2018; Soltész et al. Reference Soltész, Seres and Kovács-Hostyánszki2018). Fannia leucosticta (Meigen) has also been collected from bird nests before and reared from mink (Mustela Linnaeus; Mammalia: Mustilidae) and pig (Sus scrofa domesticus Erxleben; Mammalia: Suidae) excrement (Chillcott Reference Chillcott1960; Hicks Reference Hicks1971). Fannia subpubescens Collin was collected in 15 of the 28 nests although there are no previously published records of this species from either bird nests or eastern North America at all. Many previous studies of bird nests identified Fannia Robineau-Desvoidy specimens only to genus, so it is possible that the species was overlooked. Most previous records are from Europe or from northwestern North America (Chillcott Reference Chillcott1960). Both species of Muscidae reported here, Hydrotaea basdeni Collin (Huckett Reference Huckett1954; Hicks Reference Hicks1959, Reference Hicks1971) and Potamia littoralis Robineau-Desvoidy (Iwasa et al. Reference Iwasa, Hori and Aoki1995; Soltész et al. Reference Soltész, Seres and Kovács-Hostyánszki2018), are known to be common in bird nests but neither had previously been recorded from Nova Scotia.
Heleomyzidae
Heleomyzidae, including Heleomyza brachypterna (Loew) (Hicks Reference Hicks1959, Reference Hicks1971; Garnett and Foote Reference Garnett and Foote1966) and Heteromyza oculata Fallen, are known from bird nests as well as burrows of small Mammalia (Gill Reference Gill1962). Neossos Malloch, the most abundant heleomyzid genus in this study, is an apparent nest specialist and is rarely collected outside of bird nests (Gilbert and Wheeler Reference Gilbert and Wheeler2007; Solecki and Wheeler Reference Solecki and Wheeler2015). The large number of Neossos specimens collected in this study contrasts with other studies of raptor nests mentioned in Gilbert and Wheeler (Reference Gilbert and Wheeler2007). Some of the specimens collected in the current study have external morphological characteristics of N. atlanticus Gilbert and Wheeler and N. marylandicus Malloch, while others seem to fall into morphospecies with genitalia structurally similar to the European N. broersei (de Meijere). As discussed below, however, sequence data reflect only two species.
Milichiidae
Leptometopa latipes (Coquillett) appears to be by far the most common and abundant fly species found in bird nests (Hicks Reference Hicks1959, Reference Hicks1962; Brake Reference Brake2000; Soltész et al. Reference Soltész, Seres and Kovács-Hostyánszki2018), but molecular data suggest that the L. latipes collected in this study is actually two species. These two similar species (one undescribed) together account for over 55% of all flies extracted in this study and were identified from more than half the nests collected. Another Leptometopa Becker species, L. halteralis, is recorded here from bird nests for the first time. There are other records of “Leptometopa sp.” from bird nest studies, but no published records explicitly identifying L. halteralis from nests (de Mello et al. Reference de Mello, Rodrigues and Einicker Lamas2007). Other Leptometopa species are known from a wide range of habitats such as dung, latrines, bat guano, bird nests, flowers, and Fungi (Brake Reference Brake2000, de Mello et al. Reference de Mello, Rodrigues and Einicker Lamas2007), but there is little information about habitat specificity of individual species.
Sphaeroceridae
Although several species of Sphaeroceridae are routinely collected from bird nests, the species involved are usually polysaprophagous and not specifically associated with birds. Minilimosina parva (Malloch) and M. parvula (Stenhammar), for example, were both abundant in our samples, but both species are widespread and occur in a wide range of habitats. Minilimosina parva is usually found on carrion and M. parvula is more common on fungi (Marshall Reference Marshall1985). Minilimosina zeda Marshall was also abundant in raptor nests in this study but was previously known only from a few specimens associated with dry carrion or carrion traps in northwestern North America (Alberta, Canada to Alaska, United States of America) (Marshall Reference Marshall1985). Telomerina flavipes (Meigen), like M. parva, is a widespread species most often associated with carrion (Marshall and Roháček Reference Marshall and Roháček1984). It has been collected from the nests of red-footed falcons (Soltész et al. Reference Soltész, Seres and Kovács-Hostyánszki2018) and in burrows of rabbits, along with M. parvula (Roháček Reference Roháček2019). It has also been collected in caves, on fungi, on dung, and various other mammal burrows (Marshall and Roháček Reference Marshall and Roháček1984).
Molecular
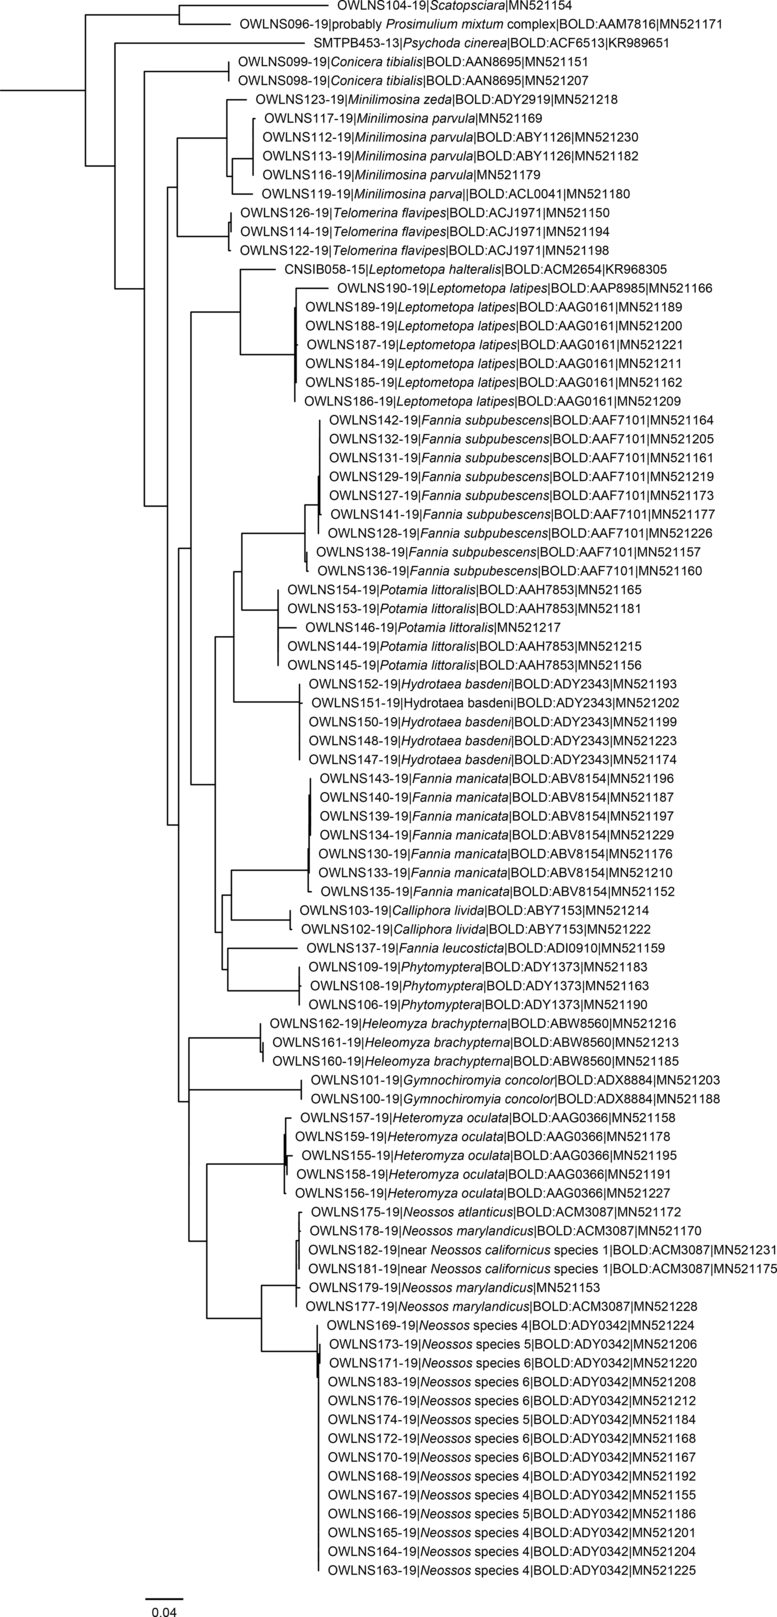
The maximum likelihood tree (Fig. 5) shows the species richness found in these nests. There was a near perfect correspondence of one unique BIN for each species except for the genus Neossos (Heleomyzidae) and the species Leptometopa latipes (Milichiidae). Neossos grouped in two major clusters despite morphological evidence suggesting multiple species. Each cluster on the tree corresponds to a different surstylus shape. The first grouping, including Neossos atlanticus and N. marylandicus, is characterised by a surstylus shaped like a lobster claw, while the second grouping includes several apparent morphospecies characterised by a paddle-shaped surstylus similar to that of the European species, N. broersei (de Meijere). GenBank records from N. broersei demonstrate that the species is distinct from those in this study and would create a third cluster. The molecular data thus suggest that Neossos includes only two species in our study area (the Nearctic N. marylandicus and a new species), instead of the multiple species suggested by external morphology. A thorough reconsideration of the species taxonomy of the genus is necessary to determine whether this disparity between molecular and morphological evidence reflects a failure of COI sequences to distinguish some of the species, or if it results from high infraspecific morphological variation and a resultant oversplitting of the genus. Sequence data for Leptometopa, in contrast to that for Neossos, suggest that the species diversity is higher than previously recognised. Leptometopa latipes divides into two molecular clusters, suggesting that there is an undescribed species superficially similar to L. latipes. The distinction between the two clusters is supported by their placement into distinctive BINs with small within BIN variation and a divergence of more than 2.63%. Additional records available through the BOLD public data portal give more support to each BIN. Examination of male genitalia of specimens in each COI cluster confirms that they are different and that L. latipes seems to consist of two species, one of which is undescribed. Leptometopa is in clear need of revision to determine the definitions, diagnoses, and relationships of these species.
Maximum likelihood tree of the dipteran richness collected from the 28 nests (BOLD process ID|species|BIN|GenBank accession).

Discussion
Since only two boreal owl nests were studied, in contrast to the many northern saw-whet owl nests, there are insufficient data for a quantitative comparison of fly communities associated with the nests of these two species. However, there does not seem to be any obvious difference.
Most of the flies collected were saprophagous species associated with carrion, fungi, or dung. The carrion-associated species would be expected to show increased numbers in response to the number of fledglings in the nest, which might be correlated with the presence of shed skin, feathers, carrion debris, or even dead fledglings. There was, however, no strong correlation between the number of fledglings and either the abundance or richness of flies. Iwasa et al. (Reference Iwasa, Hori and Aoki1995) suggested that saprophagous and coprophagous species are likely to be affected by the faeces present in the nest, the building materials and habits of the birds, and the habitat where the nest was located. This did not appear to be the case here despite the accumulation of faeces due to the parents not cleaning the nest.
Parasitic species in the families Calliphoridae and Carnidae associated with nesting birds were not collected during this study. A third parasitic family, the Hippoboscidae, was represented only by a single (probably incidental) specimen of Ornithomyia bequaerti. Carnus hemapterus Nitzsch (Diptera: Carnidae) has been collected from American kestrels and northern saw-whet owl by other workers (Cannings Reference Cannings1986b; Dawson and Bortolotti Reference Dawson and Bortolotti1997), and it is commonly encountered in raptor and hole-nesting species across North America (Capelle and Whitworth Reference Capelle and Whitworth1973; Cannings Reference Cannings1986a) but was not recorded in this study. Bird blow flies in the genus Protocalliphora Hough (Diptera: Calliphoridae) were also apparently absent from our samples, even though they are commonly associated with cavity-nesting birds and they have previously been collected from different raptor species (Sabrosky et al. Reference Sabrosky, Bennett and Whitworth1989; Bennett and Whitworth Reference Bennett and Whitworth1992). It is possible that emptying the nest boxes after the owls left diminished ectoparasite populations, as it has been shown to occur in other studies (Mappes et al. Reference Mappes, Mappes and Kotiaho1994; Rendell and Verbeek Reference Rendell and Verbeek1996; Dawson and Bortolotti Reference Dawson and Bortolotti1997). However, it is also possible that they had already emerged and left the nest as the larvae follow closely the life cycle of the nestlings that they feed upon (Sabrosky et al. Reference Sabrosky, Bennett and Whitworth1989; Bennett and Whitworth Reference Bennett and Whitworth1991). It would have been interesting to comb through the nest materials to see if any Protocalliphora puparia were present and how many nests were infested.
Because of the limited number of boreal owl nests collected, it was not possible to conclude that any fly species was more associated with one raptor species than another. However, the dipteran communities associated with the nests of these raptor species were extensively documented for the first time.
Acknowledgements
The authors thank Sean Prosser for his assistance with the sequencing and Brian Brown (Phoridae), Monty Wood (Simuliidae), and Jim O’Hara (Tachinidae) for assisting in identifications. Sequence analysis was enabled by awards to Paul Hebert from the Canada Foundation for Innovation and from Ann and Chris Evans. The authors also thank Greg Giffen, Richard Murphy, and Stephen Bushell for access to their nest boxes. The authors also thank many volunteers notably Fritz McEvoy and David Rasmussen for help in the field. This work was supported by grants from Bird Studies Canada, the Nova Scotia Museum of Natural History, the Nova Scotia Bird Society, and the Nova Scotia Department of Natural Resources (Nova Scotia Habitat Conservation Fund – Contributions from Hunters and Trappers).