Introduction
Diabetes mellitus (DM) during pregnancy, whether gestational or pre-gestational, including type 1 and type 2 diabetes, represents a major global healthcare concern with potentially profound implications for both maternal and fetal well-being. Reference Mackin, Nelson and Kerssens1,Reference Pylypjuk, Sellers and Wicklow2 The prevalence of gestational diabetes mellitus (GDM) has reached nearly 20% worldwide and continues to rise in parallel with increasing obesity and advanced maternal age. Reference Brennan, Kandasamy, Rudd, Schneider, Jones and Watson3 Maternal hyperglycemia is associated not only with common obstetric complications but also with impaired fetal organ development. Reference McCance4 Developing kidneys are particularly vulnerable to the harmful effects of elevated maternal serum glucose levels, as the association between in utero environmental conditions and chronic kidney disease in the offspring is now well established. Reference Kandasamy, Smith and Wright5 This vulnerability stems from the critical period of nephrogenesis, which begins around the fourth to fifth week of gestation and is mostly completed by approximately 36 weeks. Reference Schreuder6 After this period, no new nephrons are formed, making this initial nephron endowment a key determinant of an individual’s lifetime renal health. Reference Schreuder6 The term “developmental programming” refers to the adaptation of the fetus to an unfavorable intrauterine condition to compensate for. Reference Barker and Martyn7 The most common consequence of perinatal insults, including maternal diabetes, to the developing kidneys is a reduction in nephron endowment, which may predispose individuals to chronic kidney disease (CKD) and hypertension later in life. Reference Richter, Briffa, Moritz, Wlodek and Hryciw8 In addition to the evidence from animal models demonstrating nephron loss and later renal dysfunction, human studies also indicate that intrauterine exposure to maternal diabetes is associated with adverse renal programming in offspring. Reference Yan, Li, Su, Zhang and Yang9,Reference Lee, Collins, Gordon, Rae and Pringle10 In a recent review, Tortelote suggested that these alterations may be mediated not only by metabolic disturbance but also by epigenetic mechanisms, highlighting that gestational diabetes may modify nephrogenesis through DNA methylation, histone modifications, and non-coding RNA pathways, ultimately disrupting the expression of key genes involved in kidney development. Reference Tortelote11 Nevertheless, the precise effects of diabetes during pregnancy on fetal kidney development remain an area of interest and ongoing investigation.
Previous studies on the effects of maternal diabetes have primarily focused on fetal kidney size yielding inconsistent results. Fetal kidney volume has been used as an indirect indicator of nephron number and renal function; however, due to potential measurement errors, a novel alternative approach, ultrasound measurement of fetal renal parenchymal thickness (RPT), has been introduced. Reference Hokke, de Zoysa and Carr12,Reference Brennan, Schneider, Watson, Kandasamy and Rudd13 This method focuses on the nephron-rich area of the kidney and provides an indirect estimation of the nephron endowment. Reference Brennan, Schneider, Watson, Kandasamy and Rudd13 Beyond structural changes, maternal diabetes may influence fetal renal hemodynamics, and these changes, assessed using fetal renal artery Doppler parameters, may serve as predictive indicators of adverse pregnancy outcomes. Reference Cai and Yan14
This study aimed to further investigate the effects of maternal diabetes on fetal kidney development and hemodynamics in utero. Using ultrasonography, we evaluated the mediolateral and anteroposterior diameters, renal length, and calculated kidney volume in fetuses from gestational and pre-gestational diabetic pregnancies. We also measured the anterior and posterior RPT to predict nephron numbers and assessed fetal renal artery Doppler indices. Our findings provide deeper insights into the impact of maternal diabetes on fetal renal structure and hemodynamics, potentially supporting early detection and intervention strategies to reduce long-term renal complications in offspring.
Materials and methods
This prospective observational study, investigating the effects of maternal diabetes on fetal renal parameters, was conducted at our tertiary maternal-fetal medicine unit between December 2024 and July 2025. A total of 128 pregnant women were enrolled in the study and classified into three groups: (1) pre-gestational diabetes mellitus group (n = 28), (2) gestational diabetes mellitus group (n = 36), and (3) control group (n = 64). After obtaining a complete medical history, women with hypertension, chronic heart disease, connective tissue disorders, systemic infections, or any other concomitant diseases were excluded.
Multiple pregnancies and patients diagnosed with fetal malformations and chromosomal anomalies were also excluded. Diabetes during pregnancy was screened by a 75-g oral glucose tolerance test performed between 24 and 28 weeks of gestation. GDM was diagnosed according to the International Association of Diabetes and Pregnancy Study Groups (IADPSG) criteria, in which abnormal values are defined as fasting plasma glucose ≥92 mg/dL, 1-hour glucose ≥180 mg/dL, or 2-hour glucose ≥153 mg/dL after glucose loading. Reference Metzger and Gabbe15 All women with GDM were initially treated with diet and physical activity. If glycemic control was not achieved, human insulin therapy was initiated. Women with known type 1 or type 2 diabetes mellitus before pregnancy were categorized as having pre-gestational diabetes mellitus. Glycemic control in both the GDM and pre-gestational DM groups was monitored throughout pregnancy using serial fasting and 1-hour postprandial blood glucose measurements, along with third-trimester hemoglobin A1c (HbA1c) values (%). All patients remained within the recommended glycemic targets (fasting glucose < 95 mg/dL, postprandial glucose < 140 mg/dL, HbA1c < 6%). Controls were assembled from gestational age-matched women with uneventful pregnancies who presented to our hospital during the same period.
Gestational age was calculated based on the last menstrual period and confirmed by first-trimester crown–rump length (CRL) measurements. All ultrasound examinations were performed by three maternal–fetal medicine specialists with 7–10 years of experience in fetal ultrasonography using ARIETTA 850 system (Hitachi Medical Corporation, Tokyo, Japan) equipped with a 3.5 mHz abdominal transducer. Ultrasound examinations were performed between 28 and 38th weeks of gestation, and the anteroposterior, mediolateral, and longitudinal diameters of both fetal kidneys were measured. The image was magnified such that the kidney occupied most of the screen. Renal length was measured in the midsagittal plane from the upper to lower pole (Fig. 1). The anteroposterior and mediolateral diameters were obtained from the transverse section of the fetal abdomen, with the fetal spine positioned anteriorly at the level of the renal pelvis (Fig. 2). Each measurement was performed twice, and the mean values were recorded. The fetal kidney volume (mm3) was calculated using the standardized ellipsoid volume formula: volume = length × width × height × 0.5233. RPT was measured in the midsagittal plane of both kidneys in two directions: for the posterior parenchyma, from the posterior aspect of the kidney to the pelvis and for the anterior parenchyma from the anterior border of the kidney to the pelvis (Fig. 3). Each measurement was performed twice, and the mean was recorded.
Ultrasound image demonstrating fetal renal length measurement. The kidney is visualized in the midsagittal plane, and renal length is measured as the maximal pole-to-pole distance from the upper to the lower pole.

Transverse ultrasound section of the fetal abdomen demonstrating kidney measurements. The anteroposterior (AP) and mediolateral (ML) renal diameters were obtained in this plane, with the fetal spine positioned anteriorly at the level of the renal pelvis.

Midsagittal ultrasound section of the fetal kidney demonstrating renal parenchymal thickness (RPT) measurements. Posterior RPT was obtained between the posterior capsule and the pelvic wall, while anterior RPT was measured from the anterior renal surface to the pelvis.

Bilateral fetal renal artery Doppler studies were performed in the coronal section, where both kidneys and the renal arteries were visualized. Color flow was used to identify arteries arising from the aorta and entering into kidneys. A sample gate of 1–3 mm with an angle as close to 0o as possible was placed in the middle of both main renal arteries, and a pulse wave signal was obtained in the absence of fetal movement or breathing (Fig. 4). The average of the last three consecutive consistent waveforms was used to calculate the pulsatility index (PI). Maternal serum samples were collected at the time of ultrasonographic evaluation to monitor key glycemic control parameters, including fasting glucose, 2-hour postprandial glucose, and HbA1c (%).
Coronal ultrasound view demonstrating bilateral fetal renal artery Doppler assessment. Color Doppler was used to visualize the renal arteries arising from the abdominal aorta and entering each kidney. A 1–3 mm sample gate was placed in the mid-portion of each main renal artery with the Doppler angle kept as close to 0° as possible, and waveforms were recorded in the absence of fetal breathing or movement.

The study was approved by the institutional ethics committee (approval number: 2024/245), and written informed consent was obtained from all participants prior to enrollment. This study was conducted in accordance with the principles of the Declaration of Helsinki.
Statistical analysis
All statistical analyses were performed using IBM SPSS Version 24.0 (Chicago, IL, USA). Initially, the distribution of continuous data was assessed for normality by examining histogram plots and evaluating the kurtosis and skewness values. Normally distributed continuous variables were compared using one-way ANOVA, and Tukey’s post-hoc test was performed for pairwise comparisons. Variables that were not normally distributed were expressed as medians (minimum–maximum) and were compared using the Kruskal–Wallis H test. Post-hoc pairwise comparisons were performed using the Mann–Whitney U test. A Pearson correlation test was used to assess the relationship between HbA1c levels and fetal kidney measurements. A p value of <0.05 was considered statistically significant.
Because the group sizes enrolled in the study were unequal, we performed a post-hoc power analysis using G*Power (Version 3.1.9.6) to evaluate the achieved power and determine the required sample size. Based on the results of our primary outcome, we achieved a medium-to-large effect size (Cohen’s F = 0.35). A priori power analysis indicated that the total sample size was sufficient to achieve 80% power at a 0.05 Alpha level for detecting group differences using one-way ANOVA.
Inter- and intra-observer reliability for renal measurements was evaluated in a subset of participants, and intraclass correlation coefficients (ICC) exceeded 0.90 for all parameters, indicating excellent reproducibility (ICC < 0.50: poor, 0.50–0.75: moderate, 0.75–0.90: good, >0.90: excellent).
Results
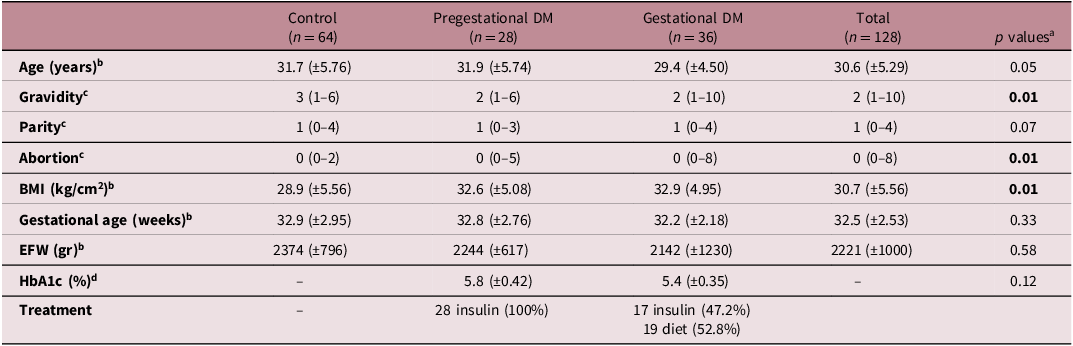
A total of 128 pregnant women, including those diagnosed with pre-gestational DM, GDM, and those without diabetes, were recruited for the study. The patients enrolled in the study were further divided into three groups based on their diabetes status: pre-gestational (n = 28), gestational diabetes (n = 36), and control (n = 64). The demographic characteristics of the patients are summarized in Table 1. According to our analysis, there were statistically significant differences in gravidity, abortion, and body mass index (BMI) among the groups.
The demographic characteristics of the pregnant women enrolled in the study

BMI, body mass index; EFW, estimated fetal weight.
a Level of significance P < 0.05.
b Continuous variables are expressed as mean and standard deviation and were analyzed using One-way ANOVA test with Tukey’s post hoc individual pairwise comparison test.
c Variables that were not normally distributed are expressed as median (minimum–maximum) and were compared using Kruskal–Wallis H test and post hoc pairwise comparison was performed using Mann–Whitney U test.
d Continuous variables are expressed as mean and standard deviation were analyzed using Student-t test.
The mean maternal BMI of the patients in pre-gestational DM, GDM, and control groups were 32.6 (±5.08), 32.9 (4.95), 28.9 (±5.56), respectively. Tukey’s post-hoc analysis for BMI revealed a statistically significant difference between the pre-gestational DM, GDM, and control groups (F2,125 = 7.3, p = 0.01), whereas no significant difference was observed between the pre-gestational and gestational diabetes groups (F2,125 = 7.3, p = 0.98). Significant differences in gravidity and abortion rates were observed between the groups, with post-hoc comparisons revealing significant differences between the gestational diabetes and control groups, as well as between the pre-gestational diabetes and control groups (p = 0.001). Conversely, maternal age (p = 0.05), gestational age (p = 0.33), and estimated fetal weight (EFW) (p = 0.58) were not significantly different between the control, pre-gestational DM, and GDM groups. In the pre-gestational DM group, all patients received insulin treatment. In the GDM group, 47.2% (17/36) required insulin therapy, while 52.8% (19/36) were managed with diet alone. No patients in either group used oral antidiabetic agents. Mean HbA1c levels were 5.8 ± 0.42% in the pre-gestational DM group and 5.4 ± 0.35% in the GDM group, with no statistically significant difference between the two groups (p = 0.12). HbA1c was not routinely measured in the control group.
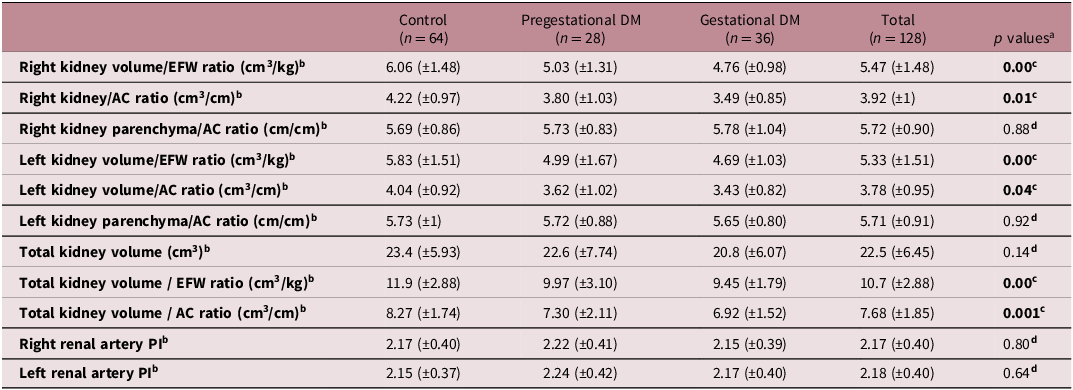
The blood flow parameters and measurements of fetal kidney size in the control, pre-gestational DM, and GDM groups are presented in Table 2. A statistically significant difference was observed in fetal kidney volume and its ratio to EFW and abdominal circumference (AC) between the study and control groups. Specifically, the right kidney volume/EFW ratio (F2,125 = 12.3, p < 0.001), right kidney volume/AC ratio (F2,125 = 6.99, p = 0.01), left kidney volume/EFW ratio (F2,125 = 8.3, p < 0.001), left kidney volume/AC ratio (F2,125 = 5.70, p = 0.04), total kidney volume/EFW ratio (F2,125 = 11.2, p < 0.001), and total kidney volume/AC ratio (F2,125 = 7.46, p = 0.001) were significantly different. Post-hoc analysis (Tukey’s individual pairwise comparison) indicated that these parameters were significantly higher in the control group than in both the pre-gestational DM and GDM groups. Our analysis suggests that maternal diabetes, both pre-gestational and gestational, is associated with reduced fetal kidney volumes and lower kidney volume/EFW and kidney volume/AC ratios, as illustrated in Fig. 5.
Kidney sizes and blood flows of fetuses in the diabetic and control group

DM, Diabetes Mellitus; EFW, estimated fetal weight; AC, abdominal circumference; PI, pulsatility index.
a Level of significance p < 0.05.
b Continuous variables are expressed as mean and standard deviation and were analyzed using One-way ANOVA test with Tukey’s post hoc individual pairwise comparison test.
c P ANOVA < 0.05 According to Tukey’s individual pairwise comparison statistically significant difference was observed between control and pregestational vs gestational diabetes mellitus group.
d P ANOVA > 0.05 One-way ANOVA test did not show statistical significance.
Scatter dot plot demonstrating total kidney volume-to-estimated fetal weight (EFW) ratios in the control, GDM, and pre-gestational DM groups. Individual fetal measurements are shown as dots, with median values displayed as horizontal bars. A significant reduction in the ratio was observed in both diabetic groups compared to controls (p < 0.05).

In contrast to the results mentioned above, the right kidney parenchyma/AC ratio (F2,125 = 0.11, p = 0.88), left kidney parenchyma/AC ratio (F2,125 = 0.08, p = 0.92), total kidney volume (F2,125 = 1.95, p = 0.14), right renal artery PI (F2,125 = 0.21, p = 0.80), and left renal artery PI (F2,125 = 0.44, p = 0.64) did not show statistically significant differences across the groups. This indicates that while kidney volumes and their ratios were affected, the parenchymal thickness relative to abdominal circumference and renal artery pulsatility indices remained comparable between the control and diabetic groups in this study.
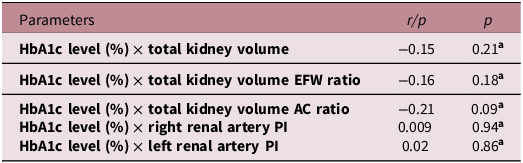
Pearson’s correlation analyses between HbA1c levels, fetal kidney size, and blood flow parameters among patients with diabetes are presented in Table 3. No statistically significant correlations were observed between HbA1c levels and fetal kidney sizes or blood flow parameters (p > 0.05).
Correlation analyses in the diabetic group in terms of HbA1c levels

HbA1c, hemoglobin A1c, %; EFW, estimated fetal weight; AC, abdominal circumference; PI, pulsatility index.
A p-value < 0.05 was considered statistically significant.
a Pearson’s correlation coefficient was used.
Discussion
This study investigated the effects of maternal diabetes mellitus, both pre-gestational and gestational, on fetal renal parameters in utero, including kidney dimensions, absolute and relative renal volumes, renal parenchymal thickness, and renal artery hemodynamics. Our demographic analysis showed significant differences in BMI, gravidity, and abortion rates among the groups, whereas age, gestational age, and estimated fetal weight were comparable. The higher BMI in diabetic groups is an expected finding, similar to previous reports, as obesity is a known risk factor for both pre-gestational and gestational DM. Reference Brennan, Kandasamy, Rudd, Schneider, Jones and Watson3 The differences in gravidity and abortion rates might reflect the complex reproductive history often associated with diabetic pregnancies or may be an incidental finding. As previously reported, the EFW in pregnancies complicated by diabetes tends to be higher, which may render gestational age estimation based solely on fetal biometry inaccurate. Reference Wong, Lee-Tannock, Amaraddio, Chan and McIntyre16 In the context of maternal hyperglycemia during pregnancy, glucose readily crosses the placenta and induces fetal hyperinsulinemia. Reference Brennan, Kandasamy, Rudd, Schneider, Jones and Watson3 Fetal insulin, a key regulator of cellular growth, alters the levels of fibroblast growth factors and insulin-like growth factors and provides a stimulatory environment for fetal organomegaly and macrosomia. Reference Neves, Sgarbosa and Calderon17 However, in our study, EFW did not differ significantly among the groups, potentially due to relatively well-controlled glycemic status of diabetic mothers. In our study, the comparability of gestational age and EFW among the groups is crucial, as it eliminates these variables as potential confounders between diabetic and control patients, thereby enhancing the reliability of our findings.
As mentioned above, diabetes during pregnancy is a leading cause of large for gestational age (LGA) (birth weight > 90 centile for gestational age) fetuses due to increased fetal fat and protein accumulation. Reference Araujo Júnior, Peixoto, Zamarian, Elito Júnior and Tonni18 Given that fetuses of diabetic mothers typically exhibit organomegaly and overgrowth, it can be hypothesized that their kidneys would also be proportionally larger than those in the control group. To calculate renal volume, the longitudinal, mediolateral, and anteroposterior diameters of each kidney were measured. Renal volume was then calculated and adjusted for EFW and AC to account for fetal growth. Our findings indicate that although the absolute total kidney volume did not differ significantly between control and diabetic pregnancies (p = 0.14), normalization to fetal size revealed significantly lower kidney volume–based ratios in both the pre-gestational and gestational diabetes groups compared with controls. These results suggest that maternal diabetes alters fetal kidney growth patterns, not only in absolute size but also relative to overall fetal growth. In the literature, few studies have investigated the impact of hyperglycemia on fetal kidneys, and their results have been conflicting. In a longitudinal prospective study, Neves et al. reported that fetal kidney volumes were larger in hyperglycemic pregnancies than in the control group, likely because of the organomegaly-inducing effect of fetal hyperinsulinemia. Reference Neves, Sgarbosa and Calderon17 In contrast, Pylypjuk et al. found a significant reduction in renal width and thickness in fetuses exposed to pre-gestational type 2 diabetes at 18–22 weeks of gestation, with kidneys being approximately 35% smaller in both dimensions compared to healthy controls, consistent with our findings. Reference Pylypjuk, Day, ElSalakawy and Reid19 In another cross-sectional study, Hokke et al. measured fetal kidney volumes in pregnancies complicated by GDM and in healthy controls between 32 and 34 weeks of gestation and found no significant differences between the groups. Reference Hokke, de Zoysa and Carr12 Similarly, Verburg et al. evaluated the effects of various maternal and fetal factors on fetal kidney volume and found no association with maternal diabetes. Reference Verburg, Geelhoed and Steegers20 Despite conflicting results in the literature, although our study did not directly measure nephron number, the observed alterations in kidney volume may reflect developmental programming that affects total nephron endowment, a critical determinant of lifelong renal health. Reference Schreuder6 The most striking finding of our study suggests that while absolute kidney size may not be significantly different in relation to overall fetal size, the kidneys in diabetic pregnancies are relatively smaller. This observation highlights the potential programming effects of an adverse intrauterine environment, consistent with the “Developmental Origins of Health and Disease” concept. Reference Lee, Collins, Gordon, Rae and Pringle10
A critical aspect of our study was the measurement of RPT which provides the estimation of nephron numbers, as the parenchyma comprises the nephron-rich renal cortex and medulla. Reference Brennan, Watson, Schneider, Rudd and Kandasamy21 Interestingly, despite the observed reduction in relative kidney volume, our study found no significant differences in the renal parenchyma/AC ratios among the control, GDM, and pre-gestational DM groups. This finding is in agreement with the results of Brennan et al., who demonstrated that although absolute RPT was significantly greater in fetuses of mothers with gestational diabetes, the difference disappeared once the measurement was corrected for AC. Reference Brennan, Kandasamy, Rudd, Schneider, Jones and Watson3 Similarly, in their pre-gestational diabetes subgroup, no significant difference in RPT was observed despite larger fetal size, which aligns with our findings. Reference Brennan, Kandasamy, Rudd, Schneider, Jones and Watson3 Our findings, particularly the lack of significant difference in the parenchyma/AC ratio, suggest that, although relative kidney volume is affected, relative RPT may be preserved or exhibit a different response depending on diabetes management. Alternatively, subtle changes in RPT might be difficult to detect with current ultrasound methodologies, or the study might not have been sufficiently powered to detect smaller, yet clinically relevant, differences in this specific parameter.
Recent evidence suggests that the effects of maternal diabetes on fetal kidney development extend beyond structural abnormalities demonstrated in animal models, where hyperglycemia has been shown to impair nephrogenesis and lead to immature glomeruli, tubular degeneration, and reduced nephron formation, leading to impaired renal function in adulthood. Reference Kassab, Hussein, Mahmoud and Abdel-Alrahman22,Reference Abi Khalil, Travert and Fetita23 The recent review by Tortelote further highlights that these alterations may be mediated through epigenetic mechanisms – including DNA methylation and non-coding RNA regulation – which can disrupt nephron endowment even in the absence of overt sonographic abnormalities. Reference Tortelote11 Although our findings on RPT suggest a limited impact on nephron number as detected by this specific parameter, the observed reduction in relative kidney volume may still reflect subtle architectural changes or early features of developmental programming that are not yet evident as RPT differences at this gestational age. The long-term implications of even modestly smaller kidneys, as indicated by the volume ratios, may include an increased susceptibility to hypertension and kidney disease later in life, aligning with the “low nephron number” hypothesis. Reference Luyckx and Brenner24
Furthermore, our analysis of renal artery hemodynamics, specifically the PI for both right and left renal arteries, did not reveal any statistically significant differences among the groups. Similar to our results, Brennan et al., who investigated RPT as an indirect measure of nephron number, found no significant differences in the PI or RI of the fetal renal arteries between growth-restricted and appropriately grown fetuses. Reference Brennan, Watson, Schneider, Rudd and Kandasamy21 The lack of a detectable difference in renal artery hemodynamics may be explained by the very low blood flow to fetal kidneys (approximately 5% of cardiac output), making subtle changes difficult to detect with ultrasonography. Our findings contrast with reports in the literature suggesting that elevated maternal blood glucose levels may influence fetal hemodynamic parameters, including those of the renal arteries. Reference Cai and Yan14 Cai and Yan reported increased PI and RI in the fetal renal arteries in the pregnancies complicated by hyperglycemia. Reference Cai and Yan14 This discrepancy may be attributed to various factors, including differences in study populations, severity of diabetes, glycemic control, or the specific gestational age at which measurements were taken. It is possible that well-controlled diabetes or specific characteristics of our study cohort might have diminished some of the hemodynamic alterations reported in previous studies. Future research should explore the nuances of glycemic control and its direct impact on fetal renal hemodynamics.
In our study, we found no significant correlation between HbA1c levels and fetal kidney volume or renal artery blood flow parameters. This finding suggest that effective treatment and management of diabetes in these pregnancies may have eliminated some of the adverse effects of hyperglycemia on fetal kidney development, as reflected by the relatively well-controlled HbA1c levels in our diabetic cohort. Previous studies indicate that appropriate management of maternal diabetes and a well-controlled glycemic status can reduce adverse perinatal and maternal outcomes. Reference Lee, Collins, Gordon, Rae and Pringle10,Reference Cappuccini, Torlone and Ferri25 Similarly, some studies have found normal fetal kidney volume in offspring of women with treated GDM, and this emphasizes the importance of glycemic control in diabetic pregnancies. Reference Hokke, de Zoysa and Carr12
The strengths of our study are the detailed ultrasonographic measurements and categorization of diabetes types, providing a more nuanced view of the effects of maternal diabetes on fetal kidneys. The limitations of this study include the cross-sectional nature of the primary kidney measurements, which limits the ability to assess dynamic trends in kidney growth over time. Additionally, the relatively small sample size of pre-gestational and gestational DM groups may limit the statistical power to detect more subtle effects on fetal kidneys. Furthermore, our study did not assess the long-term renal outcomes in the offsprings, which is crucial in terms of delayed manifestations of programmed kidney disease. The specific treatment regimens (diet, oral hypoglycemic agents, or insulin) and the degree of glycemic control throughout pregnancy were not directly correlated with the kidney outcomes in this specific analysis, which could potentially mask some underlying effects of hyperglycemia.
In conclusion, this study contributes to the understanding of how maternal diabetes impacts fetal renal development, demonstrating that it significantly alters fetal kidney volumes and their proportionality to fetal size. Although no significant differences were observed in RPT relative to AC or in renal artery Doppler studies, the reduced relative fetal kidney volumes in both pre-gestational and gestational DM suggest a potential for diminished nephron endowment and subsequent long-term renal health implications for the offspring. These findings underscore the importance of careful monitoring of fetal renal growth in pregnant women with diabetes. Further longitudinal studies with larger cohorts, incorporating detailed assessments of glycemic control, treatment types, and postnatal follow-up into childhood are warranted to clarify long-term renal outcomes and to explore the precise mechanisms underlying these developmental changes.
Acknowledgment
None.
Financial support
This research received no specific grant from any funding agency, commercial or not-for-profit sectors.
Competing interests
None.
Ethical standards
The study was approved by the institutional ethics committee (Başakşehir Çam and Sakura City Hospital ethical committee, approval number: 2024/245) and was conducted in accordance with the principles of the Declaration of Helsinki.