INTRODUCTION
The geographical distribution and the use that species make of different habitats depend, basically, on the combination of their requirements and tolerances (Grémillet et al., Reference Grémillet, Kuntz, Delbart, Mellet, Kato, Robin, Chaillon, Gendner, Lorentsen and Le Maho2004; Guisan & Thuiller, Reference Guisan and Thuiller2005). Killer whale, Orcinus orca (Linnaeus, 1758), is considered a cosmopolitan species. It is more frequently encountered in coastal areas and continental borders, especially in high latitudes (Heyning & Dahlheim, Reference Heyning and Dahlheim1988). In pelagic waters, the species is more abundant in high productive areas, near the shelf break (Forney & Wade, 2007). The temporal pattern also varies regionally. In some places killer whales occur year round while in others they are seasonal (Heyning & Dahlheim, Reference Heyning and Dahlheim1988). Particularly, on the south-western Atlantic Ocean coast, reports of killer whales increased towards the south (Heyning & Dahlheim, Reference Heyning and Dahlheim1988; Bastida et al., Reference Bastida, Rodriguez, Secchi and Da Silva2007; Dalla Rosa & Secchi, Reference Dalla Rosa and Secchi2007). Previous studies in this coastal region, identified a seasonal population of less than 30 individuals in northern Patagonia (Argentina), and suggested the existence of two other populations, one inhabiting the vicinity of the Falkland/Malvinas Islands and the other along the northern Argentinean coast. The latter would be the same that occurs in Uruguay and southern Brazil, according to data based on the saddle patch pattern (Iñíguez et al., Reference Iñíguez, Secchi, Tossenberger and Dalla Rosa1994). Along the Uruguayan and Brazilian coast, up to the northernmost record of killer whales (0°55′N 29°20′W: Dalla Rosa et al., Reference Dalla Rosa, Secchi, Lailson-Brito and Azevedo2007), reports of this species are based on strandings (e.g. Ott & Danilewicz, Reference Ott and Danilewicz1998; Dalla Rosa et al., Reference Dalla Rosa, Secchi, Lailson-Brito and Azevedo2007; Iriarte, unpublished data) and occasional sightings, mainly during spring and summer (Lodi & Hetzel, Reference Lodi and Hetzel1998; Siciliano et al., Reference Siciliano, Lailson Brito and Azevedo1999; Pinedo et al., Reference Pinedo, Polacheck, Barreto and Mammardo2002; Zerbini et al., Reference Zerbini, Secchi, Bassoi, Dalla Rosa, Higa, De Sousa, Moreno, Moller and Caon2004; Iriarte, Reference Iriarte2006; Dalla Rosa et al., Reference Dalla Rosa, Secchi, Lailson-Brito and Azevedo2007). In the adjacent open ocean, records come from studies on the interaction between cetaceans and pelagic longline fisheries, which indicate the occurrence of the species in Uruguayan and Brazilian Exclusive Economic Zones (EEZs) and international waters, particularly over the shelf break and continental slope, during winter and spring (Secchi & Vaske Jr, Reference Secchi and Vaske1998; Brum & Marín, Reference Brum, Marín, Arena and Rey2000; Dalla Rosa & Secchi, Reference Dalla Rosa and Secchi2007; Dantas, Reference Dantas2007; Passadore et al., Reference Passadore, Szephegyi, Domingo and Mora2007; Monteiro, Reference Monteiro2008; Hernandez-Milian et al., Reference Hernandez-Milian, Goetz, Varela-Dopico, Rodriguez-Gutierrez, Romon-Olea, Fuertes-Gamundi, Ulloa-Alonso, Tregenza, Smerdon, Otero, Tato, Wang, Santos, Lopez, Lago, Portela and Pierce2008).
Generally, primary production is high in frontal areas, playing a key role in ecological processes, concentrating marine biomass (Acha et al., 2004; Palacios et al., Reference Palacios, Bograd, Foley and Schwing2006; Alemany et al., Reference Alemany, Acha and Iribarne2009), which leads to a significant food supply and/or possible suitable breeding habitats for many nektonic species, such as fish and squid, as well as their predators, including fisheries (Acha et al., 2004; Sinclair et al., Reference Sinclair, Moore, Fiday, Zeppelin and Waite2005). Cetaceans are highly mobile and have high energy requirements, so their presence is often associated directly with environmental variables such as ocean fronts of high primary productivity, which tend to concentrate their prey (Tynan et al., Reference Tynan, Ainley, Barth, Cowles, Pierce and Spear2005; Kaschner et al., Reference Kaschner, Watson, Trites and Pauly2006). As previously mentioned, killer whales are not randomly distributed in the ocean and its distribution may be related to several factors such as water temperature (Sinclair et al., Reference Sinclair, Moore, Fiday, Zeppelin and Waite2005) or the availability and distribution of their prey (López & López, Reference López and López1985; Heyning & Dahlheim, Reference Heyning and Dahlheim1988; Iñíguez, Reference Iñíguez2001; Pitman & Ensor, Reference Pitman and Ensor2003; Ford et al., Reference Ford, Ellis, Olesiuk and Balcomb2010; Reisinger et al., Reference Reisinger, de Bruyn, Tosh, Oosthuizen, Mufanadzo and Bester2011). For example, the individuals of North Patagonia, make seasonal movements associated to increases in the availability of prey, hence, according to the calving periods of sea lions (Otaria flavescens) and elephant seals (Mirounga leonina) (Iñíguez, Reference Iñíguez2001). In addition, previous studies suggest that the presence of killer whales in the south-western Atlantic would be linked to areas of high productivity (Lodi & Hetzel, 1998; Siciliano et al., 1999) and fronts (Passadore et al., 2007). Therefore, marine fronts should be considered in ecological studies seeking to understand the feeding and reproductive strategies of populations, to integrate biological and physical processes (Acha et al., 2004; Alemany et al., 2009).
Killer whale forms small populations, which show substantial differences in feeding habits, behaviour, genetics, morphology, movement patterns and demography, including sympatric populations that do not interact between them (e.g. Baird et al., Reference Baird, Abrams and Dill1992; Matkin & Sautilis, Reference Matkin, Sautilis, Barrett-Lennard, Ford, Guinet, Similä and Ugarte1994; Hoelzel et al., Reference Hoelzel, Dahlheim and Stern1998; Baird, 2000; Ford, Reference Ford, Perrin, Wursig and Thewissen2002). The understanding of spatial and temporal patterns of killer whale occurrence in the south-western Atlantic Ocean and the identification of high occurrence areas is needed. Such information is essential for estimating abundance and demographic parameters and, eventually, for evaluating the potential threats and the conservation status of the populations. Besides, the effect of environmental variables or fishing operations on the presence of this species remains unknown.
The identification of areas and periods of major occurrence can be achieved through fishermen data, especially because they cover a large open ocean area and, in many cases, also a large time scale (e.g. Irish et al., Reference Irish, Ford, Barrett-Lennard, Trites, Barrett-Lennard, Ford, Guinet, Similä and Ugarte2002). As killer whales seem to recognize and follow longlining boats to eat their catch, adversely affecting the fishery (Donoghue et al., 2002), many fishermen are recording the depredation events as well as the presence of killer whales within their fishing grounds.
Our hypothesis for the present work is that killer whale occurrence will be higher in areas of high primary production such as fronts and eddies, because these areas tend to concentrate prey. Our second hypothesis is that killer whales might detect fishing vessels and predate upon their capture, therefore, the presence of the species in the south-western Atlantic will also be related to operational characteristics of the fisheries. The main objectives of this study were to: (1) determine the spatial and temporal distribution of killer whales within the Uruguayan pelagic longline fishing ground; and (2) assess the potential effect of environmental and fishing operational variables on killer whale presence.
MATERIALS AND METHODS
Study area
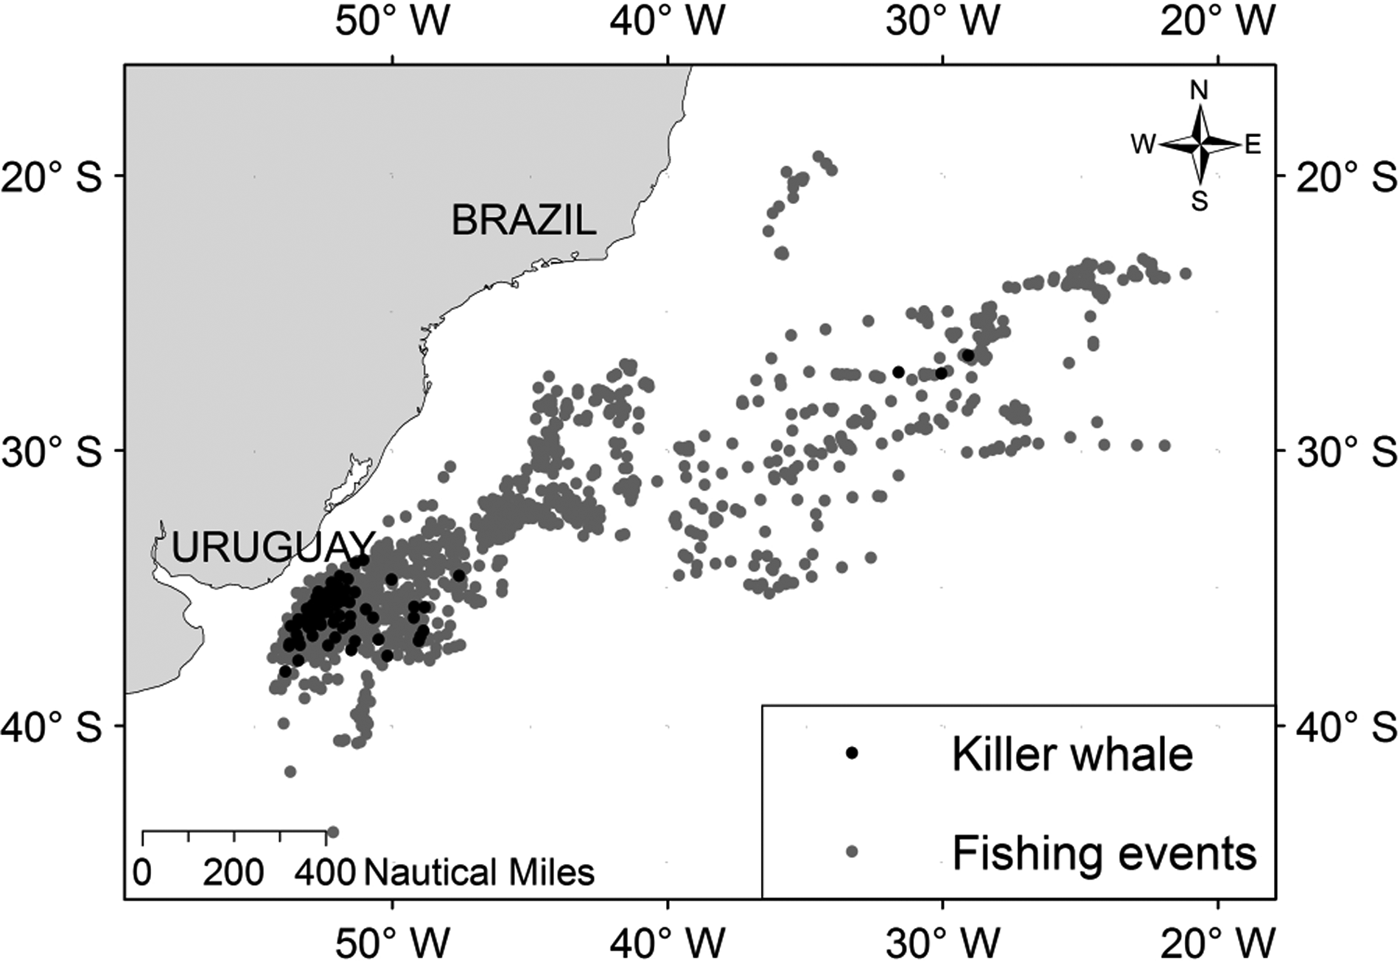
Data collected by Uruguayan pelagic longline fishing vessels included the Uruguayan EEZ and international waters, from 19° to 40°S and 21° to 54°W, including shelf brake, continental slope and deep waters of the south-western Atlantic Ocean (Figure 1). This region is characterized mainly by a northern subtropical zone, dominated by warm waters from the Brazil Current (average temperatures of 22–23°C) and a southern zone, dominated by sub-Antarctic waters from the Falkland/Malvinas Current (average temperatures of 6°C) (Brandini et al., Reference Brandini, Boltovskoy, Piola, Kocmur, Röttgers, Abreu and Mendes Lopes2000). Where these two currents converge, a mixture zone occurs, the Brazil–Malvinas Confluence, which moves seasonally between 30°–50°S and 40°–60°W. Temperature in the confluence decreases southward, ranging from 19–20°C in the north to 8–9°C in the south (Olson et al., Reference Olson, Podestá, Evans and Brown1988; Brandini et al., Reference Brandini, Boltovskoy, Piola, Kocmur, Röttgers, Abreu and Mendes Lopes2000; Acha et al., Reference Acha, Mianzan, Guerrero, Favero and Bava2004; Barré et al., Reference Barré, Provost and Saraceno2006). In addition, in the south-western margin of the Atlantic Ocean between 30° and 41°S, there are several nutrient inputs, mainly from the Rio de la Plata (35°–36°S) and Patos Lagoon (30°–32°S) estuaries (Acha et al., Reference Acha, Mianzan, Guerrero, Favero and Bava2004; Braga et al., Reference Braga, Chiozzini, Berbel, Maluf, Aguiar, Charo, Molina, Romero and Eichler2008).
Location of the fishing days with killer whale sightings (black dots) and without sightings (grey dots) of the Uruguayan surface longline fleet monitored by skippers and observers during the period 1996–2007.

Data collection
Data were collected by skippers in their logbooks, between 1996 and 2006, and by scientific observers from the National Observer Programme of the Tuna Fleet (Programa de Observadores a bordo de la flota atunera, PNOFA), between 1998 and 2007. This fleet uses American monofilament or Spanish multifilament longline and targets mainly tuna (Thunnus obesus, T. albacares and T. alalunga), swordfish (Xiphias gladius) and pelagic sharks such as blue shark (Prionace glauca) (Domingo et al., Reference Domingo, Mora and Cornes2002; Mora & Domingo, Reference Mora and Domingo2006).
For each fishing day the following were recorded: killer whale presence/absence and number of individuals whenever possible, date, start and end time of setting and hauling of the longline, geographical position (latitude and longitude) at the beginning of the set and sea surface temperature (SST; minimum and maximum), measured in situ with boat thermometer every time a radio-buoy was set or hauled. The SST variation was calculated from the maximum and minimum temperature recorded in situ, and could be used as an indicator of the presence of a SST front along the fishing haul. We determined the duration of the set as the time between the end of the set and the end of the haul. Each season was established according to the day of start of the set as: winter (from 22 June to 21 September); spring (from 22 September to 21 December); summer (from December 22 to 21 March); and autumn (from 22 March to 21 June).
For each set, the distance from shore and depth were determined using coastline maps and global bathymetry databases, respectively (ETOPO-20; http://monsoondata.org). The slope of each set was then calculated as the difference between the deepest and the shallowest points of the start/end of the setting.
Data analysis
We selected only those surveys for which skippers or observers were trained in the identification of killer whales, and when they performed a complete record of the species presence/absence and the variables considered relevant for the analysis. When the hauling manoeuvre was carried out during daylight involving an observer on the deck, or a skipper on the bridge, it was considered as a day of sighting effort. Among these, a sighting was considered as a day of sighting effort when one or more killer whales were observed directly at least once. For the modelling analysis it was not considered the number of individuals recorded per day of effort, mainly because this information was not always recorded.
We determined the killer whale occurrence in relation to the sighting effort and compared among different spatial and temporal scales. To do so, we defined the sighting rate (SR) as follows:
 $${\rm SR}={\rm SD}/{\rm FD} \;\ast\, 100$$
where SD is the number of days with at least one sighting and FD the number of days of sighting effort. This rate was calculated for the entire fishing ground, considering two different time scales (annual and monthly), and in 1 × 1 degree grids (total and accumulated seasonally).
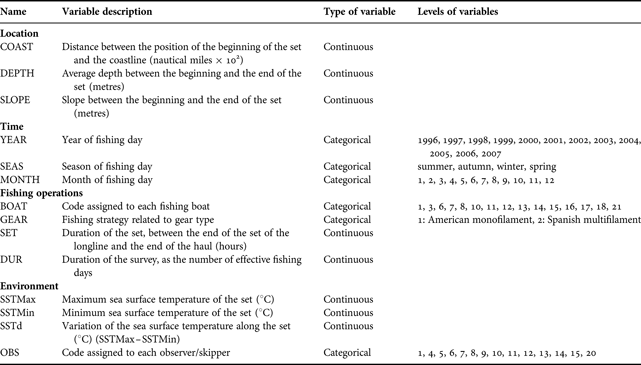
Generalized Linear Models (GLM; McCullagh & Nelder, Reference McCullagh and Nelder1989) were used to evaluate the effect of spatial, temporal, environmental and fishing operational variables on the killer whale presence. In GLMs, the occurrence of killer whales (ϒi: binomial distribution; 1 = presence and 0 = absence) was analysed as a function of the explanatory variables considered as relevant a priori for this species (see Table 1 for description). The models were constructed using stepwise process and following the selection criteria of the Akaike information criterion (AIC) as described in Marques & Buckland (Reference Marques and Buckland2003). Model selection was based on ΔAICi values lower than 2, calculated as the difference between the AIC values for each model and the model with lowest AIC (Burnham & Anderson, Reference Burnham and Anderson2002). For the final models with ΔAICi values lower than 2 the explained deviance was determined (D2 = (Null Deviance-Residual Deviance)/Null Deviance * 100), which corresponds to the percentage of data deviance explained by the selected models in relation to the null model that do not contain explanatory variables. Finally, the model with the lowest AIC was selected to explain the occurrence of killer whales. Statistical analysis was performed using the free software R (R Development Core Team, 2008).
List of explanatory variables included in generalized linear models to model the occurrence of killer whales (binary response variable) in the south-western Atlantic detected by the Uruguayan longline fishery. The name of each variable entered into the models, description of each one, type and levels of the categorical variables are presented.
RESULTS
Spatial and temporal distribution of killer whales
In general, the 2189 fishing events monitored between 1996 and 2007 (875 by skippers and 1313 from PNOFA observers) were performed in the area comprised between 19° and 40°S and 21° and 54°W (Figure 1). This effort corresponds to the 22.2% of the total fishing events made by the fleet. Killer whales were sighted in 100 of these 2189 fishing days (SR = 4.5%) and occurred mainly between the latitudes 34°–37°S and the longitudes 48°–53°W, except for three sightings that occurred at 27°–28°S, between 28° and 31°W (Figure 1).
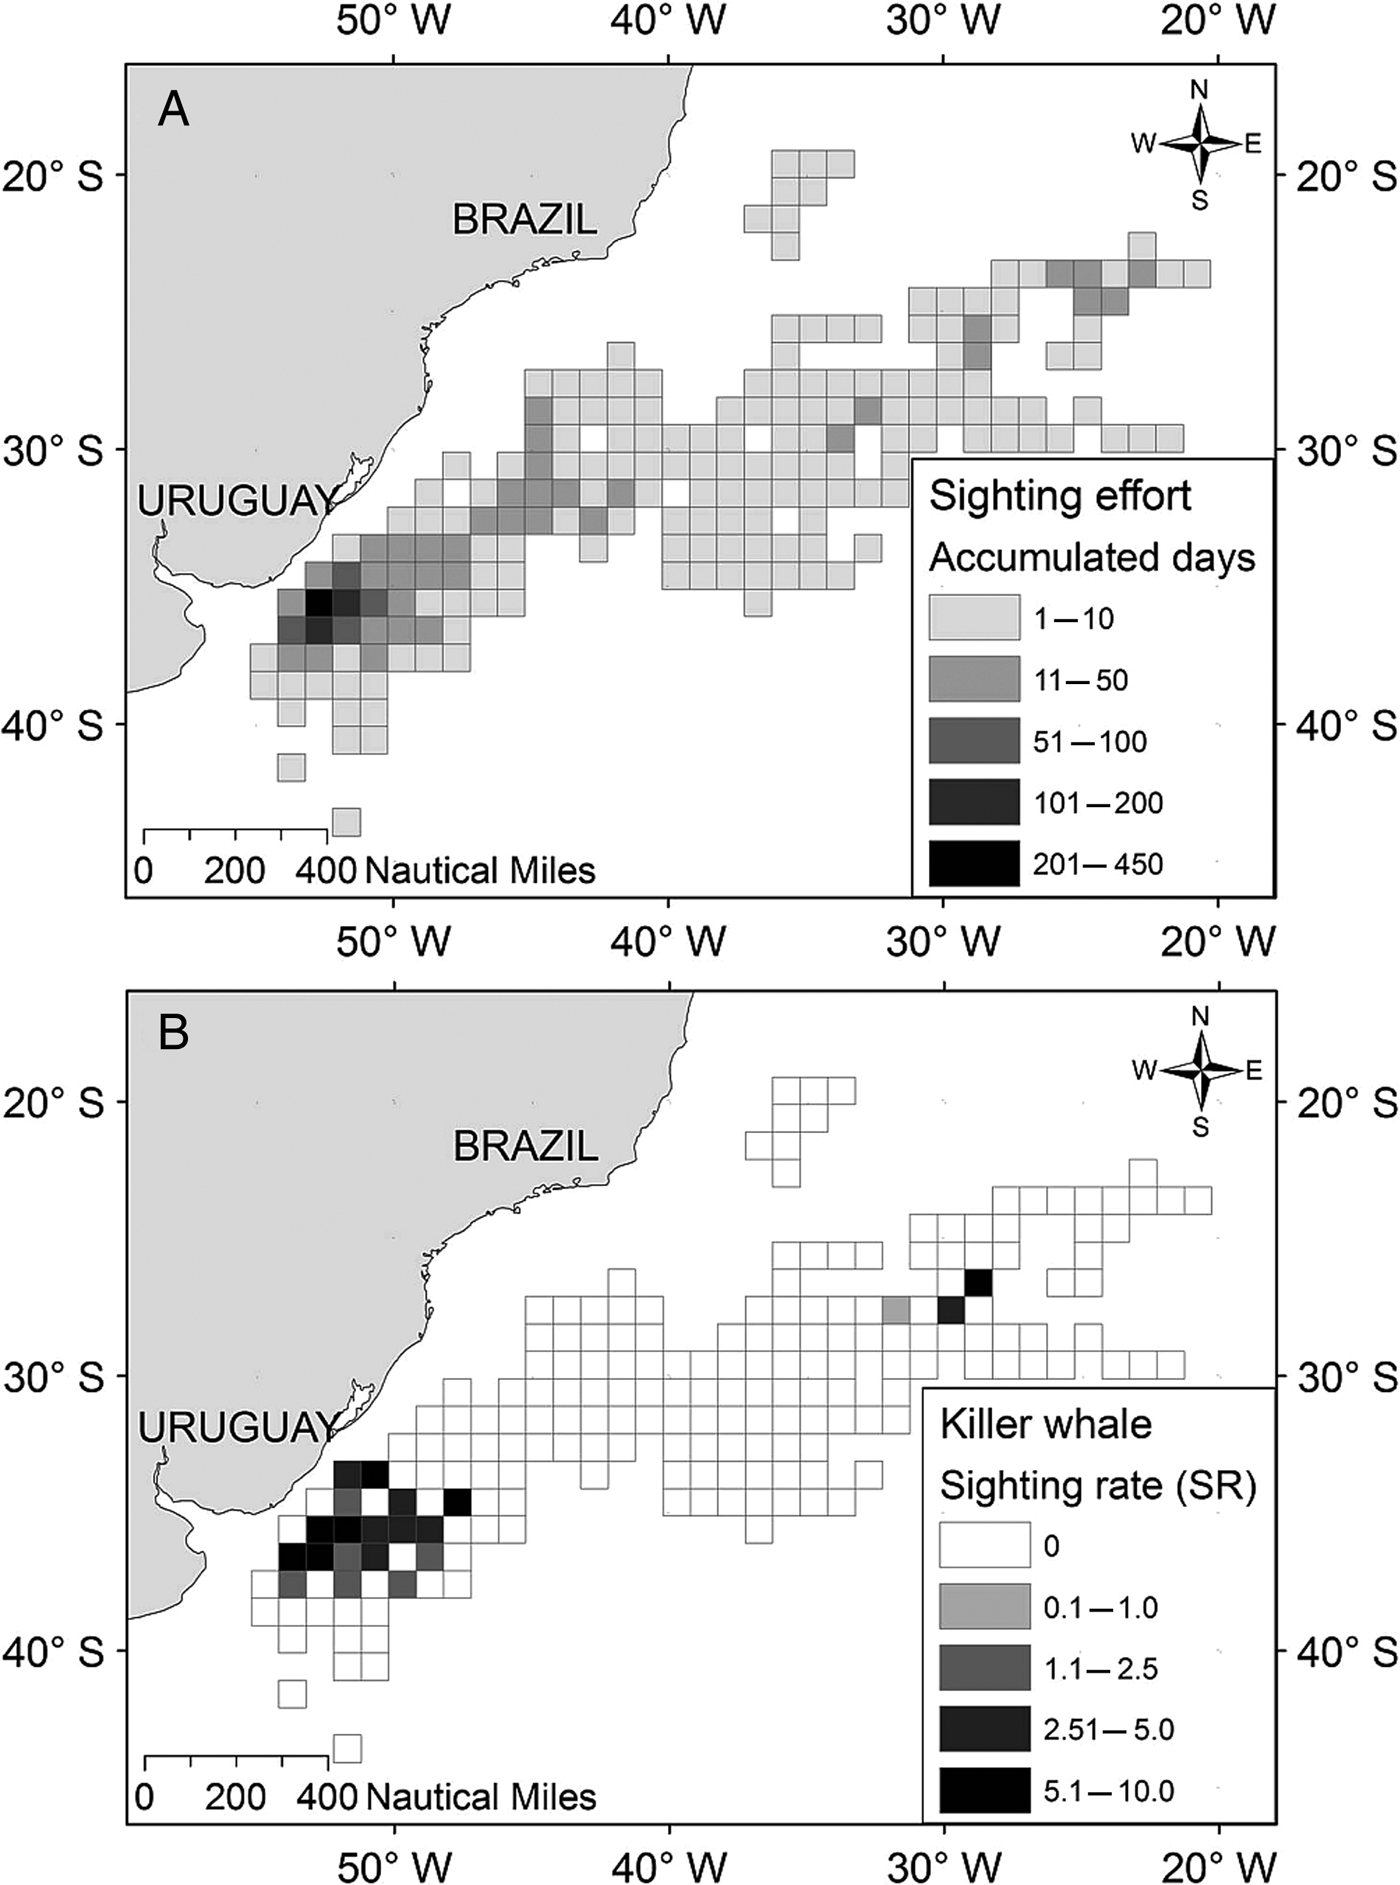
The highest sighting rates were recorded in the grids between 35°–36°S and 51°–53°W and the species was present in nearly 10% of the sets in the grids between 33°S–50°W and 34°S–47°W (Figure 2B).
Accumulated sighting effort (A) and sighting rate (SR = sightings days/fishing days * 100) for killer whales (B) in areas of 1 × 1 degree for the period 1996–2007.
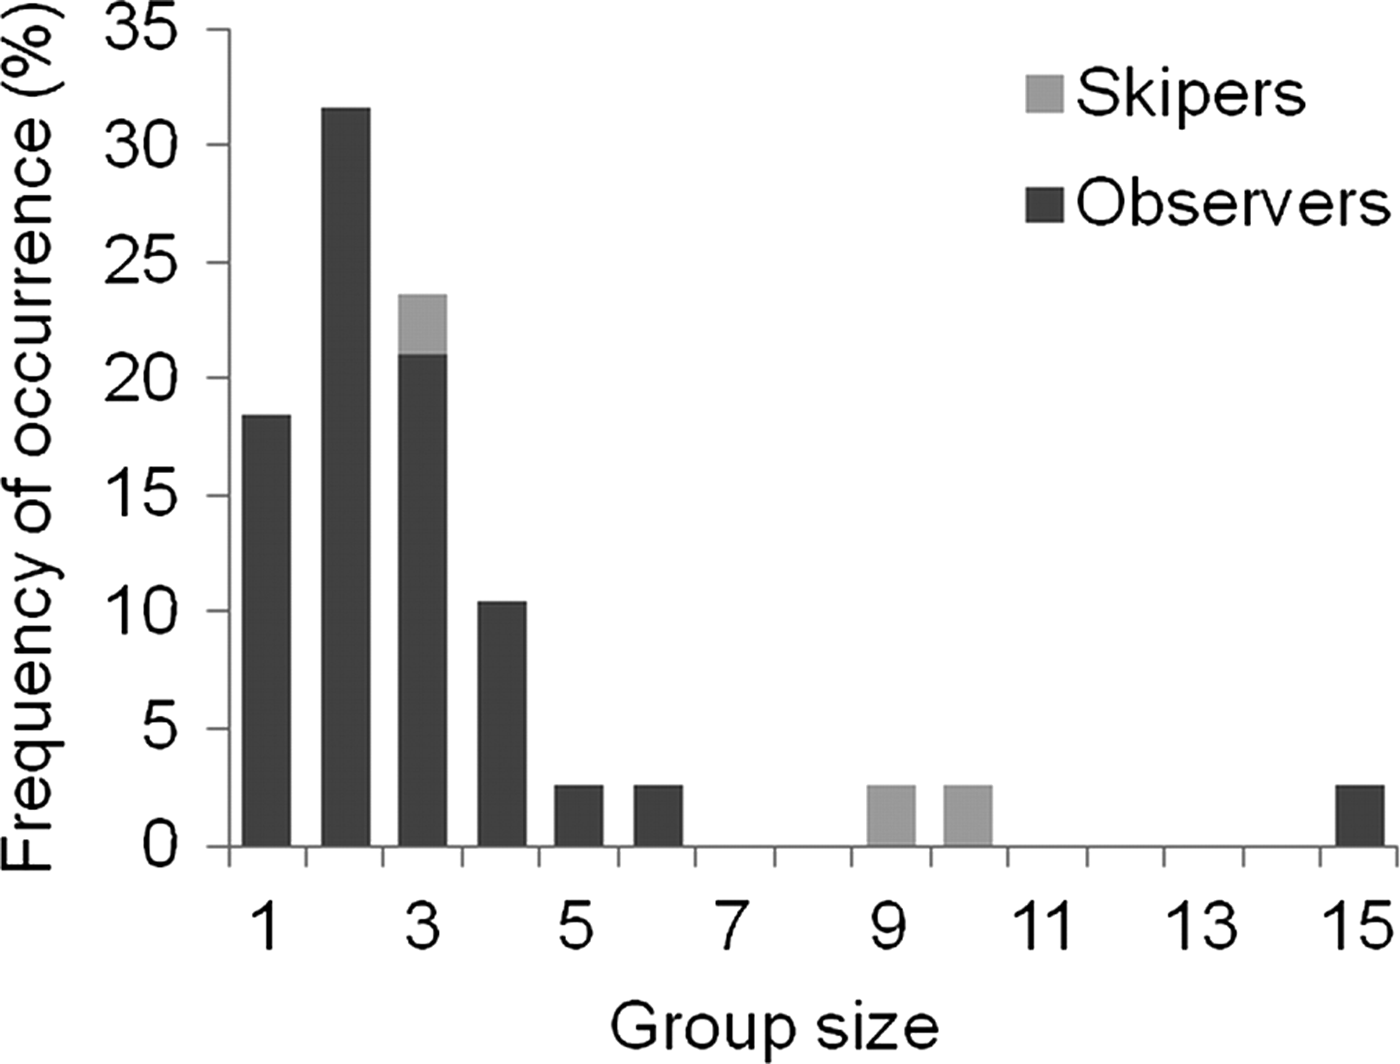
The group size was recorded in only 38% of the sightings, which corresponds to 34 records by observers and only three by skippers. The group size of two individuals was the most frequently recorded (31%), followed by groups of three and one whale. Though groups composed of up to 15 individuals were also observed (Figure 3).
Killer whale groups sighted by skippers and observers of the Uruguayan surface longline fleet in the south-western Atlantic (N = 38). The frequency of occurrence (%) of the number of individuals per group is shown.
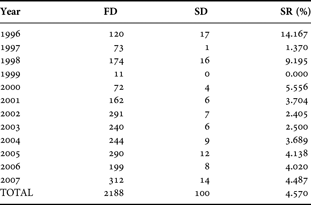
Killer whale presence was reported for all surveyed years (1996–2007), except in 1999 coinciding with a low number of fishing days monitored (Table 2). The maximum sighting rate occurred in 1996 and has remained stable since 2004 (Table 2).
Total number of fishing days (FD) and days with presence of killer whales (SD) for the period 1996–2007, recorded by skippers and observers. The sighting rate (SR = SD/FD * 100) of killer whales per year is presented.
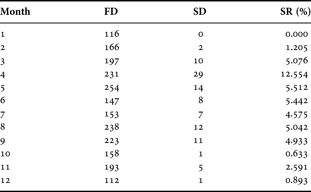
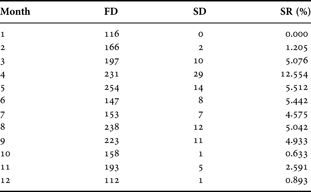
The highest sighting rate, for the whole study period accumulated, occurred during autumn (SR = 8.1), mainly in April (Table 3), and followed by winter (SR = 4.2), when it was about fourfold higher than spring and summer (2.3 and 2.6, respectively). Sightings were very low from December to February, with no records of killer whales in January, despite the large number of fishing events surveyed throughout the study period (Table 3).
Monthly number of fishing days (FD) and days with presence of killer whales (SD) accumulated for the period 1996–2007, recorded by skippers and observers. The sighting rate (SR = SD/FD * 100) of killer whales per month is presented.
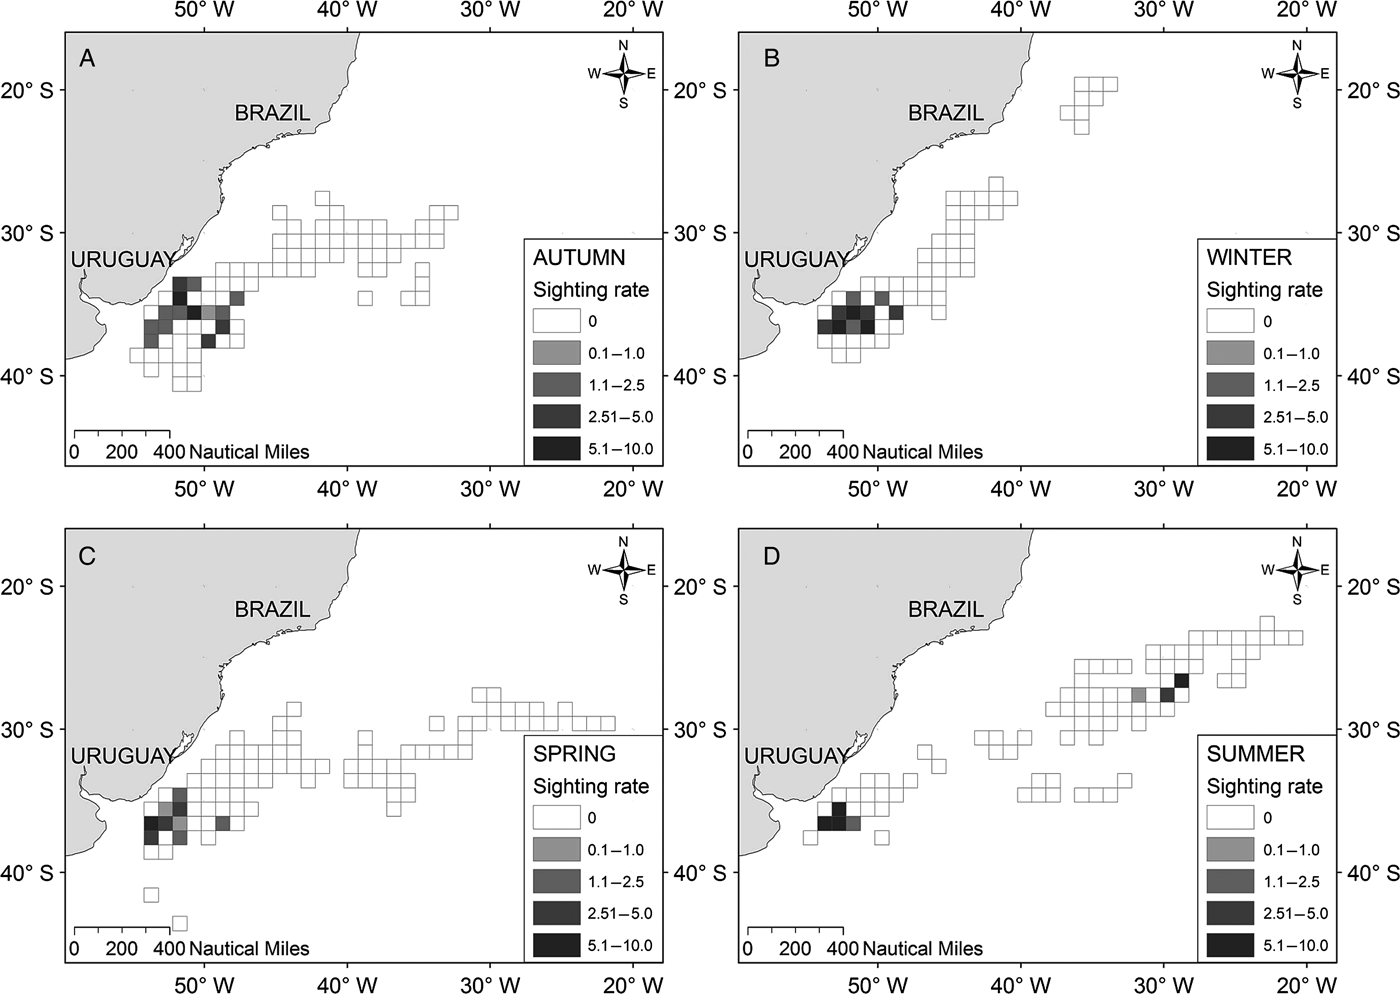
Within the area comprising 35°–36°S and 51°–53°W, the SR remained relatively high along seasons (Figure 4). Furthermore, the species was also present in the vicinity of that area during autumn, winter and spring (Figure 4A, B, C), while in summer, only few sightings were made northward and very far from the coast (Figure 4D), but it is worthwhile noting that the total number of fishing days was very low in these quadrants (Figure 2A).
Killer whales sighting rate (SR = sightings days/fishing days * 100) in areas of 1 × 1 degree accumulated seasonally for the period 1996–2007: (A) autumn; (B) winter; (C) spring; (D) summer.
Environmental and operational variables explaining killer whale presence
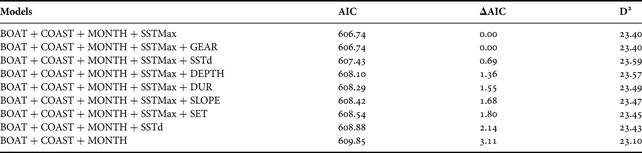
After excluding fishing events with missing data on vessels identity (N = 158) and set duration (N = 136), a total of 1877 fishing events were included in the analysis to model the occurrence of killer whales in the south-western Atlantic. Exploratory analysis indicated a strong correlation between SSTMax and SSTMin (R2 = 0.864). Lack of or weak correlation was found between SSTd and SSTMax (R2 = 0.019) and between SSTd and SSTMin (R2 = 0.243). Hence, the variable SSTMax was never included together with SSTMin to build the models. No correlation was found between any pair of the remaining variables which were, therefore, included in the model. Among the 62 models generated, only seven presented ΔAIC values lower than 2 and all of them explained approximately 23% of the deviance of the data (Table 4). The model that best explains (lowest AIC) the occurrence of killer whales included the following explanatory variables: boat, distance from shore, month and maximum SST. Among all the variables of the selected model, distance from shore and maximum SST showed a significant contribution (Table 5).
Binomial models obtained in the stepwise process to explain the occurrence of killer whales detected by surface longline vessels. Model terms are described in Table 1. The models with better fit to the data are presented sorted according to Akaike information criterion (AIC) values. Note that 7 models presented values of ΔAIC lower than 2. The explained deviance (D2) is shown.
Estimates of the selected binomial distribution model to explain the occurrence of killer whales detected by skippers and observers of the surface longline vessels. Model terms are described in Table 1. The value of each of the estimates is shown; for categorical variables, the category is presented in parentheses before the value. Significance of each model term: ***, P = 0–0.001; **, P = 0.001–0.01; *, P = 0.01–0.05; P = 0.05–0.1; °, P > 0.1.
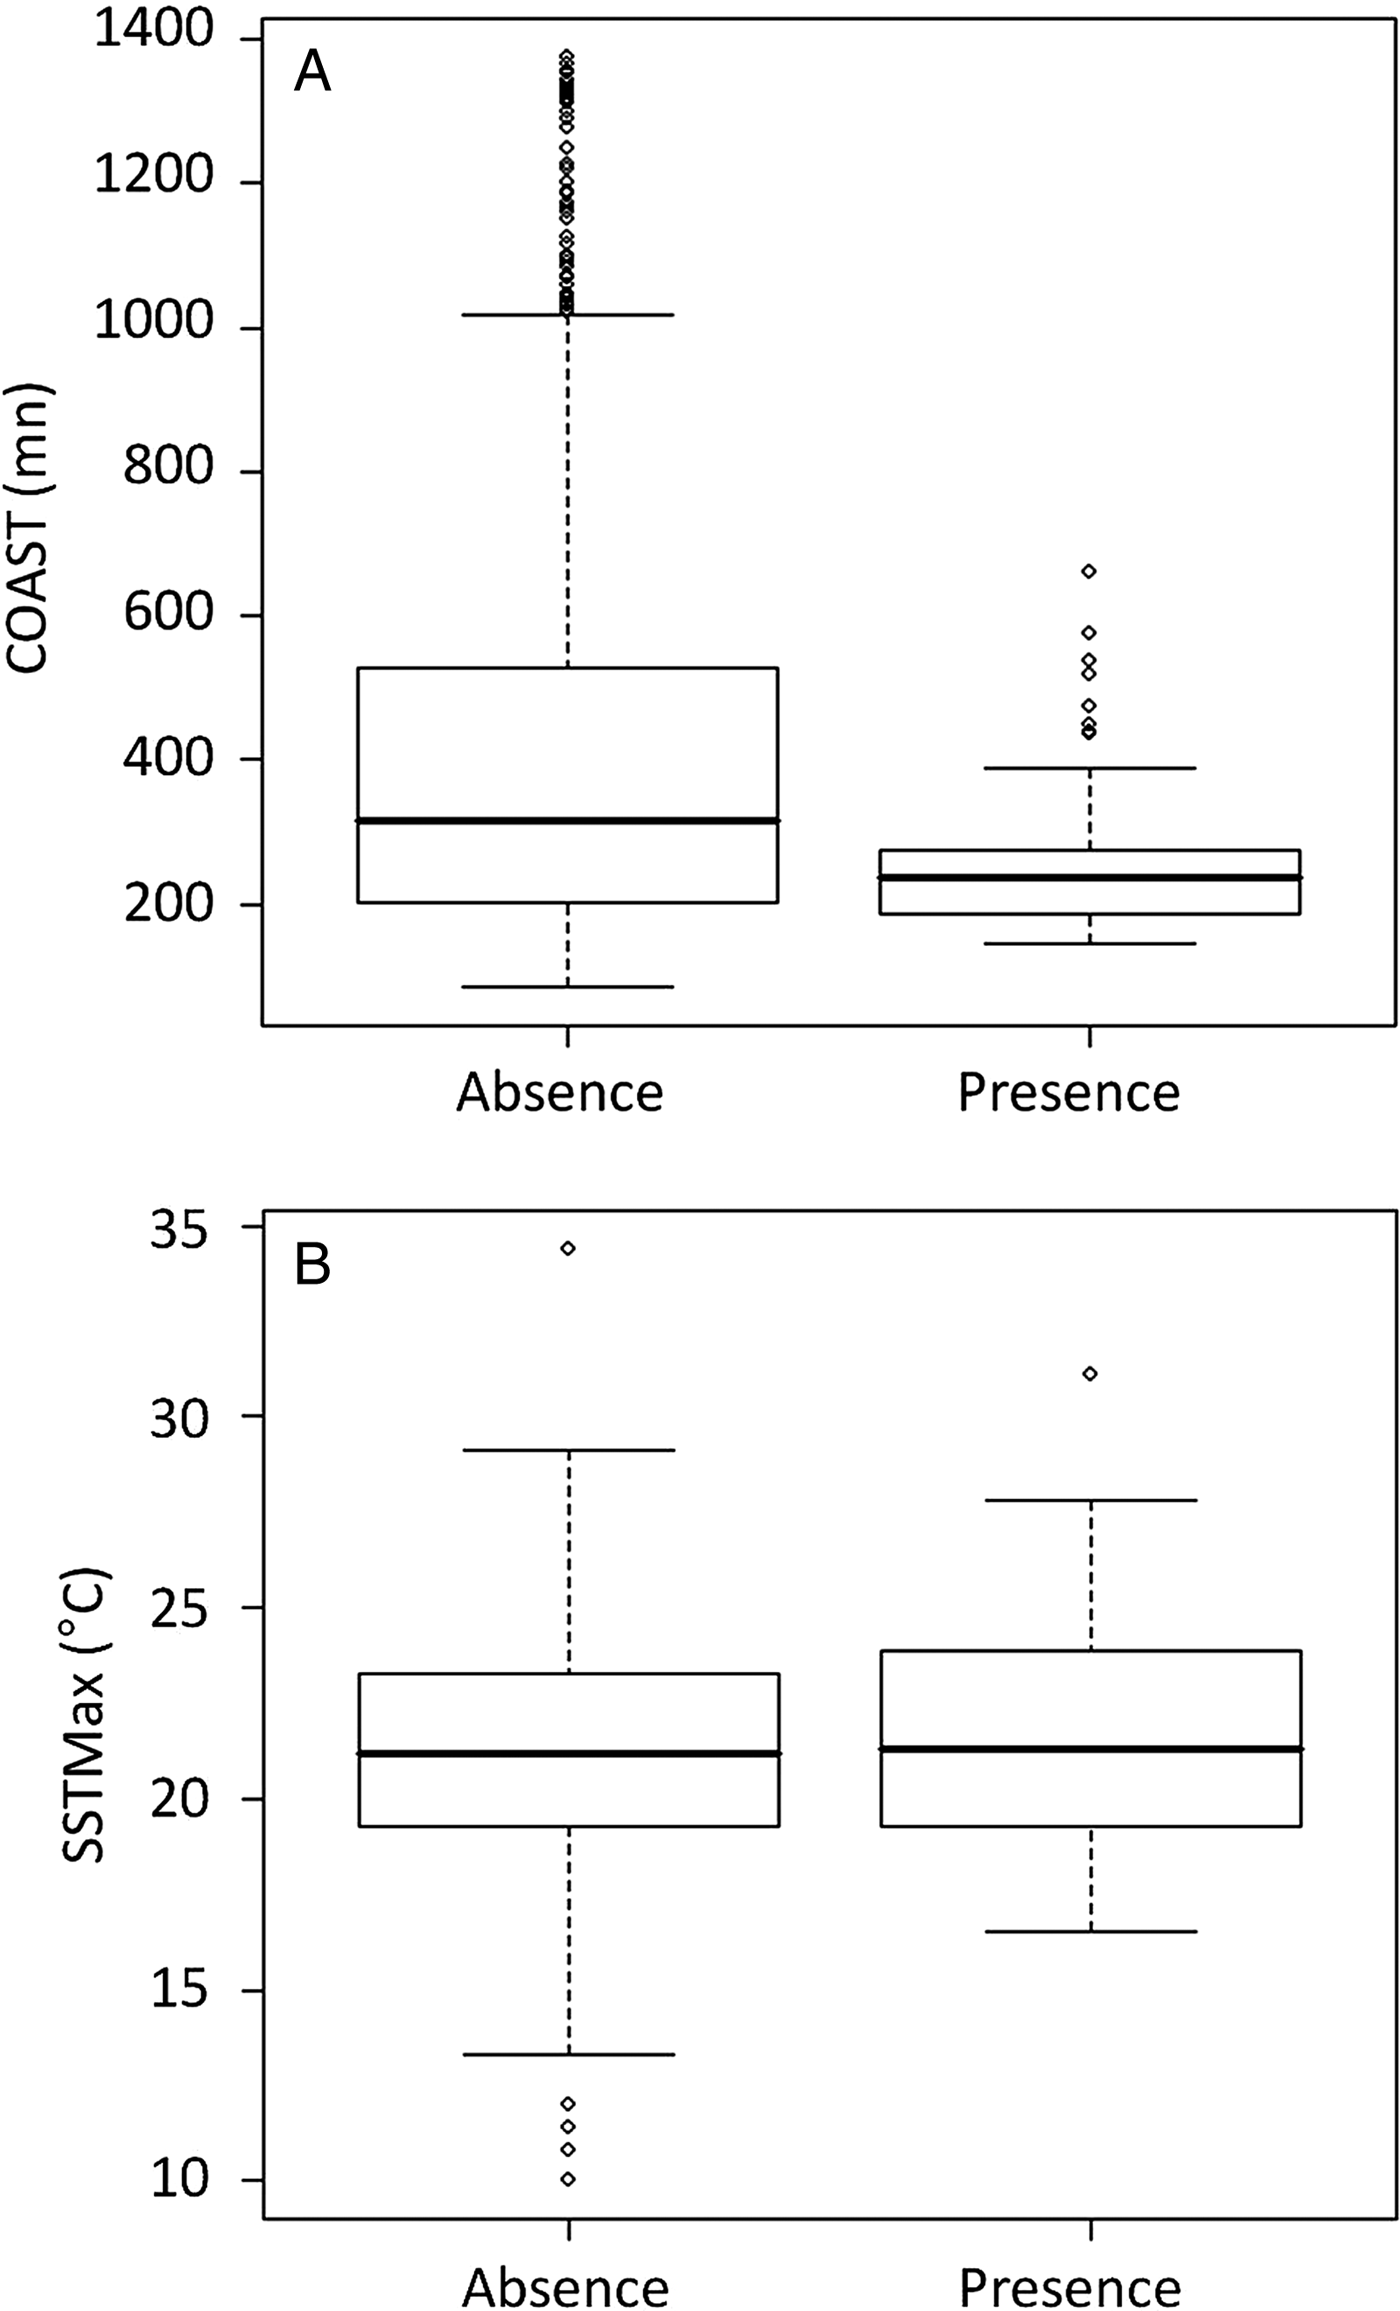
In the south-western Atlantic, the killer whales observed by skippers and observers of the longline fishing vessels are found mainly at distances from the coast varying between 150 and 400 nm (average = 250 nautical miles (nm)), in waters with temperatures ranging between 19 and 24°C (average = 22°C) (Table 5; Figure 5). According to the Akaike criterion, the GLMs indicate that the presence of killer whales is also influenced by the vessel and the month. However, these variables were not significant for the adjustment of the data (Table 5).
Killer whales presence/absence of the selected explanatory variables of the GLM: (A) distance from the coast in nm (COAST); (B) maximum sea surface temperature in °C (SSTMax).
DISCUSSION
The non-systematic surveys with opportunistic records of cetaceans made by skippers and trained observers generate a large database with high spatial and temporal coverage (e.g. Hernandez-Milian et al., Reference Hernandez-Milian, Goetz, Varela-Dopico, Rodriguez-Gutierrez, Romon-Olea, Fuertes-Gamundi, Ulloa-Alonso, Tregenza, Smerdon, Otero, Tato, Wang, Santos, Lopez, Lago, Portela and Pierce2008). The present study provides the first comprehensive information on killer whale distribution and sighting frequency for the south-western Atlantic Ocean. Despite possible biases, considering data are fishing-dependent and that there is some evidence that killer whales can be attracted to fishing vessels to depredate the catch (e.g. Donoghue et al., Reference Donoghue, Reeves and Stone2002), we consider our results a good proxy of the actual pattern of killer whale occurrence in temperate waters beyond the continental slope. To minimize these possible biases, we considered the whole Uruguayan pelagic longline fishing area (19°–40°S; 21°–54°W), during an extended period (1996–2007) and standardized the sightings by observation effort (i.e. sighting rates). Although neither skippers nor observers displayed what would usually be considered an effort searching for whales, this approach using days of fishing effort as observation effort could be used to model marine mammal habitat when no other information is available or when it does not cover such extended periods or areas.
Spatial and temporal distribution of killer whales
Despite the large fishing area, most of the killer whale sightings between 1996 and 2007 occurred in a restricted area of the south-western Atlantic Ocean (34°–37°S; 48°–53°W). A similar pattern has been registered regarding the interaction between killer whales and bottom longline fishery where the interactions were also restricted to relatively small areas (Yates & Brickle, Reference Yates and Brickle2007).
The spatial components were important for explaining the occurrence of killer whales in this region, which was higher between 150 and 400 nm offshore, near the shelf break and the continental slope, and in higher latitudes of the study area, which is consistent with overall patterns of global distribution of this species (Heyning & Dahlheim, Reference Heyning and Dahlheim1988; Forney & Wade, Reference Forney, Wade, Estes, Brownell, DeMaster, Doak and Williams2007).
Although the sighting rate (SR) for the entire period was 4.57%, values were higher between 35°–36°S and 51°–53°W during all seasons, with particular areas presenting SR of up to 10%. This area is highly influenced by the Brazil–Malvinas Confluence, where two SST fronts can be distinguished, one corresponding to the southern tip of the Brazil Current and the other to the northernmost limit of the Falkland/Malvinas Current. The distance between these two thermal fronts varies from 50 to 100 km and within this zone a maximum in concentration of chlorophyll-a occurs (Barré et al., Reference Barré, Provost and Saraceno2006). The flows of both currents away from the coast form a series of large-scale meanders around 38°S, triggering very strong upwelling of deep waters and eddies (Brandini et al., Reference Brandini, Boltovskoy, Piola, Kocmur, Röttgers, Abreu and Mendes Lopes2000; Piola & Matano, Reference Piola, Matano, Steele, Thorpe and Turekian2001; Acha et al., Reference Acha, Mianzan, Guerrero, Favero and Bava2004). This is one of the most productive areas in the region (Bisbal, Reference Bisbal1995; Acha et al., Reference Acha, Mianzan, Guerrero, Favero and Bava2004) and is identified as a high abundance zone for sea birds, sea turtles and pelagic fish (Domingo et al., Reference Domingo, Mora, Pons, Miller and Pereyra2007, Reference Domingo, Rios and Pons2009; Jimenez et al., Reference Jimenez, Domingo and Brazeiro2008, Reference Jimenez, Abreu, Pons, Ortiz and Domingo2010; Pons et al., Reference Pons, Domingo, Sales, Niemeyer Fiedler, Miller, Giffoni and Ortiz2010). A study combining PNOFA sighting data for the period 2002–2006 and satellite images of sea SST showed that the presence of killer whales closely matches surface temperature fronts found in the Confluence area (Passadore et al., Reference Passadore, Szephegyi, Domingo and Mora2007). This supports the global distribution pattern proposed by Forney & Wade (Reference Forney, Wade, Estes, Brownell, DeMaster, Doak and Williams2007), using remote data on chlorophyll-a concentration as a proxy for productivity, where densities of killer whales are higher in more productive areas.
Although killer whales occurred year round in the south-western Atlantic, the sighting rate was higher in autumn and winter. Whether the sighted individuals correspond to year round residents or the area is seasonally occupied by different groups widely distributed in the south-western Atlantic (e.g. coastal: Iriarte, Reference Iriarte2006; oceanic: Secchi & Vaske Jr, Reference Secchi and Vaske1998; Dalla Rosa et al., Reference Dalla Rosa, Secchi, Lailson-Brito and Azevedo2007; Passadore et al., Reference Passadore, Szephegyi, Domingo and Mora2007; from tropical regions: Lodi & Hetzel, Reference Lodi and Hetzel1998; Siciliano et al., Reference Siciliano, Lailson Brito and Azevedo1999; or from cold temperate regions: Iñiguez et al., 1994) has yet to be determined either by photo-identification or satellite tracking. A recent study on killer whales tagged in the Antarctic Peninsula showed that they travelled south-western Atlantic waters (30°–37°S) as far as Uruguay and Brazil, one of them performing nonstop round trips in 42 days (Durban & Pitman, Reference Durban and Pitman2012). Therefore, combining satellite telemetry studies with remote sensing data of the ocean and fishery information would be especially useful to determine movement patterns, to identify pelagic habitats preferred by killer whales and their potential overlap with the distribution of fisheries.
Effect of environmental and operational variables on the occurrence of killer whales
Some studies suggest that the killer whales would be attracted to the fishing boats when hauling systems are active (Yano & Dahlheim, Reference Yano and Dahlheim1995; Donoghue et al., Reference Donoghue, Reeves and Stone2002). Particularly in the south-western Atlantic, previous researches mention that killer whales might have the ability to recognize and follow the fishing boats (Secchi & Vaske Jr, Reference Secchi and Vaske1998; Dalla Rosa & Secchi, Reference Dalla Rosa and Secchi2007). However, the ability of the species to recognize fishing boats had not been previously assessed for this region. Our GLMs suggest that killer whale presence may be influenced by the boat, but which characteristics turn some vessels into killer whale attractors have to be investigated, so that structural changes can be designed to minimize depredation upon the catch (see Donoghue et al., Reference Donoghue, Reeves and Stone2002).
The maximum SST also had a positive effect on the presence of killer whales in the south-western Atlantic. According to the SST values (range = 19–24°C; average = 22°C) the species occurred mainly in waters affected by Brazilian Current (Brandini et al., 2000). The reason for this variable being selected as relevant to explain killer whale presence is unclear, but might be due to interactive effects with other variables not considered in this study such as presence of preys that could be associated with SST. For example, fishermen seek waters of 18° to 20°C in order to catch swordfish (Mora, Reference Mora1988), the species mostly depredated by killer whales in longline fisheries (Secchi & Vaske Jr, 1998; Dalla Rosa & Secchi, 2007).
Killer whale groups and implications for conservation
Killer whales occurred as solitary animals or in small groups, mostly composed of 2 or 3 individuals, and occasionally up to 15. The groups interacting with longline fisheries in other areas of the South Atlantic are of similar sizes to the ones here reported (e.g. tropical waters of the Atlantic Ocean: Dantas, Reference Dantas2007; South Georgia: Purves et al., Reference Purves, Agnew, Bulguerias, Moreno and Watkins2002; Malvinas/Falkland Islands: Yates & Brickle, Reference Yates and Brickle2007; and south-eastern Africa: Williams et al., Reference Williams, Petersen, Goren and Watkins2009).
It is worth noting that the size of the population that interacts with the pelagic longline fishery in the Brazil–Malvinas Confluence remains unknown. In general, killer whales form small populations (e.g. Matkin & Sautilis, Reference Matkin, Sautilis, Barrett-Lennard, Ford, Guinet, Similä and Ugarte1994; Baird, Reference Baird, Mann, Connor, Tyack and Whitehead2000) and this, coupled with the low reproductive rate and longevity of the species, make them highly vulnerable to anthropogenic threats (Heyning & Dahlheim, Reference Heyning and Dahlheim1988).
It is suspected that interactions with fishing vessels are the most obvious conservation problem for killer whales, not only in Brazilian waters (Dalla Rosa et al., Reference Dalla Rosa, Secchi, Lailson-Brito and Azevedo2007) but also in Uruguayan and adjacent international waters, where sometimes they are incidentally hooked or retaliated against by fishermen with harpoons and guns (Secchi & Vaske Jr, Reference Secchi and Vaske1998; Brum & Marín, Reference Brum, Marín, Arena and Rey2000; Dalla Rosa & Secchi, Reference Dalla Rosa and Secchi2007; Passadore, Reference Passadore2010).
It is important to mention that in the present study 58% of fishing events with killer whale sightings also experienced interaction (i.e. the species preyed upon the fish captured in the longline). In 32% of the events with sightings, no fish were damaged by killer whales; and in the remaining 10% of the events information on depredation was not available (Passadore, this study). Therefore, other patterns besides fishery distribution would be affecting the occurrence of killer whales. Our data suggest that the Brazil–Malvinas Confluence is an area of high occurrence of killer whales. Nevertheless, dedicated cetacean surveys should be performed in the south-western Atlantic to investigate abundance and to determine detailed distribution patterns in order to improve our understanding on the species ecology and, eventually, to manage fishing activities.
Besides the interaction with killer whales, the longline fishery in the south-western Atlantic interacts with a group of threatened species such as sea birds (Jimenez et al., 2008, 2010) and sea turtles (Domingo et al., 2007, 2009). Therefore, all the interactions should be assessed and the environmental and fishing characteristics should be identified and monitored. The understanding of species distribution and of the interactions between the fishery and non-target species would guide resource managers to mitigate possible adverse interactions under a multi-species approach.
ACKNOWLEDGEMENTS
Thanks to all PNOFA observers who collected the data used and Gabriel Tomas for providing his fishing logbooks; the fishing companies, skippers and crews of the fishing vessels of the longline Uruguayan fleet that participated in the PNOFA; our colleagues from Recursos Pelágicos (DINARA), for sharing their knowledge and experience; and A. Segura for helping in obtaining depth data and to D. Monteiro who collaborated with literature and scripts elaboration. The Whale and Dolphin Conservation Society provided funds for equipment in 2006. C. Passadore had a scholarship from the Development Programme of Basic Sciences (PEDECIBA) and the National Agency for Research and Innovation (ANII) to develop her master's thesis on which this paper is based. E.R. Secchi received a scholarship from CNPq (PQ 307843/2011–4). This is a contribution of the Research Groups ‘Cetáceos Uruguay' and ‘Ecologia e Conservação da Megafauna Marinha-EcoMega/CNPq'.