
I. INTRODUCTION
The market for thin film photovoltaics (PV) has been expanding over the past decade due to the technological advances in developing low-cost and high-efficiency chalcogenide-based devices with CdTe and Cu(In,Ga)Se2 absorbers. However, the total power generation capacity per year for these chalcogenide-based technologies is projected to saturate at about 100 GWp. Reference Candelise, Winskel and Gross1,Reference Mitzi, Gunawan, Todorov and Barkhouse2 This is mainly due to the limited accessible reserves of In and Te in the earth's crust, as well as the toxicity of Cd. Reference Liu, Feng, Cui, Liu, Hao, Conibeer, Mitzi and Green3 Alternatively, In and Ga in the CIGSe films can be replaced with more earth-abundant, non-toxic elements such as Zn and Sn forming Cu2ZnSn(S,Se)4 (CZTSSe) which has kesterite crystal structure. The current record conversion efficiency of polycrystalline thin film CZTSSe solar cell is 12.6%; 2.4% short of the efficiency threshold needed to make this material competitive with the commercial thin film technologies. Reference Mitzi, Gunawan, Todorov and Barkhouse2,Reference Wang, Winkler, Gunawan, Gokmen, Todorov, Zhu and Mitzi4 This deficit in performance has been mostly ascribed to the limited open-circuit voltage (V oc) due in large to the extent of carrier recombination at the defects sites within the bulk of the absorbers or at the interfaces that exist in the PV devices. Reference Chagarov, Sardashti, Kummel, Lee, Haight and Gershon5–Reference Scragg, Dale, Colombara and Peter8
One of the critical interfaces in polycrystalline thin films is the one between adjacent grains, called grain boundaries. If not properly passivated, grain boundaries can introduce a large density of carrier recombination sites within the absorber region where the electron–hole pairs are generated. Local surface electronic measurements of high-efficiency CIGSe thin films have shown modest levels of downward band bending (100–300 mV) at the grain boundaries. Reference Jiang, Contreras, Repins, Moutinho, Yan, Romero, Mansfield, Noufi and Al-Jassim9,Reference Jiang, Repins, Mansfield, Contreras, Moutinho, Ramanathan, Noufi and Al-Jassim10 This downward band bending (equivalent to smaller work function of the grain boundaries) has been attributed to a variety of factors including Cu depletion Reference Sardashti, Haight, Anderson, Contreras, Fruhberger and Kummel11 and Na or O accumulation Reference Abou-Ras, Schmidt, Caballero, Unold, Schock, Koch, Schaffer, Schaffer, Choi and Cojocaru-Miredin12 at the grain boundaries. In the case of CZTSSe thin films, both upward and downward band bending were observed at the grain boundaries depending on the growth method. Reference Erkan, Chawla, Repins and Scarpulla13–Reference Xin, Vorpahl, Collord, Braly, Uhl, Krueger, Ginger and Hillhouse15 Similar to CIGSe, atomic scale substitutions with alkali metals (such as Na and Li) or O in the crystal structure adjacent to the grain boundaries have been identified as the major grain boundary passivation mechanisms. Reference Gershon, Shin, Bojarczuk, Hopstaken, Mitzi and Guha16,Reference Kim, Choi, Choi, Gershon, Lee, Wang, Shin and Chung17
In the champion CZTSSe solar cells with 12.6% energy conversion efficiency, a critical processing step is the air anneal where the samples are heated up to 300–400 °C in ambient air for several minutes. Kelvin probe force microscopy (KPFM) measurements on air-annealed CZTSSe films showed upward band bending of 70–100 mV at the grain boundaries correlated with the presence of 100–200 nm thick SnO x layer within the grain boundary grooves. Reference Sardashti, Haight, Gokmen, Wang, Chang, Mitzi and Kummel18 This SnO x layer is believed to grow during the air anneal process where oxygen is provided from the ambient to oxidize the excess Sn at the grain boundaries. In addition to the grain boundaries, air anneal has been found to assist formation of a Cu-poor top surface that is critical in realizing optimal top junctions between CdS buffers and CZTSSe grains. Reference Haight, Shao, Wang and Mitzi19 Cd from CdS chemical bath deposition can replace Cu within tens of nanometers away from the junction, resulting in a sub-junction doping and improvement of the CdS/absorber junction quality. Reference Hiepko, Bastek, Schlesiger, Schmitz, Wuerz and Stolwijk20,Reference Nakada and Kunioka21 However, very limited work has been performed to compare the oxide composition on the top surfaces of the grains with grain boundaries formed during the air anneal process.
In the present study, nanoscale elemental analysis of CZTSSe grain surfaces and grain boundaries is carried out with Auger nanoprobe microscopy (NanoAuger). To compare the composition of the oxide formed during the air anneal, NanoAuger spectroscopy and elemental mapping were performed before and after oxide removal using in situ Ar+ sputtering. Elemental maps of the air-annealed surfaces showed formation of Zn-rich (Sn,Zn)O x on grain surfaces and SnO x at the grain boundaries. Using nanoscale secondary ion spectrometry (NanoSIMS) elemental mapping on air-annealed CZTSSe films, it was confirmed that excess oxygen exists deep within grain boundaries, consistent with the SnO x layer covering a large fraction of the grain walls through the films. Comparison of NanoSIMS elemental maps before and after air anneal led to the conclusion that the O accumulation is a result of air annealing process.
II. MATERIALS AND METHODS
CZTSSe films were grown by spin coating of a hydrazine-based precursor slurry onto soda lime glass substrates coated with 100 nm thick Mo layers. Spin coating of slurry onto the substrates was performed in a nitrogen-filled glove box. After the thin film deposition, CZTSSe films underwent two steps of post deposition annealing: (i) hard bake (HB): annealing at 600 °C for 15 min in a nitrogen-filled glove box; (ii) air anneal (AA): annealing at 350 °C for 10 min in air with average relative humidity of 40–50%. Further details of the CZTSSe growth procedure have been published elsewhere. Reference Barkhouse, Gunawan, Gokmen, Todorov and Mitzi22–Reference Todorov, Tang, Bag, Gunawan, Gokmen, Zhu and Mitzi24 The bulk [Cu]/[Zn] and [Se]/[S] + [Se] measured by x-ray fluorescence (XRF) were 1.8 and 0.7, respectively.
Auger nanoprobe measurements were performed using a PHI-710 Auger nanoprobe microscope (NanoAuger, Physical Electronics, Chanhassen, Minnesota). The NanoAuger tool provides 1% energy resolution for spectroscopy and 5 nm spatial resolution for elemental mapping. A 20 kV, 10 nA electron beam was used for both Auger spectroscopy and elemental mapping. Additionally, to remove the native oxide from the thin films' top surfaces, in situ Ar+ ion sputtering with 500 eV energy was applied. To minimize the sputtering rate dependence on the surface geometry, the sputter gun was perpendicular to the sample surface.
NanoSIMS elemental mapping was achieved by using a CAMECA NanoSIMS 50L tool (CAMECA, Gennevilliers Cedex, France) with Cs+ as the primary ion beam (2–8 pA) with a nominal spot size of 100–200 nm. The beam was rastered over areas as large as 5 × 5 µm on the sample surface. Negative secondary ions for the elements of interest were collected simultaneously on the NanoSIMS multi-collection system.
III. RESULTS AND DISCUSSION
A. Auger nanoprobe microscopy (NanoAuger)
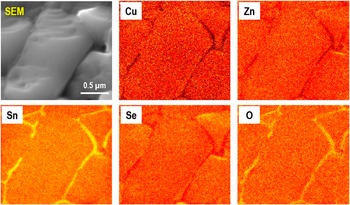
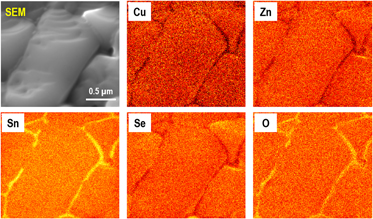
Figure 1 displays the NanoAuger elemental maps in planar mode for a CZTSSe surface after the air annealing at 350 °C. Since no chemical treatment was performed on the sample after air anneal, the top surface is expected to be covered by an oxide layer. Distributions of all five elements (Cu, Zn, Sn, Se and O) on the grains' surfaces were relatively uniform. In stark contrast, the grain boundaries appeared to have higher concentrations of Sn and O and smaller concentrations of Cu, Zn and Se relative to grains. This is in consistent with the previous report on the observation of a thin SnO x layer at the grain boundaries of air annealed CZTSSe thin films. Reference Sardashti, Haight, Gokmen, Wang, Chang, Mitzi and Kummel18
Secondary electron micrograph and NanoAuger elemental maps for Cu, Zn, Sn, Se, and O measured on as-inserted CZTSSe surface after 10 min air anneal at 350 °C. The scan size is 2 × 2 µm2. Grain boundaries have higher concentrations of Sn and O compared to the top surfaces of the grains. There is a void from which very small Auger signals were detected. Therefore, this void appeared as a dark region in all the five elemental maps.

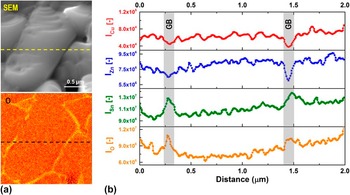
It should be noted that in the elemental maps, a uniform background subtraction is applied; smaller intensity in the elemental map does not necessarily correlate with the full depletion of the corresponding elements. To determine the extent of the compositional variation between the grains and grain boundaries, a line trace across the scan region is measured as shown in Fig. 2(a). Each elemental line trace in Fig. 2(b) consists of 128 data points with their intensity corresponding to the peak-to-peak intensity of the element's derivative Auger spectrum (dN/dE versus kinetic energy). For the grain boundary on the left, about 30% enhancement in Sn and 40% enhancement in O intensities were observed while only 20% drop in Zn and Cu intensities were estimated. This can be in part due to the larger escape depths of Zn and Cu Auger peaks which make them less surface sensitive. Reference Jablonski and Powell25,Reference Jablonski and Powell26 In addition, the signal enhancement at the grain boundaries seemed to be gradual (not very sharp), consistent with a beam size larger than the width of the grain boundary. Therefore, the rather small drop in the Zn and Cu signal could be a result of the large beam spot size (larger than grain boundary width) and the larger escape depth for the Auger peaks for Zn and Cu versus Sn and O.
(a) Secondary electron micrograph and O elemental map for air-annealed CZTSSe surface with the position of the horizontal line trace shown by the dotted lines. (b) Peak-to-peak intensities for Cu, Zn, Sn, and O, normalized to the relative sensitivity factors (RSFs), along the line traces shown in (a). The line traces show that the variations in peak-to-peak intensities between the grains and grain boundaries are only 20–40%. Therefore, darker or brighter regions in the elemental maps do not correspond to full depletion or accumulation of the elements.

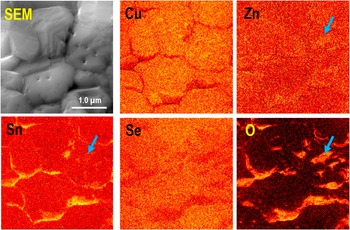
A mild Ar+ sputtering at 500 V ion energy (filament current = 600 nA) was applied in situ for 30 s to remove the oxide layer from the CZTSSe top surface. The sample stage was titled 30° to align the ion gun with the sample's surface normal. Secondary electron images and Auger elemental maps of the sample surface after 30 s of Ar+ sputtering are shown in Fig. 3. It should be noted that different scan locations were chosen for Figs. 1 and 2. After sputtering, the contrast in signal intensity between the grains and grain boundaries for Sn and O has increased relative to the as-inserted surface. Additionally, lower intensities for Cu, Zn, and Se were observed at the grain boundaries relative to the grains, although the contrast between the grains and grain boundaries seems to be smaller than the as-inserted surface. There were few zones on the grain surfaces with O, Zn, and Sn signal enhancement (blue arrows). These could be due to nonuniformities in the oxide thickness resulting in incomplete removal of the oxides during the short Ar+ sputtering step.
Secondary electron micrograph and NanoAuger elemental maps for Cu, Zn, Sn, Se, and O measured on air-annealed CZTSSe surface after 30 s of Ar+ sputtering with 0.5 kV ion beam energy and 600 nA filament current. The scan size for these measurements is 3 × 3 µm2. Similar to the as-inserted sample, grain boundaries appear to have larger concentrations of Sn and O.

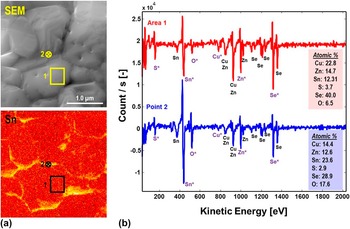
To quantify the chemical composition of the grain and grain boundaries after Ar sputtering, single point Auger spectroscopy was carried out on top surface of a grain (area 1) and a grain boundary adjacent to it (point 2), as shown in Fig. 4(a). The Auger survey spectra measured on area 1 and point 2 are shown in derivative format in Fig. 4(b). The elemental composition for each scan location was estimated using the elemental peaks marked with * sign (example: Cu*, Zn*, etc.). In comparison with the grain surface in area 1, the grain boundary at point 2 has about 2× larger concentration of Sn and O. In addition, the grain boundary oxide has [Sn]/[Zn] = 1.87. Considering the large beam spot size (larger than grain boundary width) and longer escape depth for Zn Auger peak, the majority of the Zn signal in the single point measurements could be detected from the CZTSSe grains adjacent to the grain boundary oxide. Therefore, it is expected that the grain boundary grooves near the top surface are terminated by an oxide with composition close to SnO x . This oxide has been found necessary for maintaining low grain boundary recombination rates and high V oc in CZTSSe solar cells. Reference Sardashti, Haight, Gokmen, Wang, Chang, Mitzi and Kummel18
(a) Secondary electron micrograph and Sn elemental map for air-annealed CZTSSe top surface after 30 s of Ar+ sputtering. (b) Auger survey spectra for area 1 (grain) and point 2 (grain boundary). Elemental compositions calculated from the Auger spectra are shown in the boxes on the bottom right of the spectra.

To determine the composition of the oxide formed on the grain surfaces, variations in the Auger spectra of top surfaces of grains were monitored before and after Ar+ sputtering [area 1 in Fig. 5(a)]. The elemental ratio for each element was calculated by normalizing its Auger peak-to-peak intensity (I
p–p) to its relative sensitivity factor (RSF) (I
n = I
p–p/RSF) and then dividing by the sum of the normalized intensities of CZTSSe constituents [i.e.,
 $\left[ {\rm{O}} \right] = {{{I^{\rm{n}}}_{\rm{O}}} \mathord{\left/ {\vphantom {{{I^{\rm{n}}}_{\rm{O}}} {\left( {{I^{\rm{n}}}_{{\rm{C}}{{\rm{u}}^{\rm{ + }}}}\,{I^{\rm{n}}}_{{\rm{Z}}{{\rm{n}}^{\rm{ + }}}}\,{I^{\rm{n}}}_{{\rm{S}}{{\rm{n}}^{\rm{ + }}}}\,{I^{\rm{n}}}_{{{\rm{S}}^{\rm{ + }}}}\,{I^{\rm{n}}}_{{\rm{S}}{{\rm{e}}^{\rm{ + }}}}} \right)}}} \right. \kern-\nulldelimiterspace} {\left( {{I^{\rm{n}}}_{{\rm{C}}{{\rm{u}}^{\rm{ + }}}}\,{I^{\rm{n}}}_{{\rm{Z}}{{\rm{n}}^{\rm{ + }}}}\,{I^{\rm{n}}}_{{\rm{S}}{{\rm{n}}^{\rm{ + }}}}\,{I^{\rm{n}}}_{{{\rm{S}}^{\rm{ + }}}}\,{I^{\rm{n}}}_{{\rm{S}}{{\rm{e}}^{\rm{ + }}}}} \right)}}$
]. Figure 5(b) displays the elemental ratios for Cu, Zn, Sn, S, Se, and O in area 1 before and after sputtering. As a result of sputtering, the [Zn] and [Sn] ratios were reduced by about 60% while [O] decreased by 12×, from 0.6 to 0.05. Concurrently, [Cu] and [Se] were increased by 60% and 76%, respectively. Therefore, it can be concluded that the thin overlayer present on the as-inserted CZTSSe surface contains large amounts of Sn, Zn, and O. Considering the short amount of time needed to remove the oxide from the grains' top surfaces via Ar+ sputtering (∼30 s), the overlayer thickness can be approximated to <1.5 nm. Due to their large inelastic mean free path (IMFP), large fractions of the Cu (IMFP ∼ 1.6 nm) and Se (IMFP ∼ 2.4 nm) Auger signals are expected to be received from the CZTSSe underneath the oxide on air-annealed surfaces.
(a) Secondary electron micrograph of air-annealed CZTSSe surface before Ar+ sputtering. The area chosen for spectroscopy is marked by the yellow box. (b) Elemental ratios calculated for Cu, Zn, Sn, S, Se, and O in area 1 before (red) and after (blue) Ar+ sputtering. (c) Sn MNN Auger peak before and after surface oxide removal by Ar+ sputtering. (d) Zn LMM Auger peak before and after surface oxide removal by Ar+ sputtering. For both (c) and (d) Auger peaks are in absolute mode and the peak intensities are normalized to the maximum intensities. It should be noted that the left shoulder for sputtered surface seems to be larger than the as-inserted surface. This background increase could be due to the overlap between Cu1 and Zn1 Auger peaks, particularly considering the increase in [Cu] after sputtering.

To confirm this, Zn and Sn Auger peaks in absolute mode before and after sputtering were compared, as shown in Figs. 5(c) and 5(d). After Ar+ sputtering, Sn and Zn peaks shifted to higher kinetic energies by 1 and 3.3 eV. These shifts to higher kinetic energies for Zn and Sn peaks after sputtering is consistent with these elements bonding to O before sputtering and bonding to S or Se after sputtering. It should be noted that this difference in the chemical shift is due to the three-electron nature of the Auger process resulting in variations in sensitivity of Auger peaks to the changes in the elements' chemical bonding state. The difference in chemical shifts observed here for Zn LMM and Sn MNN peaks are consistent with the previous reports on Auger spectroscopy of Zn and Sn surface oxides. Reference Lynn and Opila27,Reference Milosev, Mikic and Gaberscek28 Considering the quantitative analysis given above, grain surfaces in air annealed CZTSSe are hypothesized to be terminated by a thin layer of (Zn,Sn)O with Sn/Zn ≈ 1. This is consistent with previous large area Auger spectroscopy measurements where the native oxide is identified as a Cu-free overlayer with large Zn and Sn concentrations. Reference Bar, Schubert, Marsen, Krause, Pookpanratana, Unold, Weinhardt, Heske and Schock29
It should be noted that CZTSSe top surface oxide can be removed by NH4OH in the chemical bath solution used for CdS buffer deposition. Reference Sardashti, Haight, Gokmen, Wang, Chang, Mitzi and Kummel18,Reference Haight, Shao, Wang and Mitzi19 Therefore, thin surface oxides are expected to have no effect on the quality of the CdS/CZTSSe top junction in eventual photovoltaic devices.
B. Nanoscale secondary ion mass spectrometry (NanoSIMS)
While NanoAuger measurements determined that grain boundaries are terminated by SnO x , NanoAuger does not provide direct information of the depth of this passivation layer. To clarify the depth distribution of the SnO x passivation layer, elemental mapping using NanoSIMS was performed with the primary Cs+ was rastered over a 5 × 5 µm area over the surface of an air-annealed CZTSSe film. NanoSIMS allow simultaneous sputtering with elemental mapping with high chemical sensitivity and depth resolution, but with lower spatial resolution than cyclic sputtering and NanoAuger (best lateral resolution of ∼50–60 nm). For NanoSIMS, the amount of negatively charged secondary ions including O, S, and Se were measured simultaneously using three detectors in parallel. Maps for secondary electrons as well as O, S, and Se were recorded after 1 min long ion sputtering time intervals.
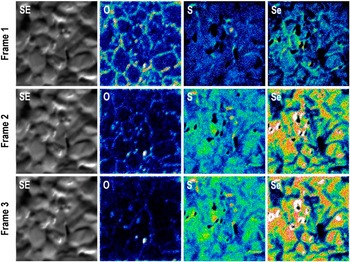
Secondary electron and elemental maps for O, S, and Se after 1 min (frame 1), 2 min (frame 2), and 3 min (frame 3) of Cs+ sputtering are shown in Fig. 6. Similar to the NanoAuger maps, grain boundaries on the starting surfaces were found to be O-rich and depleted from S and Se. As the films are eroded during the milling process, although the O intensity at the grain boundaries decreased, the grain boundaries still appeared to be O-rich. Even after 3 min of ion milling excess O at the grain boundaries can be observed [Note: The decrease in the intensity of O signal for longer sputtering times could be due to the smaller width of SnO x layer at the grain boundaries deeper within the CZTSSe films. As the width of the O-rich region shrinks below the NanoSIMS elemental mapping resolution (∼100–150 nm), the signal is averaged over grain boundaries and adjacent grains surfaces, resulting in smaller total O intensity.]. This is consistent with the (Zn,Sn)O grain boundary passivation layer extending deeper within the grain boundary grooves at least for the thickness equivalent of 3 min long Cs+ milling (70–100 nm). In addition, by moving from frame 1 to 3, the S and Se intensities increase on the grain surfaces consistent with the removal of the top surface (Zn,Sn)O x .
Planar secondary electrons and elemental maps for O, S, and Se for three different frames measured by NanoSIMS (Cs+ source) on air-annealed CZTSSe surfaces at 3 different times during the profiling. Frame 1, 2, and 3 are subsequently showing deeper layers on the sample surface. O is present at the GBs of the air-annealed sample after more than 3 min of depth profiling (equivalent to 70–100 nm of CZTSSe removal).

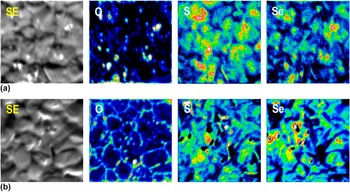
Figure 7 displays the NanoSIMS elemental maps for O, S, and Se elemental maps for hard baked [HB, Fig. 7(a)] and air-annealed [HB + AA, Fig. 7(b)] CZTSSe films. Maps were summed for 7 different imaging frames to enhance the overall signal intensity and contrast. In comparison with the hard-baked CZTSSe film [Fig. 7(a)] grain boundaries in the air-annealed film appeared to have larger O accumulation and smaller chalcogen (S,Se) depletion. This is consistent with the air anneal process assisting the grain boundary oxidation via oxidants in air or enhanced oxygen diffusion from the soda-lime glass substrate into CZTSSe back surface. Previous NanoAuger work demonstrated the presence of excess Sn at the grain boundaries even for films that underwent hard bake only. Reference Sardashti, Haight, Gokmen, Wang, Chang, Mitzi and Kummel18 Therefore, the air anneal process oxidizes the Sn-rich grain boundaries forming a charge passivating SnO x layer that induces up upward band bending in the regions adjacent to the grain boundaries. Reference Xin, Vorpahl, Collord, Braly, Uhl, Krueger, Ginger and Hillhouse15,Reference Sardashti, Haight, Gokmen, Wang, Chang, Mitzi and Kummel18
Planar secondary electrons and elemental maps for O, S, and Se measured by NanoSIMS (Cs+ source) on (a) hard-baked (HB) and (b) air-annealed (HB + AA) CZTSSe surfaces. Data has been integrated over 7 measurement frames. According to the O maps, air annealing the sample resulted in significantly higher O content at the GBs.

IV. CONCLUSIONS
Qualitative and quantitative elemental analysis by NanoAuger as well as qualitative elemental mapping as a function of depth by NanoSIMS were used to determine the chemical composition of the top surfaces of grains and grain boundaries in air-annealed CZTSSe thin-film absorbers. Grain boundaries appear to have larger concentrations of Sn and O even before any oxide removal. By performing Auger spectroscopy on individual grain surfaces, it was determined that the oxide formed on the grain surface during the air anneal process is composed of (Zn,Sn)O with Zn:Sn of about 1:1. Similar small area spectroscopy measurements revealed that grain boundary oxide composition is closer to pure SnO x . NanoSIMS elemental maps showed that O-rich grain boundaries extend deeper within the grain boundary grooves for up to 3 min of ion milling. This O-rich layer was determined to be a direct result of the air annealing treatment since much smaller O accumulation was observed at the grain boundaries of the CZTSSe films with hard bake only.
ACKNOWLEDGMENTS
The information, data, or work presented herein was funded in part by the U.S. Department of Energy, Energy Efficiency and Renewable Energy Program, under Award Number DE-EE0006334. The information, data, or work presented herein was funded in part by an agency of the United States Government. Neither the United States Government nor any agency thereof, nor any of their employees, makes any warranty, express or implied, or assumes any legal liability or responsibility for the accuracy, completeness, or usefulness of any information, apparatus, product, or process disclosed, or represents that its use would not infringe privately owned rights. Reference herein to any specific commercial product, process, or service by trade name, trademark, manufacturer, or otherwise does not necessarily constitute or imply its endorsement, recommendation, or favoring by the United States Government or any agency thereof. The views and opinions of authors expressed herein do not necessarily state or reflect those of the United States Government or any agency thereof; see the Supporting Information section of this article for more information. Part of this work was performed at the Stanford NanoShared Facility (SNSF). The CAMECA nanoSIMS 50L was supported by the National Science Foundation under award # 0922648. Special thanks to Liang-Yi Chang for supplying the CZTSSe films used in these investigations. Funding for the technique development was also provided by National Science Foundation Grant DMR 1207213.