Introduction
The Sanfratellano horse is a native Sicilian breed mainly reared in extensive system in the Natural Park of Nebrodi. Well adapted to harsh conditions, this meso-dolicomorph saddle-horse, characterized by a uniform blackish or bay coat, is mainly employed in light draft and equestrian tourism. In 1995, Sanfratellano was enrolled in the Italian Herd Book of local equine breeds, although genealogical records are available only since the second half of the 19th century. Nowadays, the breed, using an open-nucleus breeding scheme, includes about 1600 horses, with an enrolled selection nucleus of 1430 dams and 80 sires. However, only 14 stallions are employed in planned natural mating, which is the most frequent practice occurring mainly in three stud farms in the breeding area. The origin of Sanfratellano horse can be traced back to the Middle Ages (700–1200 A.D.), when native Sicilian horses were crossed with North African, Oriental and, later, Iberian populations (Fogliata, Reference Fogliata1910). Limited introgression of Thoroughbred and Oriental Stallions was practiced in 1925 to improve the morphological structure of Sanfratellano (Hendricks, Reference Hendricks1995). More recently, in 1934 and 1958, five Maremmano stallions were used in planned mating to improve withers height and size (Liotta and Chiofalo, 2004), but Maremmano sires were used until the end of the century (Chiofalo et al., Reference Chiofalo, Portolano, Liotta, Rundo Sotera and Finocchiaro2003). Nowadays Sanfratellano is included in the FAO endangered populations list (http://dad.fao.org) and incentives by EU are assigned to the breeders in order to preserve this genetic resource.
In Sicily, two other horse breeds are reared historically, both originating from local mares and sires crossed with horses of diverse origin (Chiari, Reference Chiari1901). The Sicilian Oriental Purebred, an endangered breed with less than 70 animals remaining (included in the FAO endangered populations list), is a genetic type of Arab–Oriental matrix. A Stud Book has existed since 1875 and proves the accurate selection practiced in Sicily on this breed starting from Arab and Oriental horses (Balbo, Reference Balbo1995). Sicilian Oriental Purebred is included in the Stud Book of Italian Saddle Horse. The other autochthonous horse is the Sicilian Indigenous, a very heterogeneous and largely unmanaged population. It is probably derived from a primitive strain of Sicilian horse and from the Borbon Real Casa di Ficuzza breed (related to the Napoletano, Persano and Arab breeds), and today it can be considered an Anglo-Oriental half-breed (Borgioli, Reference Borgioli1959).
Maremmano horse represents an important part of the equestrian tradition in Tuscany and is bred throughout Italy. According to one hypothesis, this breed originated in Tuscany from ancient local populations living along the Tyrrhenian coast during the Etruscan time and influenced by ages of crossing with other horse breeds (Gandini and Rognoni, Reference Gandini and Rognoni1996). A second hypothesis postulates that its early ancestors came from Numidia, in north Africa, because Maremmano shares many features with the present-day Barbary horse (Edwards, Reference Edwards1994). In the 19th century, four stallions, two of which were Thoroughbred, were chosen as founders of the current Maremmano breed.
Within the frame of breed conservation, genetic characterization is important with regard to breed integrity and is an essential prerequisite for handling genetic resources (Bjørnstad and Røed, Reference Bjørnstad and Røed2002). During the last decade, microsatellite markers proved to be a reliable and frequently used tool to quantify genetic variation within and among breeds and useful for the conservation management of animal populations (Cañón et al., Reference Cañón, Checa, Carleos, Vega-Pla, Vallejo and Dunner2000; Bruford et al., Reference Bruford, Bradley and Luikart2003). A preliminary characterization of Sanfratellano horse was achieved in the context of Western Mediterranean horse biodiversity (Marletta et al., Reference Marletta, Tupac-Yupanqui, Bordonaro, Garcia, Guastella, Criscione, Cañón and Dunner2006).
In this study, a set of microsatellites was used to assess the genetic diversity within and among three Sicilian autochthonous horses (Sanfratellano, Sicilian Oriental Purebred and Sicilian Indigenous) and one Italian breed (Maremmano).
The main goals were (i) to infer the impact of Maremmano breed in the current Sanfratellano horse, taking into account that Maremmano was used in recent crossing and (ii) to gather genetic information that might be useful to improve the selection strategies of the Sanfratellano horse.
Material and methods
Samples
Blood samples were collected from four Italian horse breeds: three reared almost exclusively in Sicily (Sanfratellano, Sicilian Oriental Purebred and Sicilian Indigenous) and one (Maremmano) originated in Tuscany (central Italy) and reared all over Italy. The whole sample included 384 horses (238 Sanfratellano, 50 Sicilian Oriental Purebred, 30 Sicilian Indigenous collected in Sicily, and 66 Maremmano horses collected in Tuscany). Sanfratellano, Maremmano and Indigenous horses were chosen from large geographical area, according to their pedigree information, when available, avoiding first- and second-order relatives. In the case of the Sicilian Oriental Purebred, the collected sample (n = 50) consisted of nearly the entire Stud Book-registered population (68 heads). DNA extraction from leucocytes was carried out by standard methods.
Microsatellite analysis
A set of 11 microsatellite markers (recommended by the International Society of Animal Genetics) was included in this study: HTG4, HTG7, HTG10, HMS2, HMS3, HMS6, HMS7, VHL20, ASB2, AHT4 and AHT5. Template DNA was amplified in a multiplex reaction according to standard protocols (Cañón et al., Reference Cañón, Checa, Carleos, Vega-Pla, Vallejo and Dunner2000) using a PE GeneAmp PCR 9600 or 9700 system thermocyclers (Applied Biosystems, Foster City, CA, USA). Fluorescent-labelled PCR products were diluted, mixed with an internal size standard (ROX 350, ABI PRISM®; Applied Biosystems) and analysed using an ABI PRISM® 377 genetic analyser equipped with GeneScan® and Genotyper® software (Applied Biosystems). DNA samples from ISAG comparison test were used as references to standardize allele sizes.
Statistical analysis
Unbiased estimates of gene diversity (expected or Hardy–Weinberg heterozygosity) (Nei, Reference Nei1987), observed heterozygosity (Hedrick, Reference Hedrick1983) and the number of alleles per breed were calculated using the Microsatellites Analyser (Dieringer and Schlötterer, Reference Dieringer and Schlötterer2003). Genotypic frequencies were tested for the Hardy–Weinberg equilibrium using the GENEPOP computer package (Raymond and Rousset, Reference Raymond and Rousset1995), which performs a probability test using a Markov chain (dememorization = 5000; batches = 100; and iterations per batch = 1000).
The FSTAT program (Goudet, 2001) was used to calculate the allelic richness (AR) standardized for variation in sample size using the rarefaction method (Hurlbert, Reference Hurlbert1971); the principle is to estimate the expected number of alleles in a sub-sample of 2n genes, where n is fixed as the smallest number of individuals typed for a locus in a sample. When calculated in this way, the number of alleles between populations with different sample sizes can be compared. FSTAT was also used to estimate Wright’s F statistics (F IT, F IS and F ST) (Weir and Cockerham, Reference Weir and Cockerham1984). Mean and standard error of F statistics were obtained for the entire sample by the jackknifing procedure over all loci.
Two classical measures of genetic distance were obtained by Population software (Langella, 2002): Nei’s standard distance (D S) (Nei, Reference Nei1987), which increases linearly in time, and the Reynolds’ (D R) distance (Reynolds et al., Reference Reynolds, Weir and Cockerham1983), which under a pure genetic drift model (excluding mutations and admixtures) also increases linearly in time. A bootstrap value of 1000 was adopted as a common criterion to estimate genetic distances. In addition, the proportion of shared alleles distance (Dps’) (Bowcock et al., Reference Bowcock, Ruiz-Linares, Tomfohrde, Minch, Kidd and Cavalli-Sforza1994), calculated by MICROSAT 1.5b (Minch et al., 1998), was chosen as the distance among individuals.
Phylogenetic trees were built from D R and Dps’ matrices applying the neighbour-joining method (Saitou and Nei, Reference Saitou and Nei1987), in order to show the relationships among breeds and individuals, respectively. D R was chosen to create the population phylogenetic tree, because this is the most appropriate measure for livestock population with short-term divergence (Reynolds et al., Reference Reynolds, Weir and Cockerham1983). Both trees were displayed by MEGA 4 (Tamura et al., Reference Tamura, Dudley, Nei and Kumar2007).
In order to estimate the individual admixture proportions and to simultaneously identify the ancestral K (unknown) clusters, STRUCTURE 2.2 program (Pritchard et al., Reference Pritchard, Stephens and Donnelly2000) was adopted. This program implements a clustering method for inferring population structure using multilocus genotype data; the criterion for inferring homogenous clusters was to minimize the Hardy–Weinberg and the gametic phase disequilibriums between loci within groups. The population structure was assessed first, using the whole sample set (n = 384), and then using the Sanfratellano breed only.
The admixture model using no prior information and the option of correlated allele frequencies between populations were used, as this configuration is considered best by Falush et al. (Reference Falush, Stephens and Pritchard2003) in case of subtle population structure. Posterior probabilities of K (ln Pr(X|K)) were estimated using 100 000 Markov chain Monte Carlo (MCMC) repetitions and the 100 000 burn-in period. The range of Ks we tested was from 1 to 11. The best number of clusters fitting our data was established by plotting the mean ln Pr(X|K) over multiple independent runs (10) for each K, as suggested by Pritchard et al. (Reference Pritchard, Stephens and Donnelly2000).
The 10 runs of each K were averaged using the cluster matching and permutation program (CLUMPP) program (Jakobsson and Rosenberg, Reference Jakobsson and Rosenberg2007). The output of cluster analysis was visualized by the DISTRUCT program (http://rosenberglab.bioinformatics.med.umich.edu/distruct.html).
Results
Genetic diversity within breeds
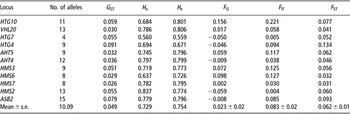
A total of 111 alleles were detected across the 11 analysed loci. Table 1 shows the number of alleles per marker, which ranged from 4 to 15 (average 10.09). The observed (H o) and expected heterozygosity (H e) for each marker are also given: the value of H o ranged between 0.56 (HTG7) and 0.837 (HMS2), while the H e value varied from 0.559 (HTG7) to 0.806 (VHL20). The average of Wright’s fixation indices and the unbiased coefficient of gene differentiation (G ST), due to breed differences, are also reported. Mean number of alleles (MNA) per locus, allelic richness (AR), calculated on the minimum sample size of individuals, and the heterozygosities per breed are reported in Table 2. MNA ranged between 6.7 ± 1.85 and 8.3 ± 2.97 in Sicilian Oriental Purebred and Sanfratellano, respectively. For all the other parameters, the Sicilian Indigenous showed the highest values, the Sicilian Oriental Purebred the lowest. A total of 24 breed-specific alleles (21.6% of the total alleles) were observed (nine in Sanfratellano, seven in Sicilian Oriental Purebred, five in Sicilian Indigenous and three in Maremmano), but none of them were with a frequency of over 0.055 (data not shown). F IS values calculated per breed are not far from zero, but for Indigenous (Table 2) in which a deficit of heterozygotes can be supposed.
Number of alleles, gene differentiation value (G ST), observed and expected Heterozygosity (H o, H e) and F statistics value (F IS, F IT, F ST) estimate by locus

Sample size, observed and expected Heterozygosity (H o, H e), mean number of alleles (MNA), allelic richness (AR) and F IS values in four Italian horse breeds

MNA = mean number of alleles; AR = allelic richness.
Two markers (HTG10 and HMS3) were not consistently in the Hardy–Weinberg equilibrium (P < 0.005) in Sanfratellano and Sicilian Indigenous, whereas it was only one (HMS6) in Sicilian Oriental Purebred. All the markers showing genetic disequilibrium were excluded from the clustering analysis.
Genetic distances and clustering
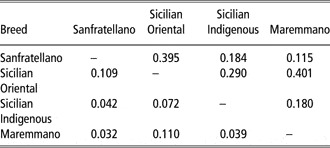
D S and D R distances reproduced the same ranking, from a minimum value between Sanfratellano and Maremmano to a maximum between Maremmano and Sicilian Oriental Purebred (Table 3).
Nei’s standard D S (above the diagonal) and Reynolds’ D R (below the diagonal) genetic distances among four Italian horse breeds

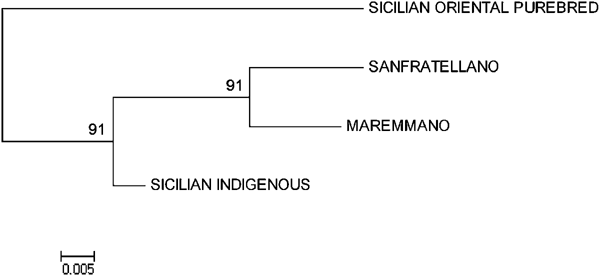
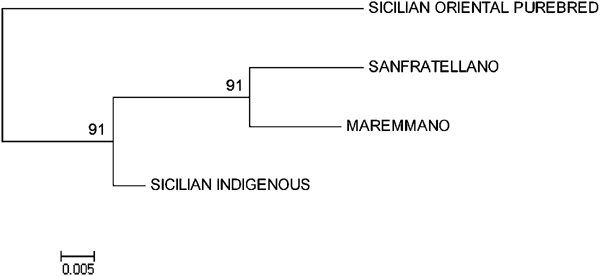
A neighbour-joining dendrogram was built starting from Reynolds’ (D R) genetic distance matrix (Figure 1); the number at the node indicates the percentage of a group’s occurrence out of 1000 bootstraps. The phylogenetic tree formed clearly defined clusters, displaying the short distance between Sanfratellano and Maremmano.
Neighbour-joining tree constructed from Reynolds’ (D R) distance among four Italian horse breeds.
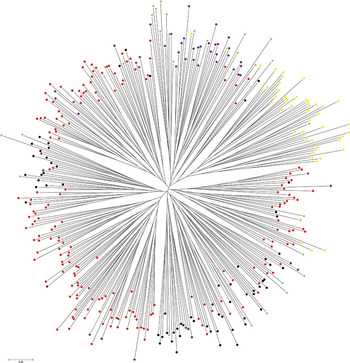
A second neighbour-joining tree, based on the Dps among individuals, was drawn (Figure 2). In this case, the Sicilian Oriental Purebred clustered well except for some individuals. Sanfratellano and Maremmano horses did not form well-defined groups, while a remarkable number of Indigenous animals grouped clearly. The Sanfratellano is further subdivided into a group of individuals (SanfA) representative of the common population (in red), and a group of individuals (SanfO) representative of the old population (in violet).
Neighbour-joining tree based on allele-sharing distances among 384 individuals of four Italian horse breeds: Sicilian Oriental Purebred (yellow), Sicilian Indigenous (green), Maremmano (black). The Sanfratellano population consists of two groups: SanfA (red) and SanfO (violet).

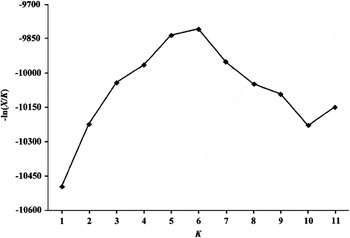
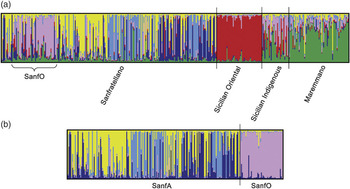
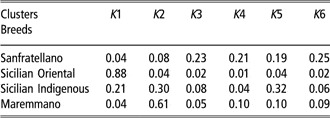
Clustering analysis using a Bayesian approach was performed on the entire set with increasing numbers of inferred clusters (from K = 1 to K = 11). The analysis was based on the assignment of an individual’s genomes to clusters using no prior information. The most likely number of subdivisions within our population is six. As shown in Figure 3, the likelihood of the observed data increases steadily when the number of clusters increases, reaches a peak in correspondence of cluster 6 and then declines progressively. At K = 6, the Sicilian Oriental Purebred and Maremmano animals form their own clusters, with the remaining breeds distributed among the remaining four clusters. Sicilian Indigenous grouped mainly into three (1, 2, 3) whereas Sanfratellano split into four clusters (3, 4, 5, 6) (Figure 4a). Sicilian Indigenous and Sanfratellano shared cluster 5 with an estimated membership of 32% and 19%, respectively (Table 4).
Plot of data likelihoods of 10 independent runs for 11 Ks: ln Pr(X|K) v. K.

(a) Clustering assignment of 384 horses belonging to four Italian breeds. Each individual is represented on the graph by a vertical line divided into coloured segments corresponding to six genetic clusters. The length of each coloured segment is proportional to the individual membership in the cluster of corresponding colour. (b) Clustering assignment of 238 Sanfratellano horses grouped in two subgroups: SanfO and SanfA.

Average membership coefficient for each given breed for K = 6 clustering result in Figure 4a

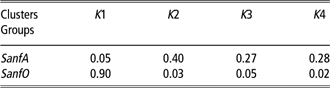
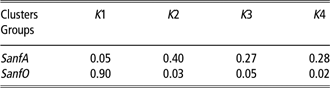
In order to confirm this result, an additional clustering analysis was performed on the Sanfratellano sample only. The genetic structure of the 238 Sanfratellano horses is shown in Figure 4b; in this case, we considered the total population split in two, namely SanfO and SanfA. The genetic equilibrium was calculated again and no more disequilibrium was found at HTG10 and HMS3, but for HMS6 that remained out of the analysis. Cluster 1 mainly represents the SanfO group, with an estimated membership of 90% (Table 5).
Average membership coefficient for the two Sanfratellano subgroups for K = 4
Discussion
These four Italian horse breeds showed a good level of genetic diversity, in terms of MNA (average 7.5) being almost the same as that observed among 10 Western Mediterranean horse breeds including some breeds analysed here (Marletta et al., Reference Marletta, Tupac-Yupanqui, Bordonaro, Garcia, Guastella, Criscione, Cañón and Dunner2006). MNA was greater than that observed in Lipizzan horse from seven national studs (Achmann et al., Reference Achmann, Curik, Dovc, Kavar, Bodo, Habe, Marti, Solkner and Brem2004), in 11 Asian and two European populations (Tozaki et al., Reference Tozaki, Takezaky, Hasegawa, Ishida, Kurosawa, Tomita, Saitou and Mukoyama2003) and in Thoroughbred from four national studs but one (Cunningham et al., Reference Cunningham, Doley, Splan and Bredley2001). Other European breeds showed the same trend (Aberle et al., Reference Aberle, Hamann, Drögemüller and Distl2004; Glowatzki-Mullis et al., Reference Glowatzki-Mullis, Muntwyler, Pfister, Marti, Rieder, Poncet and Gaillard2006; Azor et al., Reference Azor, Valera, Gòmez, Goyache and Molina2007). Allelic richness was high, particularly in Sicilian Indigenous.
Between breeds, genetic diversity (H e) was never below 0.70 and was consistent with the values reported for other horse breeds (Cunningham et al., Reference Cunningham, Doley, Splan and Bredley2001; Achmann et al., Reference Achmann, Curik, Dovc, Kavar, Bodo, Habe, Marti, Solkner and Brem2004; Solis et al., Reference Solis, Jugo, Mériaux, Iriondo, Mazòn, Aguirre, Vicario and Estomba2005; Azor et al., Reference Azor, Valera, Gòmez, Goyache and Molina2007). The more intensive and effective the selection, the less the genetic variability. As expected, Sicilian Oriental Purebred showed the lowest gene diversity value (H e = 0.712 ± 0.04) probably because of the very small population size. The recorded pedigrees of Sicilian Oriental Purebred reveal a strong inbreeding and founder effect; however, in this threatened breed, heterozygosity values were higher than those of other European and Asiatic endangered populations, encouraging its preservation (Tozaki et al., Reference Tozaki, Takezaky, Hasegawa, Ishida, Kurosawa, Tomita, Saitou and Mukoyama2003; Morais et al., Reference Morais, Oom, Malta-Vacas and Luis2005; Luis et al., Reference Luis, Cothran and Oom2007). Sicilian Indigenous, in spite of the small sample (n = 30), showed the highest genetic variability (H e = 0.810 ± 0.02); these results probably reflect its wide genetic base and heterogeneity, even apparent in morphology.
For all the breeds, genetic diversity is in agreement with the allelic richness rank, a parameter that does not account for sample size.
The F statistics allow to study the genetic differentiation and analyse the deficit or excess of heterozygotes, per locus and breed, among animal breeds. The F IS coefficient, which indicates the degree of departure from random mating, resulted close to zero for each breed, indicating low inbreeding levels (Table 2).
The average F ST value for each locus and across the different loci (Table 1) revealed a relatively low gene flow within breeds: only 6.2% of the total genetic variation is explained by population differences, the remaining 93.8% corresponds to differences among individuals. The genetic differentiation value (F ST) was higher than that observed in four Basque-Navarrese semi-feral breeds (Solis et al., Reference Solis, Jugo, Mériaux, Iriondo, Mazòn, Aguirre, Vicario and Estomba2005) and lower than those obtained in European (Zabek et al., Reference Zabek, Nogaj, Radko, Nagaj and Slota2005; Azor et al., Reference Azor, Valera, Gòmez, Goyache and Molina2007) and South American breeds (Lippi and Mortari, Reference Lippi and Mortari2003). On average, a deficit of heterozygotes of 2.3% (F IS) exists for each analysed breed; this deficit was 8.3% in the whole sample (F IT) (Table 1).
The tree based on Dps distance shows the relationship among individuals: the Sicilian Oriental Purebred is the group that clusters best (44/50). This result is not surprising if we consider that the whole breed counts less than 70 animals.
On the contrary, there was no definite differentiation for the other breeds. Within the Sanfratellano sample, it is possible to distinguish two groups: SanfA and SanfO. The largest consists of 191/238 heads (SanfA) and represents the most common Sanfratellano gene pool; the remaining 47/238 heads (SanfO) correspond to the old Sanfratellano breed according to their genealogical data. More than 60% of these animals (30 on 47 individuals) are well grouped, as displayed in the tree; furthermore, within the same cluster, a large number of Indigenous and only few individuals of the other breeds are present. The mixed clustering among 30 SanfO and 15 Indigenous could be due to their common origin; in fact these autochthonous breeds could represent, within a wide historical context, the old Sicilian horse gene pool.
The Bayesian approach has been proved to be a powerful method in studying population structure by the identification of genetic K clusters, also allowing a probabilistic estimation of the clusters’ membership (Q).
Six inferred clusters fit our data best. Only Sicilian Oriental Purebred and Maremmano horse genomes are assigned to their own cluster, with an estimated membership of 88% and 61%, respectively; the membership value for the other two breeds is less than 35%. The Sicilian Indigenous seems to be very heterogeneous and spreads its gene pool over three groups. It shares part of the multilocus genotype with Maremmano (Q = 0.30) and with Sicilian Oriental Purebred (Q = 0.21). The presence of a remarkable percentage of Sicilian Indigenous horses clustering into the Maremmano group (cluster 2) can be explained by the assessed presence of Thoroughbred genetics into both populations (Balbo, Reference Balbo1995; Hendricks, Reference Hendricks1995). Also, the Sicilian Oriental Purebred shares its multilocus genotype with the Sicilian Indigenous (Q = 0.20); in this case, the relationship is due to a strong presence of Oriental blood introduced into Sicily during the Arab domination.
The Sanfratellano breed appears to be the most heterogeneous and its genetic information spreads over four clusters: one of them (cluster 5) is in common with the Sicilian Indigenous, the others (cluster 3, 4 and 6) seem to equally represent the breed. Admixture between Sicilian Indigenous and Sanfratellano (Q = 0.19) occurs mainly in the SanfO group; this fact suggests a gene flow from Sicilian Indigenous to the native Sanfratellano horse and confirms the common origin of these two Sicilian horses, even strengthened by historical data. The other three clusters, within Sanfratellano, might be due to an unbalanced employment of a restricted number of stallions during mating, probably belonging to an old-type Maremmano horse. In fact, the role of the current Maremmano breed into the Sanfratellano population is different: the estimated membership of Sanfratellano to cluster 2 is 8%. A feeble connection between Sanfratellano and Maremmano may only be observed in clusters 4 and 6, notwithstanding the fact that Maremmano sires were used many times during the last century. Clustering analysis was also performed on the Sanfratellano sample only, highlighting the same result (Figure 4b): the SanfO group clusters clearly with an estimated membership of 90% to its own cluster.
In conclusion, all the Sicilian horse breeds showed high genetic variability, even if not so remarkable in Sicilian Oriental Purebred. The information given by clustering analysis allowed us to understand more about the genetic structure of the Sanfratellano and the other Sicilian breeds. In particular, Sanfratellano appears well distinct from the two other autochthonous breeds, not significantly influenced by the crossing with Maremmano, which occurred during the last century, but is still rather genetically heterogeneous.
The results reported here could be useful for selection strategies as well as for conservation purpose of Sanfratellano. The identification of two sub-populations (SanfO and SanfA) may suggest to the breeders the appropriate management of mating. Stallions belonging to the SanfO group are the reference sires for those breeders interested in recovering the most original nucleus of Sanfratellano, well adapted to equestrian tourism. On the other hand, stallions of the SanfA group, which represent the current Sanfratellano lineage, will be the reference for addressing this breed to equestrian competitions.
In both cases, Sanfratellano horse should be maintained and preserved in that mountainous part in the north-east of Sicily, Natural Park of Nebrodi, in which it plays an important economic and social role.
Acknowledgements
Financial support was provided by ‘Convenzione con Istituto Sperimentale Zootecncico per la Sicilia del. CdA del ISZS no. 31/05’.