Traditional studies of representation claim that citizens influence the positions taken by their politicians. This research is based on the assumption that politicians’ fear of losing the next election generates an incentive to meet their constituents’ demands. This claim is also in accordance with the Downsian model of party competition: parties and candidates who maximize the chance of winning a seat shift their policy positions closer to those of the median constituent. Numerous studies have empirically evaluated the correspondence between citizens and elected officials by comparing the preferences of constituents and representatives, the preferences of party supporters and party representatives, or the preferences of constituents and the ideological nature of public policies.Footnote 1
Yet others have argued the reverse: that politicians actively seek to alter their constituents’ attitudes.Footnote 2 Politicians do not only seek re-election; they also want to enact their desired policies.Footnote 3 Jacobs and Shapiro argue that politicians choose to shift constituents’ preferences closer to their own favoured positions because this strategy allows them to pursue their own policy goals without paying any electoral costs.Footnote 4 Similarly, Dunleavy and Ward cast doubt on one of the assumptions of the Downsian model – that the position of the median constituent is fixed and exogenous to party competition. They assert that parties in electoral competition should instead be capable of (and engaged in) changing constituents’ preferences in their favour to maximize the chances of both winning elections and enacting favoured policies.Footnote 5 Politicians with strong policy preferences and significant influence on public opinion choose to shift constituents’ attitudes rather than conform to their demands.Footnote 6
Politicians can alter constituents’ attitudes using two different approaches. First, they can try to change either the content of constituents’ overall preferences to match their own (called persuasion)Footnote 7 or the emphasis given to different priorities (called framing or priming).Footnote 8 Secondly, politicians in power can exploit government policies to manipulate constituents’ socio-economic situations, which are strongly related to their policy preferences.Footnote 9 For example, Ward notes that the Conservative party in Britain shifted individuals’ policy preferences by privatizing numerous public-sector jobs during the 1980s.Footnote 10 To be successful, these strategies must align constituents’ preferences with politicians’ favoured positions and convince the voters that the politicians are responsive to these preferences – and thus mitigate the electoral costs of pursuing favoured policies.
A wide range of empirical strategies has been developed to assess the extent to which politicians and parties influence mass opinion,Footnote 11 yet most of them have not achieved both high external and internal validity simultaneously.Footnote 12 Gabel and Scheve explain that conventional non-experimental designs, including cross-sectional or time-series analyses, are likely to suffer from two types of endogeneity problems.Footnote 13 The first problem arises from the potential impact of mass opinion on politicians’ behaviour: the statistical significance of the relationship between elite positions and mass opinion does not specify who affects whom. The second endogeneity problem lies in the possibility that politicians’ behaviour and mass opinion are shifted simultaneously by unobservable changes in the political environment. Conventional non-experimental strategies often fail to minimize the possibility of a spurious relationship between the elite and the mass. Experimental studies, on the other hand, are free from these endogeneity problems and therefore tend to achieve high internal validity. Laboratory experiments or surveys are a popular method for researchers to use to compare the political attitudes of participants exposed to different types of hypothetical elite messages. Yet experimental designs are disadvantaged with respect to external validity. It is often difficult to apply experimental findings to the political situation on the ground. In short, measuring elite influences on public opinion is a surprisingly challenging task.
This article contributes a unique empirical strategy to the literature and offers new evidence that elites can alter public opinion. We use a Regression Discontinuity (RD) design to examine how American representatives affect their constituents’ opinions. The RD design exploits close US House elections (in which Democratic and Republican representatives are almost randomly assigned to constituents) and thus requires milder identifying assumptions in comparison to other non-experimental approaches.Footnote 14 The RD design's randomization mechanism generates Democratic and Republican districts that are comparable with respect to observable and unobservable baseline attributes, and thus allows us to circumvent the typical endogeneity problems discussed above. We use the RD design to compare mass attitudes and behaviour in districts that experienced a close election two years previously.
Building on the assumption that Democratic (Republican) representatives attempt to promote pro-Democratic (pro-Republican) views in their districts to secure re-election and enact desired policies, we hypothesize that Democratic representatives shift constituents’ opinions in the pro-Democratic and liberal direction, while Republican representatives shift constituents’ opinions in the pro-Republican and conservative direction. Drawing on previous research – including that of Zaller, and Gabel and Scheve – we expect that the persuasive effects of incumbent representatives are conditioned by the extent to which constituents are exposed to political information.Footnote 15 We hypothesize that incumbent representatives have a stronger effect on the opinion of constituents who are more likely to be exposed to new political information. We thus not only demonstrate the persuasive effects of incumbents on constituents’ opinions, but also the contours of those effects as determined by individuals’ interest in (and access to) political information.
We use American National Election Study (ANES) survey data (1956–2004) to measure mass opinion. This dataset enables us to analyse a sample of respondents across time and space that has a wide set of attitudinal variables such as party identification, ideology and policy views. We found that individuals in districts with Democratic representatives evaluated the Democratic party and candidates more positively than those in districts with Republican representatives. They are more likely to be a Democrat and a liberal and to support government spending, government aid to blacks and an equal role for women in society. They are also more likely to vote for the Democratic candidate in subsequent Congressional and presidential elections. The effects of representatives’ partisanship were found only among people with higher educational attainment and media usage. These findings have important implications for the literature on mass political behaviour and political representation.
Hypotheses
To examine the extent to which US representatives influence constituents’ opinions, we develop the following simple argument: incumbent representatives advertise their performance and issue positions in their district in an effort to shift constituents’ evaluations and policy preferences in their favour. Thus Democratic representatives promote their reputation and pro-Democratic views, while Republican representatives promote their reputation and pro-Republican views. These partisan messages inform constituents about candidates’ reputations and positions on issues, and lead them to evaluate candidates more positively and adopt candidates’ positions as their own.
This argument is drawn from a vast literature on Congressional politics in the United States. After they are elected, incumbent representatives who pursue both electoral and policy goals target two types of constituent attitudes. First, they seek to alter constituents’ evaluations of the representatives and their parties in order to secure their support for the next election. To enhance their personal reputations, representatives can use the benefits of office, such as federal projects and casework, to strenghten their records and advertise their activities.Footnote 16 They can also publicize their voting records if their positions are perceived favourably by constituents.Footnote 17 To bolster their party's reputation, representatives praise its legislative agenda and achievements.Footnote 18 Taken together, representatives inform constituents about their activities to promote their own (and their party's) reputation and improve their chances of re-election.
Secondly, representatives seek to alter constituents’ policy positions. If representatives succeed in persuading constituents to support their positions, they acquire a measure of leeway in Washington, D.C. that allows them to pursue their own policy goals without paying any electoral costs.Footnote 19 We assume that, on average, Democratic representatives are more likely than their Republican counterparts to send partisan messages that include liberal views on economic issues, because Congressional members of the Democratic party have demonstrated distinctly more liberal or progressive views on economic issues than members of the Republican party since the 1930s.Footnote 20 For non-economic issues such as race and abortion, partisan differences are less obvious and reflect regional variations.Footnote 21 Yet since the 1970s, the two major parties in Congress have polarized and taken distinctive stances on non-economic issues as well.Footnote 22 Thus we assume that pro-Democratic messages have also included more liberal views on non-economic issues than pro-Republican messages in recent decades.
Democratic and Republican representatives reach their constituents in two ways: directly (district visits, newsletters and media appearances)Footnote 23 or indirectly (local newspapers and television news).Footnote 24 Incumbent representatives are motivated (and have the resources) to provide substantial and positive information to their constituents. Since constituents tend to regard their representatives as trusted and knowledgeable sources of information, they are positively disposed to accept their messages.Footnote 25
Drawing on the above arguments, our first set of hypotheses focuses on how constituents’ opinions are influenced by their elected representatives. Although all discussion below is uses the case of constituents in Democratic districts, it also applies to constituents in Republican districts.
HYPOTHESIS 1: Constituents in Democratic districts become more positive about the Democratic candidate and party but less positive about the Republican candidate and party.
HYPOTHESIS 2: Constituents shift their policy positions in the direction of those favoured by their representative, for example constituents in Democratic districts become more pro-Democratic and supportive of liberal views on both economic and non-economic issues.
HYPOTHESIS 3: If representatives successfully persuade constituents, citizens in Democratic districts are more likely to vote for Democratic candidates in the subsequent national election than those in Republican districts.
The next hypothesis is drawn from recent research that emphasizes the varying effects of political information on attitude change as a function of exposure. Although political elites are an important source of information for citizens who are making decisions,Footnote 26 constituents are not equally exposed to messages from their representatives. Some constituents are more likely than others to pay attention to politics, and as a result to incorporate new information into their beliefs. Theoretically, the effect of representatives’ messages on attitude change should depend on the extent to which constituents are exposed to those messages: consistuents who receive new information are more likely to change their opinion than those who do not.Footnote 27
HYPOTHESIS 4: We expect that the effect of representatives’ messages is stronger on those who are more frequently exposed to elite messages.
Prior studies also emphasize the important role of political predispositions in accepting new information. Zaller and also Lupia and McCubbins suggest that citizens are more likely to accept information from like-minded representatives.Footnote 28 For example, Democrats find the views of Democratic representatives to be more credible and as a result incorporate them into their beliefs. Regrettably, the data used for our empirical analyses do not allow us to test this important hypothesis;Footnote 29 the article focuses only on the conditioning impact of exposure to elite messages on attitude change.
Research Design
The hypotheses are tested using the ANES cumulative data from 1956–2004 merged with House election data.Footnote 30 The ANES cumulative data offer a representative sample of the American electorate and a rich set of comparable survey questions for measuring mass attitudes and behaviour across time and space. Using information on election years, as well as states and districts in which survey respondents reside, we match US House election data at t with the survey data at t + 1, where t denotes the time of the House election. For example, representatives elected in district d in the 1996 Congressional election are expected to affect the attitudes of constituents in d as measured by the 1998 ANES survey. The unit of analysis is the individual respondent.
A number of respondents and Congressional districts are excluded from the analysis, for example if they provide no information about attitudes and behaviour expressed as outcome variables. For the analysis of vote choice in presidential elections, all respondents are dropped in the years of midterm elections. Data from Congressional districts are discarded if (1) they include no survey respondent, (2) an incumbent switched political affiliation between t and t + 1 or (3) a third-party candidate won at t.Footnote 31 Data on party switches were obtained from Grose and Yoshinaka.Footnote 32
Constituents’ attitudes and behaviour are assessed using several measures, which are grouped into three categories. As discussed above, we expect that Democratic and Republican representatives affect constituents’ evaluations of themselves and their parties, ideological preferences and vote choice. Party and candidate evaluations were measured using feeling thermometer scores on Democratic or Republican candidates (scores range from 0 to 100) and parties (0 to 97).Footnote 33 Higher scores indicate more favourable evaluations. Ideological preferences are measured by party identification, ideological self-placement, support for government job guarantees, government aid to blacks and equal status for women in society. All of these measures are based on a seven-point scale in which higher scores indicate more Democratic or liberal views (that is, a strong Democrat, extremely liberal, higher support for government spending, government aid to blacks and equal status for women). A vote choice in the national elections is coded using an indicator variable that equals 1 if respondents voted for a Democratic candidate in a Congressional or presidential election at t + 1, and 0 otherwise.
The extent to which respondents are exposed to information about their representatives is measured by respondents’ educational attainment and media usage. Education is used as a general measure of how frequently respondents are exposed to new political information through direct contacts with representatives and local mass media. Respondents with at least some college education are categorized as having a high exposure to new information; other respondents are categorized as having a low exposure.Footnote 34 Although education is not the best measure of exposure to political information,Footnote 35 the ANES cumulative data offers no better measure. Media usage is measured by how often respondents read newspapers, which allows us to examine the importance of local mass media – particularly newspapers – in informing respondents about their incumbent representatives. Those who read newspapers at least four days a week are categorized as having a high exposure to mass media; the other are considered to have a low exposure.Footnote 36
Most of the attitudinal and behaviour variables used for these analyses are available only after 1970.Footnote 37 Importantly, our analysis includes mass preferences on non-economic issues such as government aid to blacks and women's status after 1970, when the Democratic and Republican parties became ideologically polarized on these issuesFootnote 38 and sent clear ideological signals to the mass public.
The key independent variable for testing the hypotheses is the party affiliation of winning candidates in district d during election time t. The House election data include the percentage of Democratic two-party vote share. Uncontested districts are assigned 100 if they are represented by a Democratic representative, and 0 otherwise.Footnote 39 We first transformed the percentage of Democratic two-party vote share to the Democratic margin of victory by subtracting 50.Footnote 40 Negative scores for the Democratic margin of victory denote a larger share for the Republican vote, while positive scores denote a larger share for the Democratic vote. We then created an indicator variable that equals 1 if the Democratic margin of victory in d is larger than 0 per cent, and 0 otherwise. We assumed that constituents in districts with Democratic representatives receive more liberal messages than those in districts with Republican representatives.Footnote 41
To identify the causal effect of a Democratic (Republican) victory on mass attitudes and behaviour, we relied on an RD design that produces a quasi-experimental setting for causal inference. As discussed previously, conventional empirical strategies may fail to achieve both high external and internal validity simultaneously for showing the persuasive effect of incumbent representatives on their constituents’ attitudes and behaviour. Specifically, we have to circumvent two kinds of endogeneity problems: (1) the potential impact of mass opinion on representatives’ behaviour (that is, the partisanship of winning candidates might be endogenously determined at t) and (2) non-experimental designs might fail to minimize the possibility that representatives’ behaviour and mass opinion are shifted simultaneously by unobservable changes in the political environment. It is extremely difficult to control the effects of unobservable differences across districts that may affect the election outcome and mass attitudes in d if conventional cross-sectional or time-series methods are employed.
This article overcomes these endogeneity problems by using an RD design that exploits random variations associated with close House elections. In highly contested elections, in which the Democratic margin of victory is close to 0 per cent, no political actor can precisely manipulate the final election outcome. Lee argues that whether the Democratic candidates win in a closely contested election is determined ‘as if by a flip of a coin’.Footnote 42 Put differently, Broockman maintains that election outcomes are determined by ‘exogenous factors like weather and other random events that induce small variations in vote shares’.Footnote 43 Accordingly, Democratic and Republican representatives are almost randomly assigned to Congressional districts with close elections, which eliminates the effects of all other possible variables that are correlated with a Democratic victory and constituent opinion.Footnote 44 For example, recent district or national partisan trends should not confound the impact of a Democratic victory on mass attitudes and behaviour, because the randomization makes a Democratic victory in a close election exogenous to those trends.Footnote 45 Furthermore, omitted variable bias is trivial, because the key independent variable is randomly assigned and is thus exogenous to any district- or individual-level variables. The near-random assignment of representatives’ partisanship to Congressional districts enables us to isolate its causal effect on constituents’ attitudes and behaviour.
We implement the RD design using two different methods. First, we graphically display the impact of a Democratic victory on the outcome variables. Specifically, we plotted the binned average values of the dependent variables against the forcing variable (that is, the Democratic vote share, which ranges from −50 to 50). We divided the forcing variable by 2 to generate 50 bins in total. We also plotted the fitted values from a locally weighted polynomial regression estimated separately on each side of the cut-off point.Footnote 46 If a Democratic victory has any impact on constituents’ attitudes and behaviour, we should be able to find a spike in the binned local averages and the fitted values at the cut-off point.
Secondly, we estimated a parametric model in order to obtain numerical estimates of how a Democratic victory affects the outcome variables. We follow the approach developed by Imbens and Kalyanaraman and use the following local linear regression model:Footnote 47
 $${{A}_{id,t + 1}} = \tau {{D}_{d,t}} + {{\beta }_1}{{V}_{d,t}} + {{\beta }_2}{{V}_{d,t}}{{D}_{d,t}} + {{\omega }_t} + {{{\epsilon}}_{id,t}},$$
where  $$$ {{A}_{id,t + 1}} $$$ denotes an attitude or vote choice of individual i in d at t + 1; Dd,t is an indicator variable that equals 1 if district d elects a Democratic representative at t, and 0 if it elects a Republican representative; Vd,t denotes the Democratic margin of victory ranging from −50 to +50 per cent in d at t;
 $$$ {{\omega }_t} $$$ denotes year fixed effects; and
 $$$ {{{\epsilon}}_{id,t}} $$$ denotes the error term.Footnote 48 The parameter of interest in Equation 1 is τ, which represents the gap in constituents’ attitudes and vote choice in districts with and without a Democratic representative. In other words, τ represents a ‘treatment’ effect of the presumed pro-Democratic message in Democratic-winning districts on constituents’ attitudes. All respondents in Democratic-winning districts are included as a treatment group, while all respondents in Republican-winning districts are included as a control group. As is done in an experimental design, the key independent variable is assumed to be randomly assigned. We expect τ to be positive for the thermometer scores on Democratic candidates and parties, party identification, ideology, policy views and vote choices, and negative for the thermometer scores on Republican candidates and parties.
This modelling approach requires us to determine the optimal bandwidth size. A bandwidth denotes the width of the forcing variable on both sides of the cut-off point. For example, if the bandwidth is set to be −50 ≤ Vd,t ≤ 50, survey respondents in all districts are included in estimating Model 1. Lee and Lemieux note that using a large bandwidth allows researchers to include more observations and yield more precise estimates, yet these estimates may be less accurate because the linear specification may be a bad approximation of the relationship between the Democratic margin of victory and the outcome variables.Footnote 49 To avoid an arbitrary choice of bandwidth, we calculate the optimal bandwidth by using the Imbens and Kalyanaraman algorithm.Footnote 50 As a robustness check, we later report results using other bandwidths.
One important underlying assumption needs to be met for the valid use of the RD design: candidates and constituents should have imprecise control over the final outcome of a closely contested election.Footnote 51 If this assumption is valid, districts in which Democratic candidates barely won or lost are balanced with respect to observable and unobservable characteristics. Accordingly, we can eliminate the effects of other confounding variables on constituent opinion.
This assumption requires special scrutiny, because recent works by Caughey and Sekhon and by Grimmer et al. show the possibility of systematic sorting around the discontinuity in US House elections.Footnote 52 These works discuss a few reasons why such sorting might occur. Most importantly, they argue that incumbent legislators who won the district in the previous election, or parties that control the state government, appear to succeed in winnning close elections because they may have some authority to manipulate the final election outcomes. This possibility of sorting around the cut-off point is problematic for our study, because districts in which Democratic candidates barely won may in fact be more Democratic and liberal than districts where Democratic candidates barely lost. Put differently, constituents in Democratic districts may be more Democratic and liberal at t than constituents in Republican districts. If this is true, τ in Equation 1 will be overestimated.
We validate the identifying assumption by comparing the baseline covariates in Democratic and Republican districts. We first assess whether there are any differences in individual- and district-level demographic attributes at t that are likely to affect constituent opinion and behaviour at t + 1. We then assess whether there are any differences in the outcome variables at t. We report the results of our validation in the next section.
Empirical Analysis
Main Findings
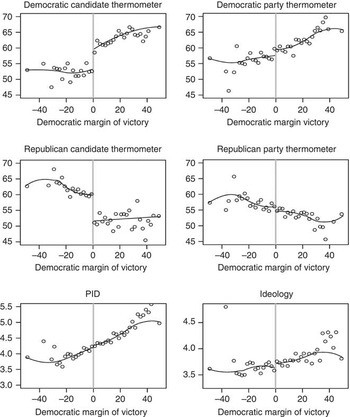
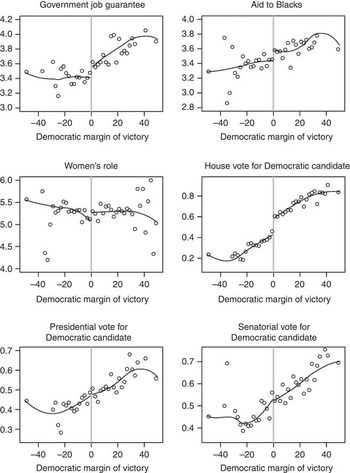
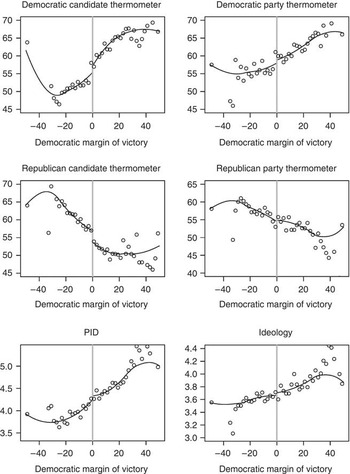
We begin with a graphical analysis of the outcome variables in Democratic and Republican districts. Figure 1 plots the binned average values of the outcome variables at time t + 1 against the Democrats’ vote share at time t. The graphs also show the fitted values from a locally weighted polynomial regression model estimated separately on each side of the cut-off point. The vertical lines indicate the cut-off points.
Differences in opinion and behaviour at t + 1 Note: The circles depict binned average values of the dependent variable. The bin widths are set at 2 percentage points, generating 50 bins. The line represents the fitted values from locally weighted polynomial regressions, estimated separately on each side of the cut-off point using the original individual-level data. We set the span equal to 1.

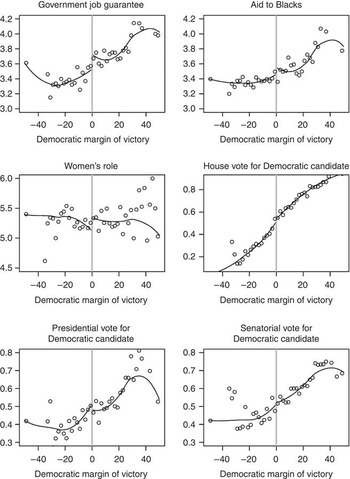
Differences in opinion and behaviour at t + 1 (continued) Note: The circles depict binned average values of the dependent variable. The bin widths are set at 2 percentage points, generating 50 bins. The line represents the fitted values from locally weighted polynomial regressions, estimated separately on each side of the cut-off point using the original individual-level data. We set the span equal to 1.

Figure 1 depicts a large discontinuous gap in the scores of the Democratic and Republican thermometer at the cut-off points. The top left graph indicates that respondents in districts where the Democratic candidate barely won at t show a thermometer score that is approximately 7 points higher at t + 1 than those in districts where the Democratic candidate barely lost. A similar effect was observed for the Republican thermometer scores. We also found a large gap in the probability of voting for Democratic candidates between Democratic and Republican districts. The probability is 20 percentage points higher in districts where the Democratic candidate barely won than in districts where the Democratic candidate barely lost. The graphs for constituents’ views on government job guarantees and aid to blacks also show a gap, yet it is not necessarily discernible. We found no gap for the other outcome variables. In short, Figure 1 offers only limited support for the hypothesis that constituents’ opinions are influenced by their elected representatives.
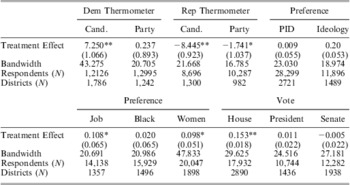
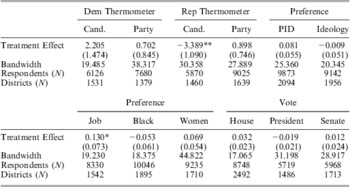
Table 1 confirms the conclusions of our graphical analysis. It reports the estimated treatment effect of a Democratic victory at t on constituent opinion and behaviour at t + 1, with standard errors in parentheses. The regression analyses include at least 10,000 respondents and 1,000 districts. Table 1 also reports optimal bandwidths, computed using the Imbens and Kalyanaraman method. As discussed previously, the estimates are based on a local linear regression model. Standard errors are computed using 1,000 bootstrapped samples in order to take the uncertainty of the optimal bandwidths into account. The Imbens and Kalyanaraman optimal bandwidths appear to be large for all of the outcome variables, which allows us to include many respondents and districts in the analyses.
Effect of Democratic Victory at t on Mass Opinion at t + 1

Note: Table entries are the estimated effects of the Democratic victory at time t on mass attitudes and behaviour at t + 1. The effects are estimated by local linear regression models. Standard errors are in parentheses and based on 1,000 bootstrapped samples. The bandwidths are computed by Imbens & Kalyanaraman's method. The thermometer scores range 0–100, while the preference variables range from 1–7. The vote choice variables equal 1 if respondents voted for a Democratic candidate. For the vote choice variables, a linear probability model is used. Year fixed effects are included in all of the models. **p < 0.05 and *p < 0.10 (two-tailed tests).
The impacts of the Democratic victory at t on some of the outcome variables at t + 1 are estimated to be statistically significant at the 0.05 level and in the expected direction. Consistent with the graphical analysis in Figure 1, the respondents in Democratic districts report higher thermometer scores for Democratic candidates but lower thermometer scores for Republican candidates compared to the respondents in the Republican districts. The estimates are statistically significant at the 0.05 level. The sizes of the estimates are similar to the sizes of the gaps at the cut-off point in the graphical analysis. In addition, the effect of a Democratic victory is also estimated to be positive and significant for the probability of voting for the Democratic candidate in the House election. Respondents in Democratic districts are more likely to vote for a Democratic candidate in the subsequent House election. In contrast, we find no statistically significant result at the 0.05 level for the effects of a Democratic victory on party evaluation, party identification, ideology, policy views or vote choice in presidential and senatorial elections. Some of the estimates are not statistically significant even at the 10 per cent level.
The weak evidence for some of the outcome variables in Figure 1 and Table 1 may indicate that all individuals are not equally affected by representatives’ messages. As discussed above, citizens change their attitudes in response to elite messages only when they receive them. It is therefore important to distinguish those who are likely to receive messages from those who are unlikely to do so.
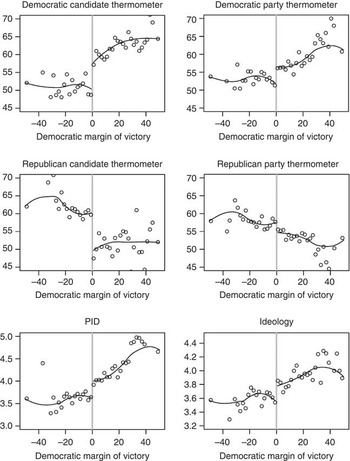
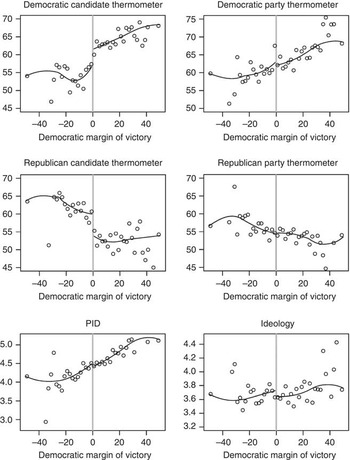
We first divided the sample into two groups with high and low levels of education. We used the level of educational attainment as a proxy for the extent to which respondents are exposed to their representatives’ messages. Figure 2 shows that there are visible gaps at the cut-off point for nine out of twelve outcome variables. We found no gap in the Republican party thermometer score for support for the equal role of women in the vote for the Senatorial candidate. The results for the candidate thermometer scores are almost identical to those in Figure 1. Further, the respondents in the districts where the Democratic candidate barely won at t show higher scores on the scale of party identification, ideology, support for government job guarantee and aid to blacks, and vote for the House and presidential Democratic candidates at t + 1, compared to those in districts where the Democratic candidate barely lost.
Differences at t + 1 for respondents with a high level of education Note: The circles depict binned average values of the dependent variable. The bin widths are set at 2 percentage points, generating 50 bins. The line represents the fitted values from locally weighted polynomial regressions, estimated separately on each side of the cut-off point using the original individual-level data. We set the span equal to 1.

Differences at t + 1 for respondents with a high level of education (continued) Note: The circles depict binned average values of the dependent variable. The bin widths are set at 2 percentage points, generating 50 bins. The line represents the fitted values from locally weighted polynomial regressions, estimated separately on each side of the cut-off point using the original individual-level data. We set the span equal to 1.

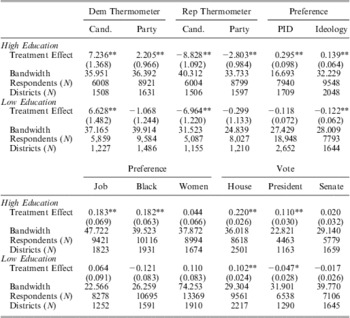
These results are replicated by the parametric analysis. Table 2 reports the estimated treatment effect of the Democratic victory on the attitudes and behaviour of the respondents by education. Note that the sizes of respondents and districts are smaller in this subgroup analysis than in the previous analysis. All coefficients are estimated to be in the expected direction for the respondents with high levels of education. Ten out of twelve estimates are statistically significant at the 0.05 level.Footnote 53Table 2 indicates that the incumbent representatives exert a strong effect on the opinion of highly educated individuals, who are likely to be exposed to partisan messages and information. The thermometer scores on the Democratic candidate are higher by about 7.2 points in Democratic districts than in Republican districts, while the scores on the Republican candidate are higher by about 8.8 points in Republican districts than in Democratic districts. The effect of a Democratic victory is weaker on the thermometer scores on the parties. The Democratic and Republican party thermometer score is different by 2.2 to 2.8 points between the Democratic and Republican districts. Note that a Democratic victory has a significant impact on the Republican party thermometer scores, though the graphical analysis does not show a large gap in the scores at the cut-off point.
Effect of Democratic Victory at t on Mass Opinion at t + 1 by Education

Note: Table entries are the estimated effects of the Democratic victory at time t on mass attitudes and behaviour at t+1. The effects are estimated by local linear regression models. Standard errors are in parentheses and based on 1,000 bootstrapped samples. The bandwidths are computed by Imbens & Kalyanaraman's method. The thermometer scores range 0–100, while the preference variables range from 1–7. The vote choice variables equal 1 if respondents voted for a Democratic candidate. For the vote choice variables, a linear probability model is used. Year fixed effects are included in all of the models. **p < 0.05 and *p < 0.10 (two-tailed tests).
Partisan and policy preferences are also strongly affected by the partisanship of incumbent representatives. Surprisingly, the party of the incumbent representatives has a large impact on the party identification and ideological position of respondents with high levels of education. Those in Democratic districts show more pro-Democratic and liberal identifications by 0.14 to 0.30 points on the seven-point scale. This shift in party identification and ideological standpoints is consistent with the view that people's party affiliations are heavily influenced by their immediate political and economic environment.Footnote 54 Further, it appears that the party affiliation of constituents’ incumbent representatives also shifts their views on policy issues. Those in Democratic districts show greater support for government job guarantees and government aid to blacks by 0.18 points on the seven-point scale. Yet a Democratic victory has no significant impact on respondents’ views on equal status for women in society.
Table 2 also reports that constituents of Democratic districts are 10–22 per cent more likely than those in Republican districts to vote for the Democratic candidate in House elections. A Democratic victory at t increases the probability of voting for the Democratic candidate at t + 1 by 15.0 points when the overall sample is analysed, by 22.0 when the subsample of respondents with a high level of education is analysed and by 10.0 when the subsample of respondents with a low level of respondents is analysed. These results are consistent with Lee's findings, yet the substantive effects we found are larger than Lee's analysis, which showed a 9 per cent increase in the Democratic vote share.Footnote 55
In contrast to Broockman's findings, we find strong support for the reverse coattail effects of Congressional members on presidential candidates if the sample is limited to highly educated respondents. Interestingly, a significant reverse coattail effect is not found when all respondents are included in the analysis, as reported in Table 1. This indicates that Broockman's null findings may be due to the fact that Broockman paid no attention to heterogeneity in voters’ exposure to political information.Footnote 56
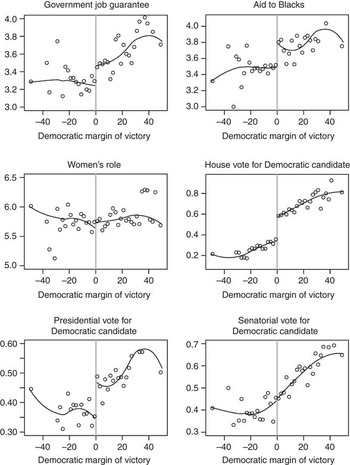
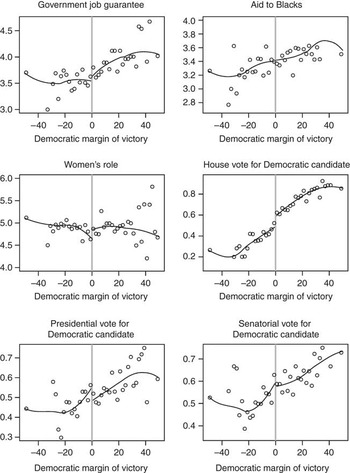
In contrast, Figure 3 and Table 2 report that constituents with a low level of education show less systematic reactions to the presence of Democratic or Republican representatives. The graphs in Figure 3 indicate that – except for the candidate thermometer scores and vote choice in the House election – there is no significant difference in the opinions and behaviour of less educated respondents between the districts where Democratic candidates barely won and lost. More than half of the coefficients in Table 2 are estimated to have the wrong sign or lose statistical significance at the conventional level. Furthermore, the sizes of the statistically significant coefficients in Table 2 are smaller than those in the second panel. In short, these results indicate that elected representatives affect the opinion of constituents who are more likely to receive their messages.
Differences at t + 1 for respondents with a low level of education Note: The circles depict binned average values of the dependent variable. The bin widths are set at 2 percentage points, generating 50 bins. The line represents the fitted values from locally weighted polynomial regressions, estimated separately on each side of the cut-off point using the original individual-level data. We set the span equal to 1.

Differences at t + 1 for respondents with a low level of education (continued) Note: The circles depict binned average values of the dependent variable. The bin widths are set at 2 percentage points, generating 50 bins. The line represents the fitted values from locally weighted polynomial regressions, estimated separately on each side of the cut-off point using the original individual-level data. We set the span equal to 1.

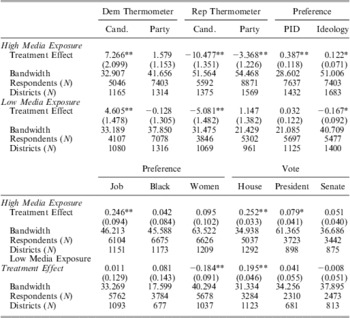
Next, we divided the sample by level of media exposure, which was measured by the frequency of reading a newspaper each week. We assumed that those who read a newspaper at least four days a week were more likely to receive information on their representative and thus change their attitudes than those who read a newspaper less than four days per week. Since the media usage variable is available only after 1982, our analysis uses the sample after 1982. Table 3 reports the results for the respondents with high media exposure.Footnote 57 As expected, Table 3 displays significant differences in the thermometer scores on the candidates, the Republican party, party identification, government provisions of jobs and vote choice in the House and presidential elections between the Democratic and Republican districts. In contrast, Table 3 indicates that respondents with low media exposure were mostly unaffected by the party affiliation of their representative. The estimated effects on ideological scores and views on women's status have the wrong sign.Footnote 58
Effect of Democratic Victory at t on Mass Opinion at t + 1 by Media Consumption

Note: Table entries are the estimated effects of the Democratic victory at time t on mass attitudes and behavior at t + 1. The effects are estimated by local linear regression models. Standard errors are in parentheses and based on 1,000 bootstrapped samples. The bandwidths are computed by Imbens & Kalyanaraman method. The thermometer scores range from 0 to 100, while the preference variables range from 1 to 7. The vote choice variables equal 1 if respondents voted for a Democratic candidate. For the vote choice variables, a linear probability model is used. Year fixed effects are included in all of the models. **p < 0.05 and * p < 0.10 (two-tailed tests).
The results of these subgroup analyses suggest that exposure to relevant political information plays an important role in the underlying mechanism connecting elite messages with constituent opinion and behaviour. However the evidence does not directly show that the exposure mediates the relationship, because education and the frequency of newspaper reading are correlated with other factors such as cognitive ability. Ideally, the amount of exposure to political information on elected representatives would also be randomly assigned to respondents, yet our research design does not allow that. Accordingly, the results of our subgroup analyses require special attention in interpretation.
Robustness Check
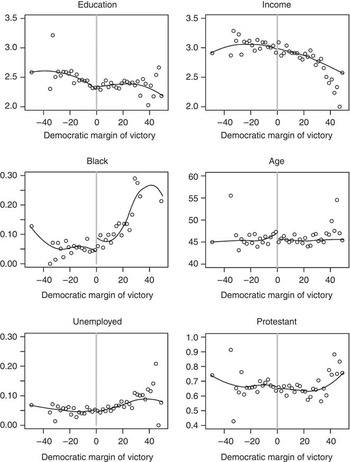
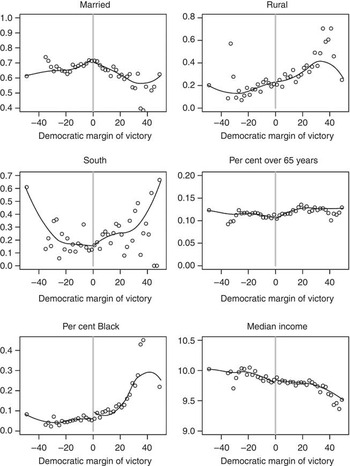
We conducted several tests to check the robustness of our findings. We validated the assumption that individuals and districts were similar in their observed baseline covariates below and above the cut-off point of the forcing variable. If the party affiliation of representatives is near-randomly assigned to districts with close elections, it must have no relationship with the individual- and district-level characteristics determined prior to the assignment of party affiliation. To test this assumption, we compared individual- and district-level baseline covariates between Democratic and Republican districts by plotting the binned average values of the baseline covariates at time t against the Democratic vote share at time t with the fitted values from local polynomial regression. Individual-level baseline covariates include standard demographic variables such as education, income, race, age, employment status, religious beliefs, marital status, urbanism and region of residence. Education and income are measured using a four-point scale. Age is measured in years. Other variables are measured using an indicator variable that equals 1 if a respondent is black, unemployed, protestant, married, resides in a rural area or resides in the South, and 0 otherwise. District-level covariates include the percentage of the population that is over 65, the percentage that is black and the log median income.
Figure 4 presents the results for the twelve baseline covariates. A large gap around the discontinuity was found in the graph showing the racial balance. Black respondents were more likely to reside in Democratic districts than in Republican districts. A gap was also found for the graph on age and the percentage of blacks residing in districts. The other nine graphs showed no discontinuity around the cut-off point.
Differences in demographic attributes at t Note: The circles depict binned average values of the dependent variable. The bin widths are set at 2 percentage points, generating 50 bins. The line represents the fitted values from locally weighted polynomial regressions, estimated separately on each side of the cut-off point using the original individual-level data. We set the span equal to 1.

Differences in demographic attributes at t (continued) Note: The circles depict binned average values of the dependent variable. The bin widths are set at 2 percentage points, generating 50 bins. The line represents the fitted values from locally weighted polynomial regressions, estimated separately on each side of the cut-off point using the original individual-level data. We set the span equal to 1.

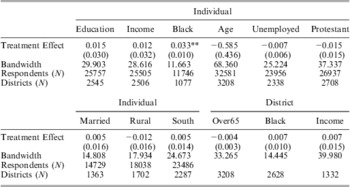
Table 4 reports the estimated effects of a Democratic victory at t on the baseline covariates at t. Equation 1 is used for estimation. Consistent with the graphical analysis, a Democratic victory has a positive and statistically significant impact on the race variable, while it has no systematic impact on the other demographic variables. These results suggest that individuals and districts are balanced with respect to most of the demographic attributes. Yet the results for the race variable indicate that Democratic districts tend to include more black voters than Republican districts. We cannot deny the possibility that the main findings in Figures 1–3 and Table 1 are partly driven by this imbalance between the districts, since black respondents tend to be pro-Democratic and liberal.
Effect of Democratic Victory at t on Pre-determined Democraphic Variables at t

Note: Table entries are the estimated effects of the Democratic victory at time t on pre-determined demographic variables at t. The effects are estimated by local linear regression models. Standard errors are in parentheses and based on 1,000 bootstrapped samples. The bandwidths are computed by Imbens & Kalyanaraman method. Year fixed effects are included in all of the models. **p <0 .05 and *p<0.10 (two-tailed tests).
To test the assumption, we examined whether a Democratic victory at t has any relationship with the attitudes measured prior to the determination of the Democratic victory. Similarly, we evaluated the effects of a Democratic victory at t on constituent opinion and behaviour at t. Because respondents had not yet received partisan messages from representatives elected in election t at the time of the survey, we expected to see no systematic differences in their attitudes and behaviour. Figure 5 reports that only two graphs (Republican candidate thermometer and support for government job guarantee) showed a noticeable gap at the cut-off point. In fact, Table 5 shows that a Democratic victory in election t has no significant effect on the other outcome variables.Footnote 59 The coefficients for the Republican candidate thermometer and government job guarantee are significant at the 0.05 and 0.10 levels, respectively. These results suggest that there are some differences in the Republican candidate thermometer score and the view on government job guarantee, and imply that the significant effect of a Democratic victory at t on these variables at t + 1 might be due to the imbalance at t.
Differences in pre-determined opinions and behaviour at t Note: The circles depict binned average values of the dependent variable. The bin widths are set at 2 percentage points, generating 50 bins. The line represents the fitted values from locally weighted polynomial regressions, estimated separately on each side of the cut-off point using the original individual-level data. We set the span equal to 1.

Differences in pre-determined opinions and behaviour at t (continued) Note: The circles depict binned average values of the dependent variable. The bin widths are set at 2 percentage points, generating 50 bins. The line represents the fitted values from locally weighted polynomial regressions, estimated separately on each side of the cut-off point using the original individual-level data. We set the span equal to 1.

Effect of Democratic Victory at t on Pre-determined Opinion Variables at t

Note: Table entries are the estimated effects of the Democratic victory at time t on pre-determined opinion variables at t. The effects are estimated by local linear regression models. Standard errors are in parentheses and based on 1,000 bootstrapped samples. The bandwidths are computed by Imbens & Kalyanaraman method. Year fixed effects are included in all of the models. **p < 0.05 and *p < 0.10 (two-tailed tests).
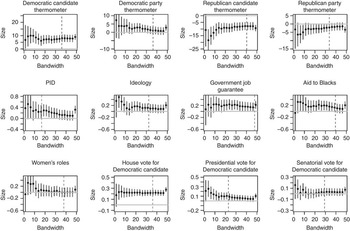
As a final robustness check, we assesssed the sensitivity to bandwidth choice. We re-estimated Equation 1 by changing the size of bandwidth from ±0 to ±50 incrementally by 2.5 percentage points. We focused on the sample of respondents with a high level of education to confirm that our main findings in the second panel of Table 1 were not driven by the choice of bandwidth. Figure 6 plots the RD estimates, and the associated 95 per cent confidence intervals, as a function of the bandwidth. The vertical dashed lines indicate optimal bandwidth based on the Imbens and Kalyanaraman algorithm.Footnote 60Figure 6 shows that the estimated effects of a Democratic victory on the outcome variables appear to vary over the bandwidths, but our main findings with the I–K optimal bandwidth approximate the impacts estimated under the other bandwidths. Importantly, the size of the coefficients vary considerably, and the 95 per cent confidence intervals are larger as the bandwidths are set smaller, because the number of respondents in the small bandwidths decreases considerably. The numbers of respondents and districts are typically below 500 and 200, respectively, when the bandwidth is set at ±2.5. Again, the instabilities of the RD estimates across bandwidths indicate that the estimated impacts of a Democratic victory are partly sensitive to the estimation strategy.
RD estimates and confidence intervals by bandwidth at t + 1 for respondents with a high level of education Note: The RD estimates are based on the subsample with a high level of education. Circles indicate the point estimates, while the vertical solid lines indicate the 95 per cent confidence intervals. Dotted lines indicate the location of the I–K bandwidth.

Conclusion
This study examined whether politicians shape mass opinion: a question that is central to studies on political behaviour and representation. Yet conventional empirical strategies suffer from limitations that leave us uncertain about the causal effect of elite behaviour on mass opinion. This study used an RD design to overcome these limitations. We exploited random variations associated with close US House elections and created a quasi-experimental setting in which the party affiliation of winning candidates was near-randomly assigned to constituents. We assumed that the nature of the messages that winning candidates delivered to constituents reflected their party affiliation. That is, Democratic representatives send messages that include pro-Democratic and liberal views, while Republican representatives send messages that include pro-Republican and conservative messages. We assumed that constituents receive these views and change their attitudes in a direction consistent with the nature of the messages.
The empirical analysis using the ANES data showed that Democratic representatives shift the opinions of their constituents in the pro-Democratic and liberal direction, while Republican representatives shift opinions in the pro-Republican and conservative direction. The strong effects of representatives’ party affiliation are observed only among people with higher levels of education and media exposure. Constituents in districts with Democratic incumbents evaluate the Democratic party and candidates more positively than those in districts with Republican incumbents. Those in Democratic districts are more likely to be a Democrat and liberal – and to support government spending, government aid to blacks and women's equal status in society. Further, those in Democratic districts are more likely to vote for Democratic candidates in subsequent House and presidential elections.Footnote 61
These findings support the view that politicians actively seek to alter their constituents’ policy positions. However the opinion linkage between the elite and the masses is much more complicated than traditional studies of representation suggest. Politicians have a strong incentive to persuade constituents to adopt their political views in order to mitigate the electoral costs of pursuing favoured policies. Consistent with the works of Dunleavy and Ward and by Gerber and Jackson, moreover, the evidence also indicates that the assumption of fixed and exogenous voter preferences in the Downsian theory of party competition is unrealistic. We cannot simply expect that politicians will conform to what the median voter demands. Downs himself notes that parties will ‘attempt to move voters towards their own location, thus altering it’.Footnote 62 This highlights the importance of modelling party competition by treating voter preferences as an endogeneous variable.Footnote 63 Finally, as suggested by Hurley and Hill, the direction of the relationship between the elite and the masses may vary between policy issues.Footnote 64
These empirical findings do not necessarily imply that the partisan bias in favour of the incumbent's party is constantly reinforced in the district over time. Constituents are usually surrounded by competitive environments and subject to the partisan messages of other opinion leaders such as presidents, the mass media and discussion partners.Footnote 65 For example, constituents may receive liberal messages from their Democratic representative and conservative messages from the president at the same time. Thus the representative may shift constituents’ opinions in a liberal direction, while the president may shift them in a conservative direction. Our empirical analysis shows the extent to which representatives affect constituent opinion and behaviour after controlling for the influence of other actors using the randomization mechanism, yet those findings provide no information regarding the influences of other actors. If the influence of representatives’ messages is stronger than the total influences of other political actors, the bias in favour of the incumbent's party will be constantly reinforced in the district. This possibility is small because presidents and other political actors also have a strong impact on the formation of mass opinion and behaviour, and because representatives often seek to alter constituents’ preferences in a competitive environment in which parties with opposing views also seek to influence public opinion.Footnote 66
Similarly, the strong elite influence on mass opinion does not necessarily imply that the elite is capable of arbitrarily manipulating public opinion. As discussed above, citizens in competitive democracies tend to be exposed to competing messages from multiple opinion leaders,Footnote 67 which may cancel each other out. In contrast, citizens in less competitive environments, in which a single party dominates the nation, may be susceptible to one-sided messages and elite manipulation. Thus the elite in competitive democracies can inform citizens about politics, but not necessarily manipulate their opinions.
One may wonder how generalizable the findings are to other contexts. The linkage between US House representatives and their constituents is characterized by three specific features that are not always present outside of the United States. First, the single-member district system in the United States allows incumbent representatives to monopolize power within their district and deliver messages to their constituents quite easily, because their constituents live in a geographically concentrated area. In a multi-member district system such as proportional representation, multiple party representatives with opposing views are eligible to send partisan messages to their constituents as elected officials. Furthermore, party representatives may find it difficult to deliver messages to supporters who are geographically scattered. Secondly, the ideological division between the two major US parties enables representatives to send clear partisan messages to their constituents. Under a multi-party system in which the ideological differences between parties are less clear, legislators and party leaders may not be able to send clear ideological messages. Thirdly, US representatives can rely on local mass media to advertise their activities and policy positions.Footnote 68 Legislators may not be able to communicate with their constituents or supporters through national mass media that are not likely to focus on a particular legislator.Footnote 69 In short, generalizing our findings beyond the American context requires special attention.
This article leaves a few important questions unanswered. Data limitations require us to assume that the effect of partisan messages is constant regardless of people's political predispositions, yet people with solid predispositions may not be strongly influenced by these messages. In addition, it is crucial to investigate elite influences on mass opinion in competitive environments. For example, Democratic representatives may have a stronger impact on constituents’ opinions when the president is Democratic. Future research needs to answer these questions to enhance understanding of the elite–mass opinion linkage.