Commercial dairies require milk of the highest possible composition and hygiene standards to meet consumer demand for safe and high-quality products. The production capacity of dairy cows has increased tremendously with high demands to maintain cow health and welfare, since only healthy cows will produce milk of high quality. Despite many control programmes and much research, mastitis (inflammation of the udder) is still the most common disease of dairy cows and is one of the main reasons for impaired milk quality (Bradley, Reference Bradley2002; Le Roux et al. Reference Le Roux, Laurent and Moussaoui2003).
During recent years the number of dairy herds has decreased, while the number of cows per herd has increased. Consequently, there is less time for the farmer to manage each animal and more automated milking systems have been installed in dairy farms. There is an increased need for tools that can help the farmer in management decisions, for example through frequent analyses of the milk. It would be useful if different biomarkers in the milk could be used to detect changes related to different conditions, e.g. udder health disturbances. It is common for only one udder quarter to be affected by mastitis and the condition may go undetected owing to the dilution effect from the other three quarters on cow composite samples, especially in cases of subclinical mastitis (Berglund et al. Reference Berglund, Petterson, Östensson and Svennersten-Sjaunja2007; Forsbäck et al. Reference Forsbäck, Lindmark-Månsson, Andrén, Åkerstedt and Svennersten-Sjaunja2009). Today in-line recording is possible on udder quarter level in automated milking systems and on cow composite milk level in milking parlours.
Somatic cell count (SCC) has been used as the gold standard for decades to diagnose subclinical mastitis and is also an important parameter in dairy cooperative quality programmes, greatly affecting the price to the producer. However, SCC does not always correlate with infection of the udder (Schepers et al. Reference Schepers, Lam, Schukken, Wilmink and Hanekamp1997, Lakic et al. Reference Lakic, Wredle, Svennersten-Sjaunja and Östensson2009) and it may be affected by other factors, e.g. lactation number, stage of lactation, milk production level, stress, season and breed (Harmon, Reference Harmon1994; Schepers et al. Reference Schepers, Lam, Schukken, Wilmink and Hanekamp1997). Various cut-off values for SCC in mastitis diagnostics have been discussed, but the suggested level differs between studies since different conventions are used in different countries and different breeds are involved, as well as various types of milk samples (Mattila et al. Reference Mattila, Pyörälä and Sandholm1986; Holdaway et al. Reference Holdaway, Holmes and Steffert1996). New indicators for inflammation are needed for more sensitive and specific identification of infected animals (Pyörälä, Reference Pyörälä2003; Leitner et al. Reference Leitner, Krifucks, Merin, Lavi and Silanikove2006).
For many years there has been an interest in using different enzymes in milk as biomarkers for mastitis. Lactate dehydrogenase (LDH), which is a cytoplasmic enzyme, has been suggested as a biomarker for udder health disturbances (Chagunda et al. Reference Chagunda, Larsen, Bjerring and Ingvartsen2006b; Hiss et al. Reference Hiss, Mueller, Neu-Zahren and Sauerwein2007) and statistical models for mastitis detection have been developed using LDH (Chagunda et al. Reference Chagunda, Friggens, Rasmussen and Larsen2006a). The enzyme is now being used as a mastitis indicator in commercial herd management, and it is possible to analyse LDH in-line in cow composite milk samples. Furthermore, there are a number of publications concerning N-acetyl-β-d-glucosaminidase (NAGase) as a marker for mastitis (Mattila et al. Reference Mattila, Pyörälä and Sandholm1986; Holdaway et al. Reference Holdaway, Holmes and Steffert1996; Nielsen et al. Reference Nielsen, Larsen, Bjerring and Ingvartsen2005). NAGase is an intracellular enzyme which is mainly released from the polymorphonuclear leucocytes during phagocytosis and cell lysis. The connection between milk alkaline phosphatase (AP) and mastitis has been recognized for decades (Bogin & Ziv, Reference Bogin and Ziv1973; Babaei et al. Reference Babaei, Mansouri-Najand, Molaei, Kheradmand and Sharifan2007). However, in practice only a few studies on this enzyme have been published, although it has recently been suggested as a biomarker for human mastitis (Rasmussen et al. Reference Rasmussen, Hansen, Kæstel, Michaelsen, Friis and Larsen2008).
The major bovine acute phase proteins, serum amyloid A (SAA) and haptoglobin (Hp), have been suggested as biomarkers for mastitis (Eckersall et al. Reference Eckersall, Young, McComb, Hogarth, Safi, Weber, McDonald, Nolan and Fitzpatrick2001; O'Mahony et al. Reference O'Mahony, Healy, Harte, Walshe, Torgerson and Doherty2006; Hiss et al. Reference Hiss, Mueller, Neu-Zahren and Sauerwein2007) but recently also as markers for milk quality (Åkerstedt et al. Reference Åkerstedt, Persson Waller, Bach Larsen, Forsbäck and Sternesjö2008). Hp and SAA are hepatically produced, but there is also local production in the udder (McDonald et al. Reference McDonald, Larson, Mack and Weber2001; Hiss et al. Reference Hiss, Mielenz, Bruckmaier and Sauerwein2004). Both Hp and SAA have antibacterial functions; Hp through binding free haem groups (Eaton et al. Reference Eaton, Brandt, Mahoney and Lee1982) and SAA through attaching to Gram-negative bacteria and thereby facilitating phagocytosis (Larson et al. Reference Larson, Weber, Weber and McDonald2005), and consequently they are interesting as early biomarkers for mastitis.
There is a lack of knowledge concerning the variations between milkings in those parameters that could be used as indicators for mastitis in clinically healthy udder quarters. It is important to gain information about the natural variations in clinically healthy animals in order to detect deviations outside these normal variations. Such information is needed to evaluate whether the biomarker is a possible candidate for routine analyses of the milk for mastitis indication, and if so how often samples must be collected, since a biomarker with high variation between milkings has to be sampled more often than a biomarker with low natural variation.
The aim of this study was to investigate the level and variations between milkings in the biomarkers SAA, Hp, LDH, NAGase and AP at udder quarter level in ten clinically healthy cows during 42 consecutive milkings.
Materials and Methods
Animals
Ten cows of the Swedish Red breed were included in the study. They belonged to the Swedish University of Agricultural Sciences dairy farm, Kungsängen Research Farm, Uppsala. The study was approved by the Uppsala Ethical Committee.
The cows were considered clinically healthy, i.e. had no clinical signs of disease or abnormalities in the udder or milk. The criterion for inclusion in the study was a cow composite SCC <100 000 cells/ml and bacteriologically negative samples in all four udder quarters before the trial started. Udder health status was determined by SCC analysis and repeated bacteriological sampling on udder quarter level. The cow composite SCC ranged from 9000 to 72 000 cells/ml (mean±sd 33 000±21 000 cells/ml). Despite a low cow composite SCC (53 000 cells/ml) before the trial started and bacteriologically negative samples in all four udder quarters, one of the cows (cow A) appeared to be subclinically infected in one udder quarter with Enterobacter cloacae. The quarter was tested bacteriologically positive for the first time on day 3 of the study period and continued to be infected throughout the whole study period.
The cows were tethered in a tie stall, fed according to Swedish recommendations (Spörndly, Reference Spörndly2003) and were milked twice a day. The study was performed during three consecutive weeks in the spring (April–May). Mean±sd for lactation number, lactation week and daily milk yield were 2±2 lactations, 27±9 weeks and 21·6±1·7 kg milk, respectively.
Milking equipment and sampling procedure
Udder quarter milk samples and cow composite milk samples were collected during every milking for a total of 42 consecutive milking occasions. Cows were milked with a specially designed milking machine, constructed and provided by DeLaval International (147 21 Tumba, Sweden) with monovac, pulsation ratio 70/30 and system vacuum 42 kPa. This milking machine collects the total milk volume from each udder quarter in a separate bucket for the whole milking. After milking was completed, samples from each individual udder quarter were collected, and then all milk from the four buckets was commingled and a representative cow composite milk sample was taken. After SCC analysis, the milk samples were frozen and stored at −70°C until analysis of SAA, Hp, LDH, NAGase and AP.
Bacteriological sampling was performed from all udder quarters at the end of each morning milking. Before sample collection, the teats were wiped with an udder towel, the first jets of milk were discarded and the teat ends were disinfected with 70% alcohol and allowed to dry. Within an hour after milking was completed, each quarter milk sample was cultured on 5% blood agar with 0·05% aesculin and incubated for 48 h. When growth was observed, the agar plate was sent to the mastitis laboratory, National Veterinary Institute, Uppsala, Sweden, and evaluated according to quality assurance protocol SS-EN ISO/IEC 17025. SCC was measured by an electronic fluorescence-based cell-counting technique (Fossomatic 5000, Foss, 3400 Hillerød, Denmark).
Assay of serum amyloid A and haptoglobin
SAA was determined using a commercial ELISA kit (Mast ID RANGE Milk Amyloid A Assay, cat TP-807, Tridelta Development Ltd, Wicklow, Ireland). Milk samples were initially diluted 1:50, and samples with an optical density above the range of the standard curve were further diluted and re-analysed. Optical density was read on an automatic plate reader (Model ELx 800; Bio-Tek Inc, San Diego CA, USA) at 450 nm with a reference at 630 nm. The limit of detection (LOD) of the ELISA was 0·1 mg/l according to the manufacturer.
Hp was analysed by a previously described optical biosensor assay (Åkerstedt et al. Reference Åkerstedt, Björck, Persson Waller and Sternesjö2006) with some modifications. The sensor surface was immobilized using a solution of 20 mg/l instead of 500 mg/l Hp in 0·01 m-acetate buffer, and the activation of the surface during immobilization was reduced from 7 min to 3 min. The concentration of the regeneration solution, sodium dodecyl sulphate, was increased from 2 mm to 3 mm. In addition, an extra reconditioning step was added after the ordinary regeneration step, in which 50 mm-glycine pH 9·5 was injected over the sensor surface for 30 s. Bovine Hp (Life diagnostics, 19380 West Chester PA, USA) was used for immobilization and standards, and the LOD was 1·0 mg/l.
Assay of lactate dehydrogenase, N-acetyl-β-d-glucosaminidase and alkaline phosphatase
NAGase (EC 3.2.1.30) activity, was determined by a kinetic, fluorometric assay, in principle according to Kitchen et al. (Reference Kitchen, Middleton and Salmon1978) and Schüttel (Reference Schüttel1999). The intra assay precision was 5·0 and 3·7 (CV%), respectively, and the inter assay precision was 6·3 and 5·4 (CV%) for low (1·11 U/l) and high (5·56 U/l) controls, respectively. LDH (EC 1.1.1.27) activity, was analysed according to Larsen (Reference Larsen2005), by a fluorometric, kinetic method. The intra assay and inter assay precision was 6·6 and 4·2 (CV%) and 9·7 and 10·1 (CV%) for low and high controls, respectively. AP (EC 3.1.3.1) activities were determined by kinetic, fluorometric detection, using 4-methylumbelliferone phosphate (41504-0010, Acros Organics, 2440 Geel, Belgium) as substrate (Fernley & Walker, Reference Fernley and Walker1969). The activity was determined at pH 10·0 (120 mm-diethanolamine buffer). Excitation wavelength was 355 nm, emission was detected at 460 nm. The intra assay precision was 3·9 (low) and 5·2 (high) (CV%), respectively, and inter assay precision was 11·2 (low) and 7·7 (high) (CV%) for control samples, respectively.
Statistical analyses
Unadjusted mean, sd and coefficient of variation (CV) for SAA, Hp, LDH, NAGase and AP in udder quarter milk were calculated with the GLM and VARCOMP procedure in SAS 9.1 (SAS Institute, 2004) using the following model:

where:
Yijklm = is the ijklmth observation of each trait
μ = general mean
αi = the effect of the ith cow (1, 2,..,10) if ten cows or (1, 2,.., 9) if nine cows
(αβ)ij = the effect of the jth udder quarter within cow (1, 2, 3, 4)
(αβγ)ijk = the effect of the kth milking within cow and udder quarter (1, 2)
(αδ)il = the effect of the lth week within cow (1, 2, 3)
eijklm = random error, normal distributed
Unadjusted mean, sd and CV for SAA, Hp, LDH, NAGase and AP in cow composite milk were calculated with the GLM and VARCOMP procedure in SAS using the following model:

where:
Yijkl = is the ijklth observation of each trait
μ = general mean
αi = the effect of the ith cow (1, 2,..,10) if ten cows or (1, 2,.., 9) if nine cows
(αβ)ij = the effect of the jth milking within cow (1, 2)
(αγ)ik = the effect of the kth week within cow (1, 2, 3)
eijkl = random error, normal distributed
Unadjusted mean and CV for each udder quarter of every cow were calculated with the GLM and VARCOMP procedure in SAS procedure using the following model:

where:
Yijk = is the ijkth observation of each trait
μ = general mean
αi = the effect of the ith milking (1, 2)
βj = the effect of the jth week (1, 2, 3)
eijk = random error, normal distributed
CV for random error, designated as variations between milkings, was calculated from the mean of each parameter and the sd of the random error.
Results
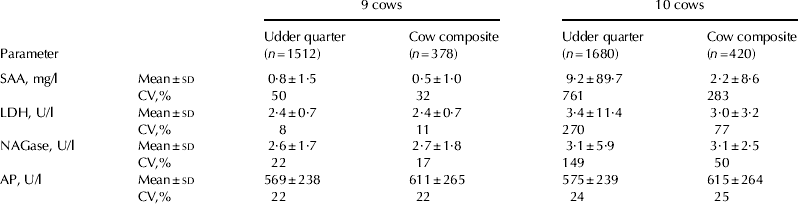
Nine of the ten cows included in the study were bacteriologically negative in all udder quarters throughout the study period. One cow was bacteriologically positive in one quarter. The average SCC for the nine healthy cows was 41 400±55 800 cells/ml on udder quarter level and 38 100±31 600 cells/ml on cow composite level. When the subclinically infected cow was included, the average SCC for the ten cows was 198 900±1 455 800 cells/ml on udder quarter level and 219 700±914 700 cells/ml on cow composite level. Table 1 presents the mean±sd and variations between milkings for each parameter analysed in udder quarter milk samples and representative cow composite milk samples for the nine clinically healthy cows and all ten cows, including the subclinically infected cow (cow A).
Mean values±sd and variations between milkings (CV%) for the biomarkers analysed: serum amyloid A (SAA), lactate dehydrogenase (LDH), N-acetyl-β-d-glucosaminidase (NAGase) and alkaline phosphatase (AP) in representative quarter and cow composite milk samples for the nine clinically healthy cows and also for all ten cows, including one subclinically infected cow

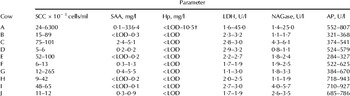
Mean values of somatic cell count (SCC), serum amyloid A (SAA), haptoglobin (Hp), lactate dehydrogenase (LDH), N-acetyl-β-d-glucosaminidase (NAGase) and alkaline phosphatase (AP) for individual quarters within cows, presented as minimum and maximum values for the four udder quarters. Cow A was subclinically infected in one quarter

† LOD = limit of detection
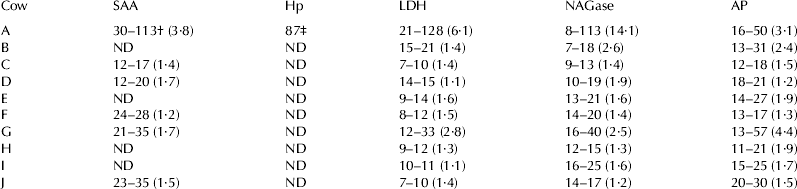
Variations between milkings (%) in serum amyloid A (SAA), haptoglobin (Hp), lactate dehydrogenase (LDH), N-acetyl-β-d-glucosaminidase (NAGase) and alkaline phosphatase (AP). Results are presented as minimum and maximum values for the udder quarters within each cow. Differences are presented in brackets as the ratio between maximum and minimum value

† Only values for three quarters are presented because one quarter was below the limit of detection (LOD)
‡ Only one value is presented because the subclinically infected quarter was the only quarter with values above LOD
ND=Not determined since values were below LOD for the assay
The mean values and the variations between milkings for SAA, LDH and NAGase increased when the subclinically infected cow A was included, both when comparing quarters and cow composite milk samples in comparison with the nine clinically healthy cows. The corresponding difference in mean values or variations between milkings was not observed for AP when the subclinically infected cow was included. Hp is not presented in Table 1 since Hp was <LOD for all samples except for the subclinically infected udder quarter in cow A. The lowest variation was observed for LDH among the nine clinically healthy cows on quarter as well as cow composite level.
The mean values for each udder quarter within individual cows were calculated and the minimum and maximum mean values for each cow are presented in Table 2. Cow A was subclinically infected in one quarter, while the other cows (B–J) tested bacteriologically negative in all quarters throughout the study period. The mean value for SAA varied between <LOD and 5·5 mg/l in the clinically healthy quarters, while the subclinically infected quarter (cow A) had a mean value of 336·4±459·4 mg/l. The subclinically infected cow A had three quarters with SAA values >LOD and one quarter with values <LOD. Five cows (C, D, F, G and J) had SAA values >LOD in all four quarters. The remaining cows (B, E, H and I) had one quarter with SAA values >LOD and the remaining three quarters had values <LOD.
Hp only had detectable levels, >LOD, for the subclinically infected quarter (cow A), where Hp ranged from <LOD to 35 mg/l, mean value of 10·5±9·2 mg/l. The mean value for LDH varied between 1·1 and 3·2 U/l in the clinically healthy udder quarters, while the subclinically infected quarter (cow A) had a mean value of 45·0±58·9 U/l. AP values ranged between 284 and 943 U/l, irrespective of udder health status, while the level of NAGase was between 0·8 and 6·1 U/l in the healthy udder quarters, but a mean value of 25·0±28·9 U/l in the subclinically infected quarter.
Table 3 presents the variations between milkings for the parameters analysed for individual cows. For SAA, the variations between milkings are presented for the cows with values >LOD in three udder quarters (cow A) or all four udder quarters (C, D, F, G and J). The variation between milkings was 12–35% for SAA in the healthy udder quarters, while in the subclinically infected udder quarter it was 113%. It was only the subclinically infected udder quarter in cow A that had values >LOD for Hp, and therefore only one figure for the variation between milkings is presented. For LDH, the variation between milkings ranged from 7 to 33% in the healthy udder quarters, while the variation in the subclinically infected udder quarter was 128%. For AP the variation was 11–57% for all udder quarters, irrespective of udder heath status, and the variation for NAGase was 7–40% in healthy udder quarters, while the subclinically infected udder quarter had a variation of 113%. In addition, the difference within each cow is presented in Table 3 as the ratio between maximum and minimum value for the variation, e.g. cow A, SAA (113/30=3·8).
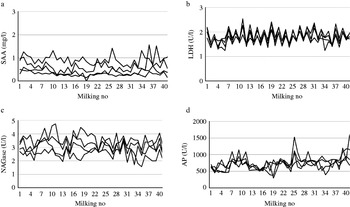
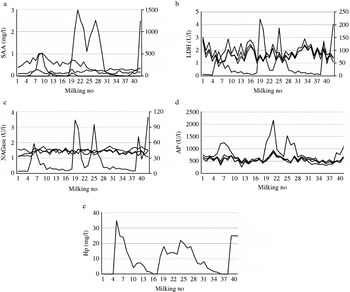
Figure 1 (a–d) shows typical profiles for the parameters analysed in cow J, with all four udder quarters included. This illustrates the observed variations between milkings for 42 consecutive milkings. In Fig. 2 (a–e) data for cow A (subclinically infected in one quarter) are presented in the same way. Owing to the magnitude of the differences in values between healthy udder quarters and the infected quarter, SAA, LDH, NAGase and SCC values are presented on a secondary y-axis for the infected udder quarter.
A typical example of profiles for some biomarkers analysed in cow J, for which all udder quarters tested bacteriologically negative during the 42 consecutive milkings (x-axis). The biomarkers analysed were: (a) serum amyloid A (SAA), (b) lactate dehydrogenase (LDH), (c) N-acetyl-β-d-glucosaminidase (NAGase) and (d) alkaline phosphatase (AP).

An example of profiles for the biomarkers analysed in cow A, for which one udder quarter tested bacteriologically positive during the 42 consecutive milkings (x-axis), while the other three udder quarters tested negative. The biomarkers analysed were: (a) serum amyloid A (SAA), (b) lactate dehydrogenase (LDH), (c) N-acetyl-β-d-glucosaminidase (NAGase), (d) alkaline phosphatase (AP) and (e) haptoglobin (Hp). Owing to large differences in magnitude between values for healthy quarters and the infected udder quarter, the values for the infected udder quarter are presented on the secondary y-axis for SAA, LDH and NAGase. Only the subclinically infected udder quarter had values above the limit of detection for Hp, therefore only one quarter is illustrated.

Discussion
The normal variations in some biomarkers, mainly evaluated as markers for mastitis, were evaluated in milk from clinically healthy udder quarters. Since udder quarters are milked individually in automated milking systems, it is important to investigate results obtained from each quarter separately, especially when evaluating udder health disturbances. Using cow composite milk samples may increase the risk that an infected quarter will be masked owing to dilution effects from the healthy quarters (Berglund et al. Reference Berglund, Petterson, Östensson and Svennersten-Sjaunja2007; Forsbäck et al. Reference Forsbäck, Lindmark-Månsson, Andrén, Åkerstedt and Svennersten-Sjaunja2009). The results presented here indicate that comparing the individual quarters within the cow can be an appropriate way to detect deviations from the normal variations between milkings.
Among the biomarkers analysed, LDH showed the lowest variation for udder quarter level comparisons within cows (8%), but also when comparing all quarters and cow composite milk samples for the nine clinically healthy cows (11%) (Table 1). When plotting the raw data it was often observed that the patterns in LDH were similar for the four udder quarters, as illustrated in Fig. 1b. The corresponding pattern for LDH was also apparent in the three healthy quarters in the subclinically infected cow, illustrated in Fig. 2b. LDH showed a low variation in mean values when comparing quarters between cows (Table 2), as well as low variations between milkings (Table 3), when the subclinically infected cow was excluded.
Relatively high variations between milkings were observed for SAA in quarter and cow composite milk samples for the nine clinically healthy cows (Table 1), but also when comparing udder quarters within each cow (Table 3). One possible explanation might be that SAA is an apolipoprotein (Westermark et al. Reference Westermark, Johnson, Westermark, Sletten and Hayden1986) and thus possibly associated with the fat phase in the milk. Milk fat can vary between 1 and 10% during milking, while the residual milk may contain as much as 20% fat (Harding, Reference Harding1995). To investigate whether SAA was associated with the fat phase, a number of milk samples were analysed as whole milk and defatted milk. The results showed a clear decrease in SAA concentration when the samples were defatted, indicating that a large proportion of the SAA in milk was associated with the fat (M Åkerstedt, unpublished data). Since fat content varies during milking, representative milk samples were collected in this study, which meant that all milk was collected from each quarter during the entire milking and a sample was taken after gently mixing the milk. The collection of milk samples in this study was performed in collaboration with another project evaluating the normal variation in different milk components, e.g. fat, protein, lactose and SCC. It was found that despite representative milk samples being collected, fat was the parameter with the highest variation (Forsbäck et al. Reference Forsbäck, Lindmark-Månsson, Andrén, Åkerstedt, Andrée and Svennersten-Sjaunja2010). Consequently, biomarkers associated with the fat phase of the milk, e.g. SAA, will probably result in higher variations between milkings and thus in practice sampling must occur more frequently.
AP was a biomarker with large differences in variations between milkings when comparing the nine clinically healthy cows as a group. Notably, AP was the only biomarker analysed in this study where no effect on variations in quarter and cow composite milk samples was observed when the subclinically infected quarter was included. It is interesting to note the great effect on mean values and variations between milkings observed for SAA, LDH and NAGase when milk from the cow with one subclinically infected quarter was commingled with milk from the nine clinically healthy cows. Evaluating fields of application for the different biomarkers included in this study was outside the scope of this paper. The results concerning the effect on mean values and variations between milkings when one infected quarter is included must be viewed with caution, since they could have been different depending on invading pathogen, severity of inflammation, etc.
In addition to cow A with its subclinically infected quarter, cow G had high SCC and the variations between quarters for this cow differed substantially for SAA, LDH, NAGase and AP compared with the other healthy cows. It is possible that this cow had a subclinical inflammation, but no infection could be observed despite daily bacteriological sampling. Conventional bacteriological sampling has been criticized for not being sufficiently sensitive and for requiring more than one bacteriological sampling to determine whether the quarter is infected (Pyörälä & Pyörälä, Reference Pyörälä and Pyörälä1997). It is therefore possible that cow G was subclinically infected but the concentration of bacteria was too low to be detected with the method used.
In the present study, SAA was generally below 1 mg/l in the clinically healthy quarters, except for cows C and G. This is in agreement with earlier studies, which suggested cut-off values between 0·8 and 1·4 mg/l to indicate an inflammatory response in quarters and in cow composite milk samples (Grönlund et al. Reference Grönlund, Hulten, Eckersall, Hogarth and Waller2003; Jacobsen et al. Reference Jacobsen, Niewold, Kornalijnslipjer, Toussaint and Gryus2005; O´Mahony et al. Reference O'Mahony, Healy, Harte, Walshe, Torgerson and Doherty2006). A probable explanation for the relatively high concentration of SAA in cow C could be lactation number, as this cow was in lactation seven. There are no earlier studies reporting changes in APP levels in healthy cows with increasing lactation number. It is thus important to point out that the variation between milkings when comparing udder quarters of cow C was one of lowest for all parameters analysed. For this reason, variation between milkings could be a more reliable way to detect deviation from normal values compared with a cut-off value. As mentioned earlier, the high SAA value in cow G could be due to subclinical inflammation.
Only the subclinically infected quarter of cow A had values >LOD for Hp and therefore variations between milkings and mean values for clinically healthy quarters could not be calculated in this study. Hiss et al. (Reference Hiss, Mueller, Neu-Zahren and Sauerwein2007) suggested that a cut-off value for Hp of 2·2–2·7 mg/l could be used to discriminate between subclinically infected and healthy quarters. Grönlund et al. (Reference Grönlund, Hulten, Eckersall, Hogarth and Waller2003) suggested a value >4·3 mg/l in quarter milk samples to detect acute chronic subclinical mastitis, while another study by Grönlund et al. (Reference Grönlund, Sandgren and Waller2005) recommended 0·3 mg/l to indicate an abnormal udder quarter. Since LOD for the method used in the present study was 1·0 mg/l, this might indicate that healthy quarters should have values below 1·0 mg/l. The greater differences for suggested cut-off values concerning Hp might be explained by different analytical methods used in different studies. In previous studies it has been demonstrated that SAA is present more often and in higher concentrations than Hp at quarter and cow level in clinically healthy cows (Grönlund et al. Reference Grönlund, Hulten, Eckersall, Hogarth and Waller2003; Åkerstedt et al. Reference Åkerstedt, Persson Waller and Sternesjö2007; Åkerstedt et al. Reference Åkerstedt, Persson Waller, Bach Larsen, Forsbäck and Sternesjö2008), a finding confirmed by the present study. In the study by Åkerstedt et al. (Reference Åkerstedt, Persson Waller and Sternesjö2007), 91% of the udder quarter samples included had Hp values below 1·0 mg/l.
There is a lack of published data concerning the normal variation in the biomarkers included in this study and no studies have investigated the variation at udder quarter level. In a study by Chagunda et al. (Reference Chagunda, Larsen, Bjerring and Ingvartsen2006b) the variation in NAGase and LDH was determined in cow composite milk from healthy and clinically mastitic cows. The variation in LDH in healthy cows was 49%, while in clinically mastitic cows it varied by 58%. For NAGase the corresponding figures were 56% and 54%, i.e. the converse of LDH. These values are substantially higher than those obtained in the present study, but it should be borne in mind that we used a statistical model which took milking and week into consideration and that we also studied the individual quarters. In the study by Chagunda et al. (Reference Chagunda, Larsen, Bjerring and Ingvartsen2006b) no statistical model was used for these calculations, and sampling of cow composite samples would therefore have been affected by the dilution effect from the other udder quarters.
Cut-off values have been discussed for different biomarkers but owing to large individual variations between animals and many animals in the grey area, it could be difficult to set a cut-off value (Holdaway et al. Reference Holdaway, Holmes and Steffert1996; Mattila et al. Reference Mattila, Pyörälä and Sandholm1986). Therefore, in agreement with Chagunda et al. (Reference Chagunda, Larsen, Bjerring and Ingvartsen2006b), we suggest the variation over time as an alternative way to detect changes in the milk. Mattila et al. (Reference Mattila, Pyörälä and Sandholm1986) recommended comparing all quarters within an udder with the lowest udder quarter value. Another problem with using a cut-off value to discriminate between healthy and infected udder quarters could be the use of methods based on different principles to determine a particular parameter, as this might give variation in the end results. Whatever the method used, several measurements over time could be a good approach as well as knowledge about the normal variation in the biomarker in clinically healthy udder quarters.
Regardless of how the biomarkers analysed in the present paper are used today and can be used in the future, there is a need for fast, robust and reliable methods for in-line detection of different biomarkers. Since dairy herd size is increasing and it is important to optimize the animal welfare situation from several perspectives, it is essential to continue evaluating the potential of different biomarkers in in-line recording.
Our results show that variations over time could be used as an alternative or in combination with a cut-off value to detect changes in the biomarkers analysed, regardless of their field of application. LDH was the biomarker with the lowest variation in this study. The mean values and variations between cows were rather wide for the biomarkers included, but comparisons of the quarters within each cow could be a reliable way to detect changes, since each cow had its own individual profile.
The authors wish to thank veterinarian Marie Boman and technician Lotta Wall at the Department of Food Science, Swedish University of Agricultural Sciences, for assistance during milk sampling, Lars-Ove Sjaunja and Dietrich von Rosen for statistical assistance and DeLaval International for providing the milking machines.