Introduction
Inhibition forms a major component of physiological processes within the brain and much of this inhibition is supplied by GABAergic neurons. The thin shell-like sheet of GABAergic cells comprising the thalamic reticular nucleus (TRN), derived from the ventral thalamus, forms an important part of this inhibitory system (for revises, see Steriade & Llinas, Reference Steriade and Llinas1988; Steriade et al., Reference Steriade, Jones and McCormick1997; Guillery et al., Reference Guillery, Feig and Lozsádi1998; Pinault, Reference Pinault2004). Although thalamic nuclei are the primary target for TRN projections, the precise functional role that TRN inhibition plays in thalamic processing remains unresolved. It has been argued that the TRN functions to reduce the firing rate of thalamic cells and thus “gate” the flow of information from the thalamus to the cortex (for references, see Yingling & Skinner, Reference Yingling and Skinner1975; Sherman & Koch, Reference Sherman and Koch1986; Steriade et al., Reference Steriade, Jones and McCormick1997) and may be involved in attentional mechanisms (Crick & Koch, Reference Crick and Koch1990; Montero, Reference Montero1997; McAlonan et al., Reference McAlonan, Cavanaugh and Wurtz2006, Reference McAlonan, Cavanaugh and Wurtz2008; Zikopoulos & Barbas, Reference Zikopoulos and Barbas2006; for other possible roles in sleep–wakefulness and epilepsy, see Raeva & Lukashev, Reference Raeva and Lukashev1993; McCormick & Bal, Reference McCormick and Bal1997; Avanzini et al., Reference Avanzini, Panzica and de Curtis2000; Pinault, Reference Pinault2004).
The TRN is customarily subdivided into sectors according to the dominant modality of the projections within a particular region of the TRN (e.g., visual, somatosensory, or auditory sectors), and these may, in some cases, be subdivided further based on first- or higher-order (Guillery & Sherman, Reference Guillery and Sherman2002) projections from thalamic nuclei or the cortex (Crabtree & Killackey, Reference Crabtree and Killackey1989; Conley & Diamond, Reference Conley and Diamond1990; Conley et al., Reference Conley, Kupersmith and Diamond1991; Crabtree, Reference Crabtree1992a ,Reference Crabtree b , Reference Crabtree1996, Reference Crabtree1998; Coleman & Mitrofanis, Reference Coleman and Mitrofanis1996; Lozsádi et al., Reference Lozsádi, Gonzalez-Soriano and Guillery1996; Kimura et al., Reference Kimura, Donishi, Okamoto and Tamai2005). It is also now clear that the arrangement is more complex than a simple model of lateral and medial tiers with segregated first- (topographic) and higher-order (loosely topographic) projections (Crabtree, Reference Crabtree1996, Reference Crabtree1998; Kolmac & Mitrofanis, Reference Kolmac and Mitrofanis1998; Pinault & Deschênes, Reference Pinault and Deschênes1998; Crabtree & Isaac, Reference Crabtree and Isaac2002; Lam & Sherman, Reference Lam and Sherman2005, Reference Lam and Sherman2007). In addition, there is ample evidence demonstrating crossmodal thalamic inhibition via the TRN (Crabtree et al., Reference Crabtree, Collingridge and Isaac1998; Crabtree & Isaac, Reference Crabtree and Isaac2002; see also Sugitani, Reference Sugitani1979; Shosaku & Sumitomo, Reference Shosaku and Sumitomo1983; Pinault & Deschênes, Reference Pinault and Deschênes1998; Kimura et al., Reference Kimura, Imbe, Donishi and Tamai2007; Lam & Sherman, Reference Lam and Sherman2007).
The visual sector of the cat’s TRN can be anatomically subdivided into a first-order region, the perigeniculate nucleus [PGN; retinotopically connected to the dorsal lateral geniculate nucleus (LGNd)], and a higher-order region consisting of the main body of the TRN [predominantly connected to higher-order thalamic nuclei such as the lateralis posterior–pulvinar complex (LP-Pul)]. Previously, we reported that axon collaterals from both striate cortex and visuotopically organized extrastriate cortices form a single, albeit, rough visuotopic map within the main body of the TRN (FitzGibbon et al., Reference FitzGibbon, Bittar and Dreher1999). In addition, area 7, a cortical area that is visually active but has only a crude visuotopic map (Heath & Jones, Reference Heath and Jones1971; Rosenquist, Reference Rosenquist, Peters and Jones1985; Ventre, Reference Ventre1985), also projects to similar regions of the TRN visual sector (FitzGibbon, Reference FitzGibbon2000).
The splenial visual area (SVA), situated between the cingulate cortex (CG) and area 17, has also been described as a visually active area but with a poorly defined visuotopic map (Kalia & Whitteridge, Reference Kalia and Whitteridge1973; Rosenquist, Reference Rosenquist, Peters and Jones1985). We used neuroanatomical tracers to ask the following questions. First, do axons from SVA make connections with the visual sector of the TRN? Second, do axons from the adjacent CG make connections to the same or different regions of the TRN?
Materials and methods
Eight adult cats (2.5–4.5 kg) were used according to previously published methods (FitzGibbon et al., Reference FitzGibbon, Bittar and Dreher1999). All experiments were conducted in accordance with the Declaration of Helsinki and according to the guidelines of the National Health and Medical Research Council of Australia and the Sydney University Animal Care and Ethics Committee. Every effort was made to minimize the number of animals. Animals were anaesthetized with sodium pentobarbitone (Nembutal, Boehringer; 30 mg/kg, i.p.) and injected with atropine sulfate (0.3 mg, i.m.; Apex Laboratories, Somersby, NSW, Australia) and dexamethasone sodium phosphate (2.5 mg, i.m., Dexapent; Troy Laboratories Pty, Glendenning, NSW, Australia) to minimize mucus secretion and brain edema, respectively. Body temperature was maintained automatically between 36° and 37°C with an electric heating blanket. The animal’s head was fixed in a stereotaxic head holder and zero power air-permeable contact lenses fitted to the eyes to protect the corneas. Bilateral craniotomies were performed to allow two cortical injections per hemisphere. Two tracers were used, 4% wheat germ agglutinin–horseradish peroxidase (WGA-HRP; Sigma-Aldrich Pty., Castle Hill, NSW, Australia) and 4% dextran–biotin (BDA; Molecular Probes, Eugene, OR), but only one type of tracer was injected per hemisphere. Injections were placed between Horsley–Clarke anterior–posterior (AP) 0.0 and 10.5, lateral 0.5 and 4.5, and dorsal 8.5 and 12. SVA extends from approximately AP −0.5 to ~8.0, lateral 3.0 to 4.5, and dorsal 10 to 12 (Rosenquist, Reference Rosenquist, Peters and Jones1985). Injections were made using iontophoresis (positive current 1–10 μA; 2–4 s ON–OFF duty cycle for 5–30 min). After survival times of 2–6 days, the animals were killed with Nembutal (60–90 mg/kg, i.p.) and perfused through the heart with 400 ml of warm 0.9% saline followed by 1 l of 4% paraformaldehyde plus 0.5% glutaraldehyde in phosphate buffer (PB, 0.1 m, pH 7.4) and then 1 l of 10% sucrose in PB. The brains were removed and placed in 30% sucrose in PB overnight before being sectioned at 50 μm in the coronal plane. Sections containing WGA-HRP were reacted with 3,3’,5,5’-tetramethylbenzidine (TMB; Sigma); sections containing BDA were incubated with ExtraAvidin (1:2000; Sigma) and reacted over ice with 3,3’-diaminobenzidine (Sigma). One series of sections was stained for acetylcholinesterase histochemistry to define nuclear boundaries within the thalamus (Graybiel & Berson, Reference Graybiel and Berson1980).
Drawings showing the location of labeled fibers and presumptive synaptic contacts were made with the aid of a camera lucida attachment and a computer-aided morphology program. After mapping the injection site, the cortical location was determined by reference to previous reports (Tusa et al., Reference Tusa, Palmer and Rosenquist1978, Reference Tusa, Palmer, Rosenquist and Woolsey1981; Raczkowski & Rosenquist, Reference Raczkowski and Rosenquist1983; Rosenquist, Reference Rosenquist, Peters and Jones1985). Regions containing labeled profiles were mapped in selected sections and the areas defined according to the nomenclature and AP coordinates in the stereotaxic atlas of Berman and Jones (Reference Berman and Jones1982).
Results
BDA or WGA-HRP injection sites (Fig. 1) were generally small and localized to the deeper layers of the cortex and did not involve the underlying white matter. BDA injections clearly gave better resolution for tracing axons within the brain, and for determining the location of axonal branches, swellings and boutons compared to TMB-reacted sections. Not all injections successfully produced usable data; therefore, the data represent a mixture of double- and single-labeled experiments. According to previous mapping studies, our injections were relatively restricted to CG or SVA and did not include area 17 (cf. Tusa et al., Reference Tusa, Rosenquist and Palmer1979, Reference Tusa, Palmer, Rosenquist and Woolsey1981; Raczkowski & Rosenquist, Reference Raczkowski and Rosenquist1983; Rosenquist, Reference Rosenquist, Peters and Jones1985).
Coronal sections through typical cortical injection sites. (A) A BDA injection site is shown within rostral cingulate cortex (CG) at an anterior-posterior level nine mm anterior to the interaural line (AP9) close to the area defined as the splenial visual area (SVA; Cat # TFG23). Note that there is a prominent connection within the CG itself from this injection site (indicated by the arrow). The open arrows indicate the edge of layer 6 and the corpus callosum (CC) is marked. The scale bar in (A) also refers to (A), (C), and (E). The approximate borders between visual striate cortex (area 17), CG, and SVA are indicated by the bars (see also Tusa et al., Reference Tusa, Palmer, Rosenquist and Woolsey1981; Rosenquist, Reference Rosenquist, Peters and Jones1985; Scannell et al., Reference Scannell, Burns, Hilgetag, O’Neil and Young1999). (B) The area of the injection site is shown at higher magnification. The arrowhead shows the path of fibers beneath the injection site within the white matter. Scale bar refers to both (B) and (D). (C) A WGA-HRP injection site within the ventromedial portion of CG (AP 5) is shown (cat # NK3). The TMB methodology causes considerably more shrinkage than the DAB process, hence, the size difference between the sections. (D) The WGA-HRP injection site is shown at higher magnification. (E) Coronal section through a caudal (AP 0) BDA injection site in SVA (cat # JY3).

Labeled BDA profiles in the TRN and thalamus
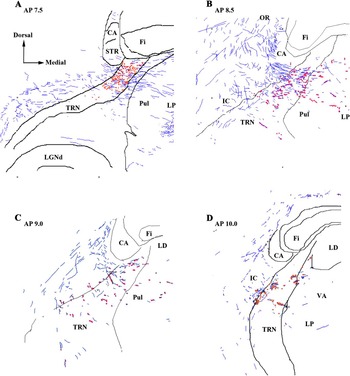
In the BDA material, axons passing through the TRN were characterized by the presence of numerous ~0.5–1.0 μm diameter axonal swellings (presumptive “en passant-” type contacts), although small boutons at the end of a short side branch or club-like endings (~0.5–2.0 μm) were also present (Fig. 2: see also Robson, Reference Paré and Smith1984; Paré & Smith, Reference Paré and Smith1996; FitzGibbon et al., Reference FitzGibbon, Bittar and Dreher1999). In some cases, both axonal swellings and boutons were present on the same fiber (Fig. 2A); labeled fibers ranged from ~0.3 to 4.5 μm, and these profiles were not observed on fibers greater than ~2.0 μm (see also Guillery et al., Reference Guillery, Feig and Van Lieshout2001; Reichova & Sherman, Reference Reichova and Sherman2004). Although electron microscopic analysis is required to unequivocally determine a synaptic status for these profiles, previous reports indicate that a large proportion of them are likely to be synaptic sites (Asanuma, Reference Asanuma1992; Lozsádi, Reference Lozsádi1994; Paré & Smith, Reference Paré and Smith1996). TRN somata are not evenly distributed in the dorsoventral axis of the TRN due to the bundles of corticothalamic and thalamocortical fibers passing through the nucleus (hence, the reticulated appearance of the TRN). Boutons and axonal swellings were not specifically concentrated in areas containing patches of somata but were scattered across cell-rich and cell-spares regions (Figs. 2 and 3). Boutons were also observed in close proximity to TRN somata (Fig. 2B) suggesting the presence of somatic contacts. Corticothalamic fibers tended to cross either at right angles to the dorsoventral/anterioposterior axes of the TRN or with a slight ventrodorsal trajectory before entering the thalamus (Fig. 3B). There were no qualitative differences between CG and SVA projections.
Terminal labeling within the TRN. (A) Presumptive contacts after a BDA injection into CG were characterized as axonal swellings (possible en passant-type contacts; arrows), small bouton-like swellings or club-like endings on short side branches (arrowheads). Although not quantified, the majority of these profiles appeared as axonal swellings. Fibers take an oblique or mediolateral path across the TRN. (B) Presumptive contacts after a BDA injection into caudal SVA. There appeared to be no qualitative difference in the contacts seen after injections within SVA compared to CG. Note the range of corticothalamic axon sizes within the TRN. The open arrow indicates the position of a TRN soma lightly stained by background labeling. The proximity of the cortical axon close to this cell is suggestive of somatic contacts via small boutons. Scale bar applies to (A) and (B).

(A) Low-power micrograph showing the location at ∼AP 7.5 of labeled terminals and fibers following a caudal BDA injection within the SVA (cat # JY3). The boxed region indicates the extent of dorsoventral labeling within the TRN. The arrowheads indicate a region of labeling between the pulvinar and lateral posterior complex. Note the more intense staining in the dorsal thalamus compared to the TRN. (B) The smaller boxed region in (A) is shown at higher magnification to illustrate the trajectory of labeled fibers (arrows) through the TRN. Cells of the TRN are not evenly distributed within the nucleus due to the bundles of corticothalamic and thalamocortical fibers passing through the nucleus and giving it a reticulated appearance. Note that labeling is not confined to cell-rich areas (*) within the borders of the TRN, although there are obvious areas of lower staining in areas of high fiber density. (C) Labeled regions within the dorsal thalamus, particularly subdivisions of the lateralis posterior complex, were characterized by areas containing heavily and lightly labeled somata (arrowheads) surrounded by corticothalamic terminal labeling. Labeled profiles were of various sizes, although the projections were predominantly of the small en passant and small bouton type (arrows). Labeling was similar to that observed after injections within area 7 (FitzGibbon, Reference FitzGibbon2000).

Previous reports have indicated that many species have mediolateral subdivisions or tiers in the TRN that are related to first- or higher-order connections (Conley & Diamond, Reference Conley and Diamond1990; Conley et al., Reference Conley, Kupersmith and Diamond1991; Crabtree, Reference Crabtree1992a ,Reference Crabtree b , Reference Crabtree1996; Lozsádi, Reference Lozsádi1994). However, the projections from CG and SVA were distributed across the full mediolateral width of the TRN and did not indicate any mediolateral organization (Fig. 4). Following small cortical injections, the numbers of boutons were also proportionately low. When dealing with low bouton numbers, this could lead to an apparent positioning bias within the TRN. Nevertheless, any bias seen in one section was not maintained in adjacent sections producing a wider overall scatter of the boutons and suggests a lack tiers within the SVA/CG projection to the TRN.
Drawings show the location of fibers (blue) and axon swellings and boutons (red) within the TRN following cortical injections of BDA. Sections were drawn using a computer-aided morphometry program and are representative of regions showing the highest density of label. (A) Labeling in TRN at AP 7.5 following an injection within SVA at AP 0.0. (B) Labeling in TRN at AP 8.5 following an injection within SVA at AP 6.0. (C) Labeling in TRN at AP 9.0 following a relatively small injection within SVA at AP 8.5. (D) Labeling in TRN at AP 10.0 following a small injection within CG at AP 9.0. Abbreviations: CA, caudate nucleus; Fi, fimbria; IC, internal capsule; LGNd, dorsal lateral geniculate nucleus; LD, lateral dorsal nucleus; LP, nucleus lateralis posterior; OR, optic radiation; Pul, pulvinar nucleus; STR, stria terminalis; VA, ventroanterior nucleus.

Terminal labeling within the thalamus was characterized by numerous axonal swellings (en passant contacts) and small terminal boutons. Large boutons forming grape-like clusters were also evident in the thalamus (Robson, Reference Paré and Smith1984; Paré & Smith, Reference Paré and Smith1996; Guillery et al., Reference Guillery, Feig and Van Lieshout2001; for primates, see Rockland, Reference Rockland1996; Zikopoulos & Barbas, Reference Zikopoulos and Barbas2006; for rat, see Pinault, Reference Pinault2004;) but were not seen in the TRN. The densities of boutons, axon swellings, and terminal branches were clearly higher in thalamic areas compared with labeling observed in the TRN (Fig. 3).
Topography of labeled cortical profiles in the TRN
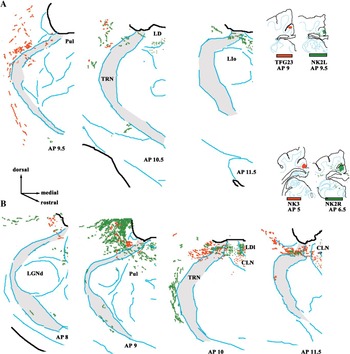
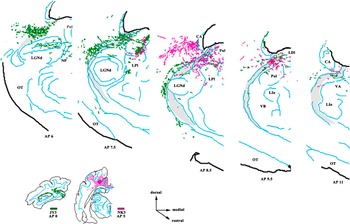
The locations of axons, boutons, and swellings within the TRN were plotted after BDA injections into SVA or CG (see Figs. 4–6), whereas the locations of labeled axons and presumptive terminal fields were plotted after WGA-HRP injections. Previous reports have shown that location of labeled axons following WGA-HRP or BDA injections provides an accurate picture of the overall projection zone within the TRN (Figs. 5 and 6), such that a certain proportion of labeled axons throughout the projection zone are accompanied by boutons (BDA labeling). WGA-HRP injections provide sufficient detail to define the projection zone due to axonal labeling and may result in localized areas of higher density labeling; however, separating axonal labeling from terminal labeling in the TRN can be problematic. Therefore, BDA labeling has been used to determine the distribution of boutons within the TRN (Fig. 4). SVA and CG injections resulted in labeled TRN regions between ∼AP 6.0 and ∼AP 12.0 (i.e., extending from the rostral pole of the LGNd to the caudal aspect of the ventral anterior (VA) nucleus). Labeled profiles were largely confined to the dorsal half of the TRN (i.e., regions adjacent or dorsal to the LGNd), and labeling was particularly prominent in the rostral TRN regions close to the ventricles. Only a weak topographic organization was apparent with respect to the injection sites. Generally, a caudal to rostral shift of the injection site produced a similar caudal to rostral shift in the focus of labeled profiles. Medial to lateral shifts of the injection site within CG produced very little, if any, evidence for a mediolateral organization. The distribution of SVA contacts (cf. Figs. 5 and 6) overlapped those of the CG; the only difference being a tendency to have a greater dorsoventral spread in parts of the caudal TRN adjacent to the Pulvinar (Pul). Caudal injection sites labeled regions that tended to extend more ventrally within the TRN compared with rostral injection sites.
Four separate injections are illustrated to show the distribution of labeled profiles with the TRN. Injections from rostral (A) and caudal (B) parts of CG can be compared. Sections were drawn, and then, the labeled distributions superimposed on sections at the same AP plane. The boundaries of the TRN are indicated by the shaded area. Drawings show the location of both labeled fibers and boutons. Previous reports have shown that location of labeled axons provides an accurate picture of the projection zone within the TRN when compared to plots of the boutons seen in BDA-labeled sections. Note that sections from rostral and caudal cat # NK2W (A and B, respectively) were taken from injections in opposite hemispheres. The drawings have been orientated for ease of comparison. Small injections such as that in cat # TFG23B tended to result in relatively light labeling in the TRN and thalamus. Abbreviations: CLN, central lateral nucleus; LIo, pars oralis of the intermediate nucleus of the lateral group; LPI, lateral division of the nucleus lateralis posterior.

Rostral and caudal injections within the SVA can be compared after overlapping the distribution of labeled profiles within the TRN. Note that the TRN labeling from the caudal SVA injection tends to spread more ventrally within the TRN compared to the rostral SVA injection, but both injection sites label the rostrodorsal aspect of the TRN. Abbreviations: NP, posterior nucleus of Rioch; OT, optic tract; VB, Ventrobasal complex.

Discussion
Organization of CG/SVA projections to TRN
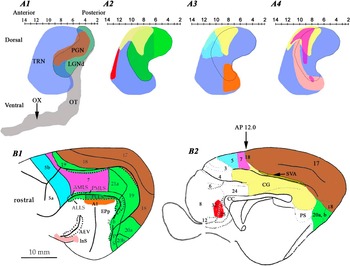
Our results show that CG and SVA project to the same area of the TRN, and that this projection zone partially overlaps dorsorostral areas of the larger projection zone defined by visuocortical input (Fig. 7A2). The projection zone also extends to more rostral parts of the TRN that receive information from cortices traditionally classified as nonvisual, for example, area 5 (Fig. 7A3; Robertson & Cunnigham, Reference Robertson and Cunningham1981). The location of the CG/SVA projection within the TRN is in general agreement with previous autoradiographic results (Kaitz & Robertson, Reference Kaitz and Robertson1981), although earlier schematic figures show a more localized projection compared to the more extensive projection zone seen with BDA. The rostrocaudal extent of CG/SVA is only roughly mapped along the rostrocaudal axis of the TRN and is similar to the crude maps described for area 7 (Fig. 7A4; FitzGibbon et al., Reference FitzGibbon, Bittar and Dreher1999; FitzGibbon, Reference FitzGibbon2000).
Summary schematic diagram to illustrate cortical projections zones within the TRN. Sagittal sections of the TRN were traced (Berman & Jones, Reference Berman and Jones1982), and the AP and dorsoventral extent of the TRN reconstructed (light blue in A1–A4; viewed from the side); the LGNd (dark green with outline in A1) and optic tract (gray) and position of the chiasm are shown for additional reference points. Each colored region represents a different cortical projection zone (note that some regions overlap resulting in a mixed color). The cortices projecting to these regions are similarly colored in the lateral (B1) and medial (B2) views of the cortex. The projection to the PGN (brown in A1) constitutes the first-order region of the TRN and receives prominent projections from primary visual cortex (areas 17 and 18). The TRN also receives projections from striate cortex in addition to a number of other higher-order visuotopically organized cortices (green, A2 and outlined in A3 and A4; the colors are partially overlapped by areas 17 and 18 in B). The projection from CG/SVA (yellow) is shown in A2–A4 for comparison with other projections zones. Note the extensive overlap of CG/SVA with area 5–7 but lack of overlap with rostroventral cortical areas associated with visual tasks. The higher-order visuotopically organized cortices of the suprasylvian area have a more rostrally placed projection zone within the TRN visual sector and overlap nonvisual projections (e.g., auditory area A1; A3). The location of the projection zones was deduced from figures found in previous reports (Jones, Reference Jones1975; Kaitz & Robertson, Reference Kaitz and Robertson1981; Robertson & Cunnigham, Reference Robertson and Cunningham1981; Room et al., Reference Room, Russchen, Groenewegen and Lohmann1985; Yen et al., Reference Yen, Conley, Hendry and Jones1985; Crabtree, Reference Crabtree1992 a, Reference Crabtree1996, Reference Crabtree1998; Bajo et al., Reference Bajo, Rouiller, Welker, Clarke, Villa, Deribaupierre and Deribaupierre1995; Clascá et al., Reference Clascá, llamas and Reinoso-Suárez1997; FitzGibbon et al., Reference FitzGibbon, Bittar and Dreher1999; FitzGibbon, Reference FitzGibbon2000). Abbreviations: AEV, anterior ectosylvian sulcus; DLS, dorsal suprasylvian areas; VLS, ventral suprasylvian areas; EPp, posterior part of posterior ectosylvian gyrus; InS, insular cortex; PS, posterior suprasylvian area; AMLS, anteriomedial lateral suprasylvian area; ALLS, anteriolateral lateral suprasylvian area; PMLS, posteriomedial lateral suprasylvian area; PLLs, posteriolateral lateral suprasylvian area; PS, posterior suprasylvian area; Ps, postsubicular area (for references, see Scannell et al., Reference Scannell, Burns, Hilgetag, O’Neil and Young1999).

The anatomical nature of the CG/SVA profiles indicates that this input arises from layer VI and is thus a “modulator” rather than a “driver” of the TRN (Sherman & Guillery, Reference Sherman and Guillery1998; see also Guillery et al., Reference Guillery, Feig and Van Lieshout2001; Gentet & Ulrich, Reference Gentet and Ulrich2004; Reichova & Sherman, Reference Reichova and Sherman2004; Lam & Sherman, Reference Lam and Sherman2007; but cf. Montero, Reference Montero1999). Zikopoulos and Barbas (Reference Zikopoulos and Barbas2006) have shown that projections from frontal cortices to the TRN in primates contains a mixture of large and small synaptic boutons. This could indicate that the TRN receives some layer V input (a driver) and thus casts doubt on the assumption that only cortical layer VI projects to the TRN.
CG/SVA does not appear to target-specific TRN tiers (cf. Conley & Diamond, Reference Conley and Diamond1990; Conley et al., Reference Conley, Kupersmith and Diamond1991; Crabtree, Reference Crabtree1992 a, Reference Crabtree1996, Reference Crabtree1998; Lozsádi, Reference Lozsádi1994; Lozsádi et al., Reference Lozsádi, Gonzalez-Soriano and Guillery1996; Kimura et al., Reference Kimura, Donishi, Okamoto and Tamai2005) and in this respect is similar to projections from area 7 (FitzGibbon et al., Reference FitzGibbon, Bittar and Dreher1999; FitzGibbon, Reference FitzGibbon2000). This seems to be in marked contrast to insular and anterior sylvian cortical projections that target specific mediolateral TRN tiers that are rostroventral to the CG/SVA projection zone (Clascá et al., Reference Clascá, llamas and Reinoso-Suárez1997).
CG/SVA, thalamus, and TRN sectors
The cat’s posterior CG, although not visutopically organized (Kalia & Whitteridge, Reference Kalia and Whitteridge1973), has extensive connections with multiple visual cortices (Symonds & Rosenquist, Reference Symonds and Rosenquist1984; Rosenquist, Reference Rosenquist, Peters and Jones1985; Olson & Musil, Reference Olson and Musil1992; for references, see Scannell et al., Reference Scannell, Burns, Hilgetag, O’Neil and Young1999). Olson and Musil (Reference Olson and Musil1992) indicated that the major connections to posterior CG arise from frontal (36%), visual (30%), anterior cingulate (16%), and parahippocampal (14%) cortices. They proposed that CG could be subdivided into somatic, ocular, and complex subregions. The thalamus and CG have a crude topographic relationship (caudal CG to mediodorsal thalamus, rostral CG to ventrorostral thalamus; for details, see Kaitz & Robertson, Reference Kaitz and Robertson1981; Robertson & Kaitz, Reference Robertson and Kaitz1981; Niimi et al., Reference Niimi, Niimi, Matsuoka, Yanagihara and Katayama1983; Raczkowski & Rosenquist, Reference Raczkowski and Rosenquist1983; Room et al., Reference Room, Russchen, Groenewegen and Lohmann1985; Olson & Musil, Reference Olson and Musil1992; Rodrigo-Angulo & Reinoso-Suarez, Reference Rodrigo-Angulo and Reinoso-Suarez1995), and this organization also appears to be reflected in the rostrocaudal connections with the TRN (rostral TRN–intralaminar complex; dorsocaudal TRN–LP-Pul complex; Jones, Reference Jones1975; Steriade et al., Reference Steriade, Parent and Hada1984; Rodrigo-Angulo & Reinoso-Suárez, Reference Rodrigo-Angulo and Reinoso-Suárez1988; FitzGibbon, Reference FitzGibbon1994; FitzGibbon et al., Reference FitzGibbon, Tevah and Sefton1995; Sakoda et al., Reference Sakoda, Kimura, Donishi, Kitano and Tamai2004).
Can CG/SVA affect auditory function via the TRN?
Based on anatomical studies, one could argue that, at least in the cat, CG may be more closely associated with visual than auditory processing. This is also reflected in the projections from CG/SVA to the TRN regions that predominately project to nuclei associated with visual or visuomotor processing (e.g., LP-Pul and intralaminar complexes; FitzGibbon, Reference FitzGibbon1994; FitzGibbon et al., Reference FitzGibbon, Tevah and Sefton1995). Nevertheless, CG/SVA/TRN may affect auditory processing via connections with thalamic areas such as the medial division of the lateralis posterior nucleus and the medial division of the lateralis suprageniculate nucleus that have marked multimodal responses (Norita et al., Reference Norita, Mucke, Benedek, Albowitz, Katoh and Creutzfeldt1986; Benedek et al., Reference Benedek, Perény, Kovács, Fischer-Szátmári and Katoh1997; Sakoda et al., Reference Sakoda, Kimura, Donishi, Kitano and Tamai2004). Anatomical and physiological studies have shown that there is a lack of strict reciprocity between cells of the TRN and the thalamus creating the possibility for a number of “open loops” (Rodrigo-Angulo & Reinoso-Suárez, Reference Rodrigo-Angulo and Reinoso-Suárez1988; FitzGibbon, Reference FitzGibbon1994; FitzGibbon et al., Reference FitzGibbon, Tevah and Sefton1995; Deschênes et al., Reference Deschênes, Veinante and Zhang1998; Kolmac & Mitrofanis, Reference Kolmac and Mitrofanis1998; Pinault & Deschênes, Reference Pinault and Deschênes1998; Crabtree & Isaac, Reference Crabtree and Isaac2002; Gentet & Ulrich, Reference Gentet and Ulrich2003; Pinault, Reference Pinault2004; Kimura et al., Reference Kimura, Imbe, Donishi and Tamai2007; Lam & Sherman, Reference Lam and Sherman2007), which can initiate crossmodal inhibition or modulation between different thalamic nuclei (Crabtree & Isaac, Reference Crabtree and Isaac2002). Interestingly, insular cortex and the anterior ectosylvian sulcus, considered to be an extrastriate visual or auditory–visual field (for references, see Norita et al., Reference Norita, Mucke, Benedek, Albowitz, Katoh and Creutzfeldt1986; Clascá et al., Reference Clascá, llamas and Reinoso-Suárez1997; Scannell et al., Reference Scannell, Burns, Hilgetag, O’Neil and Young1999), have projection zones in the TRN that differ from the projections zones of the striate visual cortices and CG/SVA (cf. FitzGibbon et al., Reference FitzGibbon, Bittar and Dreher1999; FitzGibbon, Reference FitzGibbon2000; Clascá et al., Reference Clascá, llamas and Reinoso-Suárez1997). It would be of interest to determine if the CG targets auditory sectors of the TRN at the expense of the visual sector in animals, such as bats, that are highly dependent on a different modality for orientation.
Functional considerations
Posterior CG may be involved in processes that depend on the integration of hippocampal output (via anterior thalamic nuclei) and sensory information, in particular, the involvement of spatial orientation and memory (monkeys, Murray et al., Reference Murray, Davidson, Gaffan, Olton and Suomi1989; rats, Sutherland et al., Reference Sutherland, Whishaw and Kolb1988; Cooper et al., Reference Cooper, Manka and Mizumori2001). Area 7 has strong reciprocal connections with CG/SVA (Joseph & Giroud, Reference Joseph and Giroud1986; Olson & Lawler, Reference Olson and Lawler1987; Olson & Musil, Reference Olson and Musil1992; for functions, see Ventre, Reference Ventre1985; Joseph & Giroud, Reference Joseph and Giroud1986) and has a TRN projection zone that overlaps that formed by the CG/SVA (Fig 6A4). The LP-Pul complex, which also has connections with the CG/SVA projection zone in the TRN, is also an area of multimodal convergence and may play a role in eye movement and orientation, visual salience, and attention (Avanzini et al., Reference Avanzini, Broggi, Franceschetti and Spreafico1980, Reference Avanzini, Panzica and de Curtis2000; Motles et al., Reference Motles, Ely and Elazar1980; Shumikhina & Maiskii, Reference Shumikhina and Maiskii1991; Robinson & Petersen, Reference Robinson and Petersen1992; Shipp, Reference Shipp2004).
The CG/SVA, in combination with area 7, may provide an important element of behavioral relevance to thalamic function (eye movement/orientation). Previous work (cf. Zhang & Jones, Reference Zhang and Jones2003; Deleuze & Huguenard, Reference Deleuze and Huguenard2006; Lam et al., Reference Lam, Nelson and Sherman2006) suggests two possibilities concerning the effect of CG/SVA input to TRN. On the one hand, CG/SVA may initiate a spread of inhibition to the adjacent visual and somatic recipient zones of the TRN causing disinhibition of visually related regions of the thalamus prior to affecting auditory regions. On the other hand, CG/SVA effects may remain highly localized within the TRN and enhance signal-to-noise ratios or sharpen sensory processing (Funke & Eysel, Reference Funke and Eysel1998; Lam & Sherman, Reference Lam and Sherman2005) in a small subset of thalamic cells or areas tuned to visual orientation-specific tasks (Motles et al., Reference Motles, Ely and Elazar1980).
Acknowledgments
This work was supported by the National Health and Medical Research Council of Australia and The Sydney Foundation for Medical Research. The authors would like to thank B. Dreher for his support.