1 Introduction
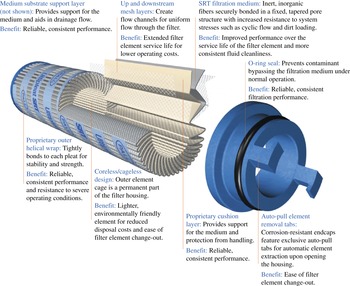
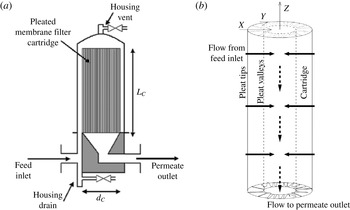
Pleated membrane filter cartridges are used in a wide variety of applications to remove particles and undesired impurities of a certain size range from a fluid. A typical filter design is shown in figure 1: a membrane filter (with pore size chosen depending on the particular application) is sandwiched between two, much more porous, support layers. The resulting three-layer structure is pleated and packed into an annular cylindrical cartridge with mesh walls. This arrangement is placed within a larger impermeable housing and attached to a feed supply pump (figure 2), which forces the feed solution through the cartridge from the outer to the inner wall. This design has the advantage that a large filtration surface area can be confined to a small volume, allowing for rapid filtration. However, filtration performance, as measured by flux processed for a given pressure drop, is inferior when compared to the equivalent-area flat (non-pleated) membrane in dead-end filtration. The precise reasons for this difference in performance have so far proved elusive, and are likely to involve several factors: for example, the porous support layers that surround the pleated membrane add resistance, which increases as the pleat packing density (PPD) within the cartridge increases; the fluid dynamics through the pleated structure are much more complex than in dead end (unidirectional) filtration through a non-pleated filter; and the membrane filter itself may become damaged during the process of pleating. Recent studies have focused mainly on elucidating, empirically, how filter cartridge performance scales with any given factor such as PPD; see e.g. Kumar (Reference Kumar2009), Giglia et al. (Reference Giglia, Rautio, Kazan, Backes and Blanchard2010), Brown (Reference Brown2011a ,Reference Brown b ), Kumar, Martin & Kuriyel (Reference Kumar, Martin and Kuriyel2015). In this paper we focus on the fluid-dynamical aspects of filtration, in particular: how the pleated geometry affects fluid flow through the filter; how particles carried by the flow are deposited on and within the filter membrane; and how this fouling affects the total flux through the filter (and hence its performance).
Typical geometry of a pleated membrane filter cartridge. Reproduced, with permission, from Pall’s Power Generation Catalog (Pall 2013).

(a) (From Brown et al.
Reference Brown, Levison, Titchener-Hooker and Lye2009, reproduced with permission.) Schematic showing the external housing and pleated filter cartridge within it. (b) Idealization of the pleated filter cartridge geometry, indicating also the coordinates used in the model (
 $X$
is measured in the inward radial direction, while
 $Y$
is arc length along the outer cylinder boundary, measured as indicated).

During membrane filtration the pores of the membrane become fouled with impurities, which are carried by the feed solution. Filter performance thus ultimately deteriorates, via a combination of mechanisms. (i) Particles smaller than the membrane pore size are deposited (or adsorbed) within the pores, shrinking the pore diameter and increasing membrane resistance. (ii) Particles larger than the pores cannot pass through the membrane. Assuming that such particles follow streamlines (large particle Péclet number, leading to passive advection), they will be sieved out and deposited on top of pores, blocking them. (iii) Once pores are blocked in this way, in the late stages of filtration, larger particles can form a cake on top of the membrane, adding additional resistance via another porous layer on top. By the time this stage is reached the filtration is very inefficient due to the high resistance, and filters are normally discarded (or cleaned) before significant caking has occurred. Mathematical models for all three fouling mechanisms have been proposed, mostly based on empirical laws of how membrane resistance relates to total volume processed, or net flow rate through the membrane, in the different fouling regimes (see, for example, Bolton, Boesch & Lazzara Reference Bolton, Boesch and Lazzara2006; Bolton, Lacasse & Kuriyel Reference Bolton, LaCasse and Kuriyel2006; Meng et al. Reference Meng, Chae, Drews, Kraume, Shin and Yang2009; Daniel et al. Reference Daniel, Billing, Russell, Shimskey, Smith and Peterson2011; Giglia & Straeffer Reference Giglia and Straeffer2012; van der Sman et al. Reference van der Sman, Vollebregt, Mepschen and Noordman2012, among many others). In this paper we take a different approach that carefully accounts for the fluid dynamics induced by the pleat geometry and couples the fluid dynamics to a first-principles model for fouling (via adsorption (i) and blocking (ii)).
An important early paper on mathematical modelling of filtering problems is the work by King & Please (Reference King and Please1996). This paper makes use of approaches that are similar in spirit to ours. These authors also consider flow through a two-dimensional pleated filter, and exploit (as we do) the small aspect ratio of the pleat to simplify the fluid dynamics and fouling problems. The work differs from ours in several key respects however. First, there is no porous support material separating the pleats in that paper, so that flow between the pleats is modelled as Stokes flow rather than Darcy flow. Second, fouling of the pleated filter is assumed to occur only via the caking referred to in (iii) above (in the applications we consider this to be the ‘end stage’ of the fouling process, when the filter is nearing the end of its useful life). A primary focus of King & Please (Reference King and Please1996) is tracking and analysing mathematically the cake boundary as it builds up. Once cake has formed on the filter surface, that part of the filter admits no flux through it, in contrast to our model, where blockage of a pore simply increases the resistance locally. Thirdly, the work of King & Please (Reference King and Please1996) focuses on the case of a constant prescribed flux, whereas we consider the case of flow driven by a constant pressure drop, so that as fouling occurs, the flux through our filter drops to zero. While the geometry of our filtering problem corresponds to that of King & Please (Reference King and Please1996), our formulation was done independently of their paper and for completeness we provide all details of the derivation of our model.
This paper is laid out as follows: in § 2 we develop a mathematical model for the flow through a pleated sandwich of membrane filter and porous support layers. We consider the case of high PPD, using an asymptotic approach to exploit both the small aspect ratio of a pleat and the thinness of the membrane relative to the support layers. The model contains the membrane permeability
 $K_{m}(\boldsymbol{X};T)$
, which evolves as a function of space and time. Initially this is constant, but as particles are deposited on and within the membrane, spatial variation develops according to our proposed membrane fouling model. The model we develop has several different features: we illustrate these by means of representative solutions, and we compare the pleated filter with the closest equivalent flat (non-pleated) filter, in § 3. In order to make a meaningful comparison, and to identify the performance difference due to the pleated geometry, we compare to a flat filter surrounded by the same thickness of support material as the pleated filter (details of the solution for this simple one-dimensional model are included in appendix A). We conclude with a discussion in § 4.
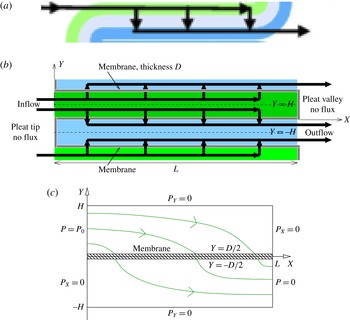
(a) Section of the pleated geometry, which is repeated periodically (adapted from Giglia et al.
Reference Giglia, Rautio, Kazan, Backes and Blanchard2010). The
 $Z$
-axis in figure 2(b) is here perpendicular to the page. Green/blue correspond to support layers exterior/interior to the annulus; grey represents the membrane filter (in reality much thinner than the support layers), and the heavy black arrows indicate the flow direction. (b) Idealized membrane geometry to be considered in our model. Symmetry lines (dashed) are located at
 $Y=\pm H$
, and the straight portion of the pleat occupies
 $0\leqslant X\leqslant L$
. (c) The problem domain and boundary conditions at inlet and outlet. Some schematic flow streamlines are also shown.

2 Mathematical modelling
2.1 Modelling assumptions: outline
The geometry of a cylindrical pleated membrane filter cartridge is sketched in figures 1 and 2 and described in the Introduction. Figure 2(b) also introduces the coordinates that will be used in this paper: the
 $Z$
-direction is along the cylinder’s axis, the
 $X$
-direction is radially inwards measured from the cartridge outer wall, and
 $Y$
is arc length around the outer cylinder boundary, measured as indicated. We idealize the rather complicated flow scenario depicted in figure 2 in several ways. We assume there is no variation in the
 $Z$
-direction, and that all pleats are identical. This justifies our considering flow confined to a cross-section at constant
 $Z$
, within a single pleat, which we assume to be part of a periodic array (periodic in arc length
 $Y$
). We simplify further by neglecting the curvature of the cylindrical cartridge, considering instead one section of a linear periodic array in rectangular Cartesian
 $(X,Y)$
-coordinates. We restrict our attention to the case of tightly packed pleats, as shown in figure 3(a). In this situation, the length
 $L$
of the pleat (from outer to inner cartridge boundary;
 $X$
-direction in figures 2
b and 3
b) is much greater than the pleat thickness (the thickness of support layers plus membrane in the
 $Y$
-direction), so that the vast majority of the flow through the pleat is expected to pass through the pleat length rather than its ends. This observation suggests neglecting the flow through the ends of the pleats (the pleat tips and valleys) as being negligible relative to the flow through the straight section of the membrane (the section parallel to the
 $X$
-axis). With this in mind, we make our final simplification, idealizing the pleat geometry to be rectangular and imposing no-flux conditions at pleat tips and valleys where shown in figure 3(b). This simplification is justified further: (i) by noting that the high membrane curvature in the pleat tips and valleys is likely to lead locally to very low membrane permeability and high resistance to flow (particularly on the inside of the tight curve); and (ii) by limited experimental data (Fotovati et al.
Reference Fotovati, Hosseini, Vahedi Tafreshi and Pourdeyhimi2011) on filters subjected to dust-laden air and then analysed, which indicate little or no dust particle deposition at the actual fold locations.
The sketches in figures 3(b) and 3(c) summarize the simplified flow problem to be solved. Figure 3(b) clarifies how the pleat geometry of 3(a) is idealized (the same colour coding is used to distinguish between inflow and outflow sides of the membrane), while figure 3(c) shows the solution domain, with the boundary conditions to be applied on the pressure. The flow region considered is from the lower to the upper periodicity boundary (the dashed symmetry lines in figure 3
b):
 $-H\leqslant Y\leqslant H$
, and from
 $X=0$
to
 $X=L$
along the membrane, with the membrane itself occupying region
 $-D/2\leqslant Y\leqslant D/2$
,
 $0\leqslant X\leqslant L$
(hatched region in figure 3
c). Our small aspect ratio assumptions, to be discussed further below, are represented by the dimensionless parameters
 ${\it\epsilon}=H/L\ll 1$
,
 ${\it\delta}=D/H\ll 1$
. Figures 3(b) and 3(c) also indicate the inflow and outflow, the no-flux boundaries at the pleat valley (
 $X=L$
,
 $0\leqslant Y\leqslant H$
) and tip (
 $X=0$
,
 $-H\leqslant Y\leqslant 0$
), and the symmetry conditions at the support layer mid-surfaces (
 $Y=\pm H$
). In general throughout this paper we use upper-case characters to denote dimensional variables, while the lower-case equivalent will be dimensionless.
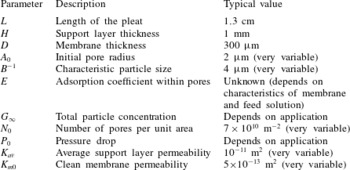
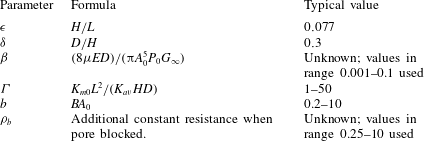
Approximate dimensional parameter values (A. Kumar, 2014, Private communication).

The tight packing means that the whole flow domain considered is occupied by porous medium (support layer or membrane), within which Darcy flow of an incompressible Newtonian feed solution, viscosity
 ${\it\mu}$
, is assumed, with velocity
 $\boldsymbol{U}=(U,V)$
and pressure
 $P$
. We assume the feed solution to be a dilute suspension of particles, which are advected passively through the support layers. The permeabilities of support layers and membrane are
 $K$
,
 $K_{m}$
, respectively, with
 $K_{m}/K\ll 1$
in accordance with data for real filter cartridges (see table 1). We allow support layer permeability
 $K$
to vary along the pleat, but assume it is symmetric above and below the membrane. For the most part we assume that
 $K$
varies only in the coordinate
 $X$
along the pleat,
 $K(X)$
; the case of permeability that can vary also in the
 $Y$
-direction,
 $K(X,Y)$
, is discussed briefly in § 2.3.1. (Note that, due to the annular configuration of the cartridge, the valley ends of pleats will be more compressed than the tip ends, leading to lower permeability at the valleys; see figures 1 and 2.) In general
 $K_{m}$
will vary in both space and time as membrane fouling occurs, with the variation in time being quasi-static:
 $K_{m}(X,T)$
. (We do not account for any fouling of the support layers, which are not designed to capture particles: the pores of these layers are very much larger than those of the membrane filter.) The time evolution of the membrane permeability similarly induces time variation into the solution for the pressure and fluid velocity within the pleat. However, since no explicit time-dependence appears in the Darcy flow model, we will mostly suppress the time dependence to simplify notation, writing
 $K_{m}(X)$
,
 $P(X,Y)$
, etc. This (quasi-static) assumption that only the dynamics of membrane fouling need explicit consideration amounts to an assumption (borne out by data) that fouling occurs on a time scale long compared with that of fluid transit time across the pleated cartridge.
To arrive at a tractable fouling model we consider a membrane composed of an identical array of uniformly distributed cylindrical pores of radius
 $A(T)$
. Within our model, membrane resistance is assumed to increase in time due to fouling by two mechanisms: (i)
 $A(T)$
decreases in time due to adsorption of tiny particles within the pores; and (ii) pores become blocked from above by particles too large to pass through pores. In order to model (ii) we monitor
 $N(X,T)$
, the number of unblocked pores per unit area of membrane. Again, we will mostly suppress the time-dependence here to simplify notation, writing just
 $A$
and
 $N(X)$
. Membrane permeability will be expressed as a function of both
 $A$
and
 $N$
.
2.2 Governing equations
The feed is assumed to be a dilute suspension of particles, which do not affect the fluid dynamics directly (though they do have an indirect effect via the fouling, which results in increased system resistance). We therefore use a single-phase model, in which Darcy velocity
 $\boldsymbol{U}=(U,V)$
within the support layers is given in terms of the pressure
 $P(X,Y)$
by
 $$\begin{eqnarray}\displaystyle \boldsymbol{U}=(U,V)=-\frac{K}{{\it\mu}}\boldsymbol{{\rm\nabla}}P,\quad \boldsymbol{{\rm\nabla}}=(\partial _{X},\partial _{Y}). & & \displaystyle\end{eqnarray}$$
Incompressibility of the feed solution requires
 $$\begin{eqnarray}\displaystyle \boldsymbol{{\rm\nabla}}\boldsymbol{\cdot }\boldsymbol{U}=0\quad \Rightarrow \quad \boldsymbol{{\rm\nabla}}\boldsymbol{\cdot }(K\boldsymbol{{\rm\nabla}}P)=0, & & \displaystyle\end{eqnarray}$$
within the support layers. As discussed in § 2.1 above, we assume that the flow is driven by an imposed pressure difference,
 $P_{0}$
, across the pleated membrane and that there is no flux through the pleat valley on the inflow side and the pleat tip on the outflow side, and we impose symmetry across the support layer centrelines
 $Y=\pm H$
(see figure 3). Hence, we impose boundary conditions
 $$\begin{eqnarray}\displaystyle P^{+}(0,Y)=P_{0},\quad P_{X}^{+}(L,Y)=0,\quad P_{Y}^{+}(X,H)=0, & & \displaystyle\end{eqnarray}$$
 $$\begin{eqnarray}\displaystyle P_{X}^{-}(0,Y)=0,\quad P^{-}(L,Y)=0,\quad P_{Y}^{-}(X,-H)=0, & & \displaystyle\end{eqnarray}$$
where we use
 $\pm$
superscripts to distinguish between quantities evaluated in
 $Y\gtrless 0$
respectively, on either side of the membrane. For most of our simulations we take
 $P_{0}$
to be a specified constant, reflecting flow driven by a fixed pressure drop between inlet and outlet; but we will also present some results for fixed-flux scenarios, where
 $P_{0}$
increases in time in order to maintain the same flux as the system resistance increases due to fouling (see § 2.3.4).
Similar to (2.1) we also assume Darcy flow across the membrane, which is itself a porous medium, though much less permeable than the support layers. We are primarily concerned with the flux,
 $V_{m}$
, per unit area across the membrane in the
 $Y$
-direction. Anticipating in advance the fact that the pressure within the membrane will be independent of the coordinate
 $Y$
perpendicular to the membrane (due to the small aspect ratio
 $D/L={\it\epsilon}{\it\delta}\ll 1$
), and given that the pressure is continuous across the interface between the membrane and support layers, the vertical pressure gradient within the membrane may be written, correct to leading order in
 ${\it\epsilon}{\it\delta}$
, as
 $(P^{+}|_{Y=D/2}-P^{-}|_{Y=-D/2})/D$
. The Darcy law for the flow through the membrane then gives
 $$\begin{eqnarray}\displaystyle |V_{m}|=\frac{K_{m}}{{\it\mu}D}[P^{+}|_{Y=D/2}-P^{-}|_{Y=-D/2}],\quad 0\leqslant X\leqslant L, & & \displaystyle\end{eqnarray}$$
where, by continuity of flux,
 $|V_{m}(X)|=|V(X,D/2)|=|V(X,-D/2)|$
(with
 $V$
as defined in (2.1)),
 $$\begin{eqnarray}\displaystyle |V_{m}|=\frac{K}{{\it\mu}}\frac{\partial P^{+}}{\partial Y}\bigg|_{Y=D/2}=\frac{K}{{\it\mu}}\frac{\partial P^{-}}{\partial Y}\bigg|_{Y=-D/2},\quad 0\leqslant X\leqslant L. & & \displaystyle\end{eqnarray}$$
The total flux through the membrane,
 $Q$
(per unit length along the axis of the cartridge), which will be an important performance characteristic in our simulations, is defined by
 $$\begin{eqnarray}\displaystyle Q=\int _{0}^{L}|V_{m}|\,\text{d}X=\int _{0}^{L}\frac{K}{{\it\mu}}\left.\frac{\partial P^{+}}{\partial Y}\right|_{Y=D/2}\,\text{d}X. & & \displaystyle\end{eqnarray}$$
Membrane permeability
 $K_{m}$
changes, over time scales long compared to the fluid transit time, due to pore shrinkage (arising from particle adsorption) and to blocking of pores by large particles. We now consider these fouling phenomena in more detail. We assume that membrane pores are long thin cylindrical tubes, of length
 $D$
and radius
 $A(T)$
, spanning the membrane, which initially all have the same radius,
 $A(0)=A_{0}$
. A more sophisticated model would allow for non-uniform shrinkage of pores due to the adsorption, but in our simple model we assume uniform adsorption, so that the pore radius does not vary spatially. Where an individual pore (at position
 $X$
and time
 $T$
) is unblocked the total flux through it
 $Q_{u,pore}(X,T)$
is given (approximately) by the Hagen–Poiseuille formula
 $$\begin{eqnarray}\displaystyle Q_{u,pore}=\frac{1}{R_{u}}(P^{+}|_{Y=D/2}-P^{-}|_{Y=-D/2})\quad \text{where }R_{u}=\frac{8{\it\mu}D}{{\rm\pi}A^{4}}, & & \displaystyle\end{eqnarray}$$
and
 $R_{u}$
is the pore resistance. Blocking occurs when a large particle becomes trapped at the entrance to a pore, obstructing the flow. We model this effect by adding an extra resistance of magnitude
 $8{\it\mu}D{\it\rho}_{b}/({\rm\pi}A_{0}^{4})$
, where
 ${\it\rho}_{b}$
is a dimensionless number, in series with the Hagen–Poiseuille resistance
 $R_{u}$
. The flux through a blocked pore,
 $Q_{b,pore}(X,T)$
, is thus given by
 $$\begin{eqnarray}\displaystyle Q_{b,pore}=\frac{1}{R_{b}}(P^{+}|_{Y=D/2}-P^{-}|_{Y=-D/2})\quad \text{where }R_{b}=\frac{8{\it\mu}D}{{\rm\pi}A_{0}^{4}}\left(\left(\frac{A_{0}}{A}\right)^{4}+{\it\rho}_{b}\right). & & \displaystyle\end{eqnarray}$$
The dimensionless parameter
 ${\it\rho}_{b}$
characterizes blocking strength: for large values of
 ${\it\rho}_{b}$
pore resistance increases dramatically after blocking, while for small values resistance is almost unchanged. In the limit
 ${\it\rho}_{b}\rightarrow \infty$
our model captures the simplest blocking assumption: that deposition of a large particle over a pore blocks it completely.
We can now relate the number densities of unblocked and blocked pores,
 $N(X,T)$
and
 $N_{0}-N(X,T)$
respectively (where
 $N_{0}=N(X,0)$
), to the membrane permeability
 $K_{m}$
by noting that the flux
 $|V_{m}|$
of fluid (per unit area of membrane) is
 $$\begin{eqnarray}\displaystyle |V_{m}|=N(X,T)Q_{u,pore}+(N_{0}-N(X,T))Q_{b,pore} & & \displaystyle\end{eqnarray}$$
so that, on substituting for
 $Q_{u,pore}$
from (2.8) and for
 $Q_{b,pore}$
from (2.9) in the above and comparing to (2.5), we obtain
 $$\begin{eqnarray}\displaystyle K_{m}=\frac{{\rm\pi}A_{0}^{4}}{8}\left(\frac{N}{(A_{0}/A)^{4}}+\frac{N_{0}-N}{(A_{0}/A)^{4}+{\it\rho}_{b}}\right). & & \displaystyle\end{eqnarray}$$
To complete the model we need equations describing the evolution of
 $N(X,T)$
, the local number density of unblocked pores, and
 $A(T)$
the pore radius. We assume a pore is blocked whenever a particle with radius
 $S>A(T)$
is advected to the pore entrance. If we assume a cumulative particle size distribution function
 $G(S)$
, giving the number of particles per unit volume of fluid with radius smaller than
 $S$
, then the concentration of particles of size
 $S>A(T)$
is
 $G_{\infty }-G(A)$
(where
 $G_{\infty }=\lim _{S\rightarrow \infty }G(S)$
is the total particle concentration). The probability that a particular pore is blocked (per unit time) is thus
 $(G_{\infty }-G(A))$
multipled by the flux through the pore,
 $Q_{u,pore}$
(given by (2.8)):
 $$\begin{eqnarray}\displaystyle \hspace{-15.00002pt}\left[\begin{array}{@{}c@{}}\text{Probability per unit time that}\\ \text{pore of radius }A\text{ is blocked}\end{array}\right]=\frac{{\rm\pi}A^{4}}{8{\it\mu}D}(G_{\infty }-G(A))(P^{+}|_{Y=D/2}-P^{-}|_{Y=-D/2}). & & \displaystyle\end{eqnarray}$$
Given that we assume unblocked pores all have radius
 $A(T)$
, the number of pores blocked per unit time, per unit area, is equal to
 $N(X,T)$
times the probability, per unit time, that a pore of radius
 $A(T)$
is blocked. It follows that the rate of change of the number density (per unit area) of unblocked pores is given by
 $$\begin{eqnarray}\displaystyle \frac{\partial N}{\partial T}=-N\frac{{\rm\pi}A^{4}}{8{\it\mu}D}(G_{\infty }-G(A))(P^{+}|_{Y=D/2}-P^{-}|_{Y=-D/2}). & & \displaystyle\end{eqnarray}$$
In order to describe fouling we make the simplest possible assumption, namely uniform adsorption within the pores, so that particle radius decreases uniformly according to
 $$\begin{eqnarray}\displaystyle \frac{\partial A}{\partial T}=-E,\quad A|_{T=0}=A_{0}, & & \displaystyle\end{eqnarray}$$
for some constant
 $E$
. Deposition within pores in reality will be controlled by a complex interplay between suspended particles in the feed, and the membrane material, the details of which will vary from one system to another; in the absence of detailed experimental data our model reflects an assumption that the rate of loss of pore area is proportional to the pore circumference only, other effects being largely the same from one pore to another.
All our simulations will be conducted with an exponential cumulative particle distribution of the form
 $$\begin{eqnarray}\displaystyle G(S)=G_{\infty }(1-\text{e}^{-BS}), & & \displaystyle\end{eqnarray}$$
where
 $B^{-1}$
is a characteristic particle size. This functional form was not chosen to fit to any specific dataset, but has the general features required. While some particle size distributions characterized in the literature (see e.g. Giglia & Straeffer Reference Giglia and Straeffer2012, with two distinct characteristic particle sizes) are more complicated, we recall that our model implicitly assumes two separate particle size distributions: the ‘macroscopic’ particles modelled by
 $G(S)$
with pore-blocking potential; and the ‘microscopic’ particles implicit in our pore adsorption model.
Approximate dimensionless parameter values.

2.3 Scaling, non-dimensionalization and asymptotics
Even with the simplifications introduced, the model above is complicated, and we therefore exploit asymptotic analysis based on the small aspect ratio of the pleat (
 ${\it\epsilon}=H/L\ll 1$
), and on the thinness of the membrane relative to the support layer (
 ${\it\delta}=D/H\ll 1$
); see table 2 below, which summarizes the model parameters and gives estimates, where available. For the most part we consider filtration driven by a fixed pressure drop,
 $P_{0}$
, between inlet and outlet, and this is the basis on which we non-dimensionalize below. We will also present some simulations for a prescribed flux scenario, for which the scalings are a little different; we comment briefly on this in § 2.3.4 below.
2.3.1 Fluid dynamics
In order to exploit the asymptotic simplifications, we introduce dimensionless variables as follows:
 $$\begin{eqnarray}\displaystyle \left.\begin{array}{@{}r@{}}P^{\pm }(X,Y)=P_{0}p^{\pm }(x,y),\quad (X,Y)=(Lx,Hy),\\ K(X)=K_{av}k(x),\quad K_{m}(X)=K_{m0}k_{m}(x),\end{array}\right\} & & \displaystyle\end{eqnarray}$$
where
 $K_{av}=(1/L)\int _{0}^{L}K(X)\,\text{d}X$
is the average support layer permeability and
 $K_{m0}$
is a typical initial membrane permeability. For definiteness, we can take it to be the initial membrane permeability in the expression (2.11), with
 $A=A_{0}$
and
 $N=N_{0}$
. For conciseness in the following we will indicate dependence on variables only where necessary, but it should be understood that all functions except the support layer permeability
 $k$
vary in both space and time. In the dimensionless coordinates our idealized problem for the pressure
 $p^{\pm }(x,y)$
within the support layers (2.2)–(2.4) becomes
 $$\begin{eqnarray}\displaystyle {\it\epsilon}^{2}(k(x)p_{x}^{+})_{x}+(k(x)p_{y}^{+})_{y}=0,\quad {\it\delta}/2\leqslant y\leqslant 1, & & \displaystyle\end{eqnarray}$$
 $$\begin{eqnarray}\displaystyle p^{+}(0,y)=1,\quad p_{x}^{+}(1,y)=0,\quad p_{y}^{+}(x,1)=0, & & \displaystyle\end{eqnarray}$$
 $$\begin{eqnarray}\displaystyle {\it\epsilon}^{2}(k(x)p_{x}^{-})_{x}+(k(x)p_{y}^{-})_{y}=0,\quad -1\leqslant y\leqslant -{\it\delta}/2, & & \displaystyle\end{eqnarray}$$
 $$\begin{eqnarray}\displaystyle p_{x}^{-}(0,y)=0,\quad p^{-}(1,y)=0,\quad p_{y}^{-}(x,-1)=0. & & \displaystyle\end{eqnarray}$$
This system is closed by enforcing flux continuity across the membrane, (2.5) and (2.6), which gives
 $$\begin{eqnarray}\displaystyle p_{y}^{+}|_{y={\it\delta}/2}=p_{y}^{-}|_{y=-{\it\delta}/2}={\it\epsilon}^{2}{\it\Gamma}\frac{k_{m}(x)}{k(x)}[p^{+}|_{y={\it\delta}/2}-p^{-}|_{y=-{\it\delta}/2}], & & \displaystyle\end{eqnarray}$$
where the key dimensionless parameter
 ${\it\Gamma}$
is defined by
 $$\begin{eqnarray}\displaystyle {\it\Gamma}=\frac{K_{m0}L^{2}}{K_{av}HD} & & \displaystyle\end{eqnarray}$$
and gives a scaled measure of the relative importance of the resistance of the packing material to that of the membrane, such that if
 ${\it\Gamma}\gg 1$
the packing material provides most of the resistance whereas if
 ${\it\Gamma}\ll 1$
the membrane provides most of the resistance. We now seek asymptotic solutions for
 $p^{\pm }$
in the distinguished limit
 ${\it\Gamma}=O(1)$
,
 ${\it\epsilon}\ll 1$
and
 ${\it\delta}\ll 1$
(note that our solution is asymptotically valid for all
 ${\it\Gamma}\ll 1/{\it\epsilon}^{2}$
) by expanding
 $p^{\pm }$
in powers of
 ${\it\epsilon}$
as follows:
 $$\begin{eqnarray}\displaystyle \hspace{-25.00003pt}p^{+}(x,y)=p_{0}^{+}(x)+{\it\epsilon}^{2}p_{1}^{+}(x,y)+\cdots \,,\quad p^{-}(x,y)=p_{0}^{-}(x)+{\it\epsilon}^{2}p_{1}^{-}(x,y)+\cdots \,. & & \displaystyle\end{eqnarray}$$
We will determine coupled equations for the as yet unknown functions
 $p_{0}^{\pm }(x)$
by seeking a solvability condition on the first-order solutions
 $p_{1}^{\pm }(x,y)$
. This is effected by substituting the expansions (2.23) into (2.17)–(2.20) and taking the
 $O({\it\epsilon}^{2})$
terms,
 $$\begin{eqnarray}\displaystyle \frac{\partial }{\partial y}\left(k(x)\frac{\partial p_{1}^{+}}{\partial y}\right)+\frac{\partial }{\partial x}\left(k(x)\frac{\partial p_{0}^{+}}{\partial x}\right)=0, & & \displaystyle\end{eqnarray}$$
 $$\begin{eqnarray}\displaystyle \frac{\partial p_{1}^{+}}{\partial y}\bigg|_{y=1}=0,\quad k(x)\frac{\partial p_{1}^{+}}{\partial y}\bigg|_{y=0^{+}}={\it\Gamma}k_{m}(x)(p_{0}^{+}-p_{0}^{-}), & & \displaystyle\end{eqnarray}$$
 $$\begin{eqnarray}\displaystyle \frac{\partial }{\partial y}\left(k(x)\frac{\partial p_{1}^{-}}{\partial y}\right)+\frac{\partial }{\partial x}\left(k(x)\frac{\partial p_{0}^{-}}{\partial x}\right)=0, & & \displaystyle\end{eqnarray}$$
 $$\begin{eqnarray}\displaystyle \frac{\partial p_{1}^{-}}{\partial y}\bigg|_{y=-1}=0,\quad k(x)\frac{\partial p_{1}^{-}}{\partial y}\bigg|_{y=0^{-}}={\it\Gamma}k_{m}(x)(p_{0}^{+}-p_{0}^{-}). & & \displaystyle\end{eqnarray}$$
Integrating (2.24) between
 $y=0$
and
 $y=1$
and applying the boundary conditions (2.25) leads to a solvability condition in the form of an ordinary differential equation (ODE) (in
 $x$
) for
 $p_{0}^{+}(x)$
and
 $p_{0}^{-}(x)$
. Similarly, integration of (2.26) between
 $y=-1$
and
 $y=0$
and application of the boundary conditions (2.27) leads to a second ODE. Boundary conditions on these two ODEs come from the leading-order terms of (2.18) and (2.20). The resulting simplified model for
 $p_{0}^{+}$
and
 $p_{0}^{-}$
is
 $$\begin{eqnarray}\displaystyle \frac{\partial }{\partial x}\left(k(x)\frac{\partial p_{0}^{+}}{\partial x}\right)={\it\Gamma}k_{m}(x)(p_{0}^{+}-p_{0}^{-}), & & \displaystyle\end{eqnarray}$$
 $$\begin{eqnarray}\displaystyle \frac{\partial }{\partial x}\left(k(x)\frac{\partial p_{0}^{-}}{\partial x}\right)=-{\it\Gamma}k_{m}(x)(p_{0}^{+}-p_{0}^{-}), & & \displaystyle\end{eqnarray}$$
 $$\begin{eqnarray}\displaystyle p_{0}^{+}|_{x=0}=1,\quad \left.\frac{\partial p_{0}^{+}}{\partial x}\right|_{x=1}=0, & & \displaystyle\end{eqnarray}$$
 $$\begin{eqnarray}\displaystyle \left.\frac{\partial p_{0}^{-}}{\partial x}\right|_{x=0}=0,\quad p_{0}^{-}|_{x=1}=0. & & \displaystyle\end{eqnarray}$$
In addition
 $p_{1}^{+}$
and
 $p_{1}^{-}$
can be found by solving the differential equations (2.24) and (2.26) subject to boundary conditions (2.25) and (2.27) respectively, giving
 $$\begin{eqnarray}\displaystyle p_{1}^{+}(x,y)=-\frac{(k(x)p_{0x}^{+})_{x}}{k(x)}\left(\frac{y^{2}}{2}-y\right)+h^{+}(x), & & \displaystyle\end{eqnarray}$$
 $$\begin{eqnarray}\displaystyle p_{1}^{-}(x,y)=-\frac{(k(x)p_{0x}^{-})_{x}}{k(x)}\left(\frac{y^{2}}{2}+y\right)+h^{-}(x), & & \displaystyle\end{eqnarray}$$
for some functions
 $h^{\pm }(x)$
.
This model, at leading order, describes two porous medium flows (with pressures
 $p_{0}^{+}(x)$
and
 $p_{0}^{-}(x)$
) separated by a membrane through which fluid is driven (from one side to the other) by the local pressure difference.
Generalization to support layer with
 $y$
-dependent permeability
$k(x,y)$


It is straightforward to generalize this treatment to a support layer with permeability
 $k(x,y)$
. Dependence on
 $y$
could be introduced by (for example) choice of a support material with a layered structure. The result obtained is identical to (2.28)–(2.31) except that
 $k(x)$
is replaced by
 $\hat{k}^{+}(x)$
in (2.28) and
 $\hat{k}^{-}(x)$
in (2.29), where
 $\hat{k}^{+}(x)$
and
 $\hat{k}^{-}(x)$
are the
 $y$
-averages of the permeability, above and below the membrane, respectively,
 $$\begin{eqnarray}\displaystyle \hat{k}^{+}(x)=\int _{0}^{1}k(x,y)\,\text{d}y\quad \text{and}\quad \hat{k}^{-}(x)=\int _{-1}^{0}k(x,y)\,\text{d}y. & & \displaystyle\end{eqnarray}$$
When we come to suggest possible improvements to the pleated filter system in § 4 we will return to this generalized formulation.
The small-
${\it\Gamma}$
limit

In this limit the dominant resistance to flow is that of the membrane (as opposed to that of the porous support layers) and, to leading order in
 ${\it\Gamma}$
, the solution to (2.28)–(2.31) is just
 $$\begin{eqnarray}\displaystyle p_{0}^{+}=1\quad \text{and}\quad p_{0}^{-}=0. & & \displaystyle\end{eqnarray}$$
It is apparent that the situation here is identical to that of a flat membrane across which a constant pressure difference is applied. We would thus expect membrane fouling to occur uniformly along the length of the membrane, leading to optimal membrane performance (see appendix A and the simulations of § 3).
Method of solution
It is apparent from (2.28) and (2.29) that
 $(k(x)(p_{0}^{+}+p_{0}^{-})_{x})_{x}=0$
. This statement is readily integrated twice to obtain an expression for
 $p_{0}^{-}$
in terms of
 $p_{0}^{+}$
,
 $$\begin{eqnarray}\displaystyle p_{0}^{-}(x)=-p_{0}^{+}(x)-c_{1}(t)\int _{0}^{x}\frac{\text{d}x^{\prime }}{k(x^{\prime })}-c_{2}(t), & & \displaystyle\end{eqnarray}$$
for some
 $c_{1}(t)$
and
 $c_{2}(t)$
(which are independent of
 $x$
, but will vary in time as fouling occurs). By substituting (2.36) into (2.28) we obtain a single equation for
 $p_{0}^{+}$
containing two arbitrary functions of time,
 $$\begin{eqnarray}\displaystyle (k(x)p_{0x}^{+}(x))_{x}-2{\it\Gamma}k_{m}(x)p_{0}^{+}(x)={\it\Gamma}k_{m}(x)\left(c_{1}(t)\int _{0}^{x}\frac{\text{d}x^{\prime }}{k(x^{\prime })}+c_{2}(t)\right), & & \displaystyle\end{eqnarray}$$
which must be solved subject to the four boundary conditions
 $$\begin{eqnarray}\displaystyle \left.\begin{array}{@{}c@{}}\displaystyle p_{0}^{+}|_{x=0}=1,\quad p_{0x}^{+}|_{x=0}=-\frac{c_{1}(t)}{k(0)},\\ \displaystyle p_{0}^{+}|_{x=1}=-\left(c_{1}(t)\int _{0}^{1}\frac{\text{d}x}{k(x)}+c_{2}(t)\right),\quad p_{0x}^{+}|_{x=1}=0.\end{array}\right\} & & \displaystyle\end{eqnarray}$$
Hence, with
 $p_{0}^{+}$
determined, we have the leading-order solution for the pressure within the support layers, from (2.23) and (2.36).
The flux of fluid through the pleat
The total dimensionless flux
 $q$
, which we will use to characterize membrane performance later, is defined in terms of total dimensional flux
 $Q$
(2.7) by
 $Q=Q_{0}q$
, where
 $Q_{0}=K_{m0}P_{0}L/({\it\mu}D)$
. By mass conservation the total flux of fluid flowing across the membrane is equal to that flowing across the inlet boundary and so
 $$\begin{eqnarray}\displaystyle q=-\frac{k}{{\it\Gamma}}\frac{\partial p_{0}^{+}}{\partial x}\bigg|_{x=0}. & & \displaystyle\end{eqnarray}$$
Another useful quantity for understanding the progress of fouling is the flux
 $|V_{m}|$
(as defined in (2.6)), per unit area, through the membrane (from top to bottom) as a function of position
 $X$
along the membrane. When we define the dimensionless analogue,
 $|v_{m}|$
, of this quantity by
 $|V_{m}|=|v_{m}|K_{m0}P_{0}/({\it\mu}D)$
, this satisfies the relation
 $$\begin{eqnarray}\displaystyle |v_{m}(x,t)|=p_{0}^{+}(x,t)-p_{0}^{-}(x,t). & & \displaystyle\end{eqnarray}$$
2.3.2 Membrane fouling
The membrane permeability
 $k_{m}$
and the flow vary in time due only to the fouling by deposited particles, which occurs in a spatially non-uniform manner. In (2.11) we expressed membrane permeability in terms of the pore radius
 $A$
, and the number of unblocked pores per unit area,
 $N$
. We scale each of these quantities with their initial values,
 $$\begin{eqnarray}\displaystyle A=A_{0}a,\quad N(X)=N_{0}n(x). & & \displaystyle\end{eqnarray}$$
We note further that (2.13) defines a natural time scale for the problem (that of blocking), while
 $G_{\infty }$
gives a natural scale for the particle size distribution, motivating us to rescale as follows:
 $$\begin{eqnarray}\displaystyle \hspace{-20.00003pt}T=\frac{8{\it\mu}D}{{\rm\pi}P_{0}G_{\infty }A_{0}^{4}}t,\quad G=G_{\infty }g(s),\quad S=A_{0}s,\quad B=\frac{b}{A_{0}},\quad g(s)=1-\text{e}^{-bs} & & \displaystyle\end{eqnarray}$$
while (2.11) gives a natural choice of
 $K_{m0}$
and leads to the definition
 $$\begin{eqnarray}\displaystyle K_{m0}=\frac{{\rm\pi}A_{0}^{4}N_{0}}{8}. & & \displaystyle\end{eqnarray}$$
Applying these rescalings together with our original non-dimensionalization (2.16) to (2.11)–(2.14), we obtain the remaining dimensionless equations in the model:
 $$\begin{eqnarray}\displaystyle & \displaystyle k_{m}(x,t)=a^{4}\left(n+\frac{1-n}{1+{\it\rho}_{b}a^{4}}\right), & \displaystyle\end{eqnarray}$$
 $$\begin{eqnarray}\displaystyle & \displaystyle \frac{\partial n}{\partial t}=-na^{4}\text{e}^{-ba}(p^{+}|_{y={\it\delta}/2}-p^{-}|_{y=-{\it\delta}/2}),\quad n|_{t=0}=1, & \displaystyle\end{eqnarray}$$
 $$\begin{eqnarray}\displaystyle & \displaystyle \frac{\partial a}{\partial t}=-{\it\beta},\quad a|_{t=0}=1, & \displaystyle\end{eqnarray}$$
where the dimensionless parameter
 ${\it\beta}$
is given by
 $$\begin{eqnarray}\displaystyle {\it\beta}=\frac{8{\it\mu}ED}{{\rm\pi}A_{0}^{5}P_{0}G_{\infty }}. & & \displaystyle\end{eqnarray}$$
2.3.3 Fluid velocity and streamfunction in support layers
It will be convenient in our simulations to be able to visualize the fluid flow through the support layers. Since the flow within these layers is quasi-static and two-dimensional, a streamfunction
 ${\it\psi}$
may be defined. From the asymptotic solution for the pressure, (2.23), and using the dimensionless form of the Darcy equation, we have dimensionless velocity in the upper and lower support layers given by
 $$\begin{eqnarray}\displaystyle \boldsymbol{u}^{\pm }(x,y)=(-k(x)p_{0x}^{\pm }(x),(k(x)p_{0x}^{\pm }(x))_{x}(y\mp 1)). & & \displaystyle\end{eqnarray}$$
From the streamfunction definition
 $$\begin{eqnarray}\displaystyle \boldsymbol{u}^{\pm }(x,y)=({\it\psi}^{\pm }(x,y)_{y},-{\it\psi}^{\pm }(x,y)_{x}) & & \displaystyle\end{eqnarray}$$
we find
 $$\begin{eqnarray}\displaystyle {\it\psi}^{+}(x,y)=-k(x)p_{0x}^{+}(x)(y-1),\quad {\it\psi}^{-}(x,y)=-k(x)p_{0x}^{-}(x)(y+1)-c_{1}, & & \displaystyle\end{eqnarray}$$
where the integration constant in
 ${\it\psi}^{-}$
(the same
 $c_{1}$
that was introduced in (2.36)) was chosen to match streamlines on the
 $x$
-axis (the filter membrane location).
2.3.4 Modification for the constant flux case
In the alternative scenario where the total flux
 $Q_{0}$
through the membrane is fixed instead of the pressure drop, we define the inlet pressure by
 $P_{0}{\it\zeta}(t)$
, where
 ${\it\zeta}$
increases monotonically as the membrane is fouled, in such a way as to sustain constant total flux
 $Q=Q_{0}$
(as defined by (2.7)). By modifying (2.39),
 $$\begin{eqnarray}\displaystyle {\it\zeta}\left[\frac{k}{{\it\Gamma}}\frac{\partial p_{0}^{+}}{\partial x}\right]_{x=0}^{x=1}=q_{0},\text{constant},\quad \text{for all }t, & & \displaystyle\end{eqnarray}$$
with dimensionless flux as defined there.
2.4 Model summary
Our final model is represented by (2.23), (2.36)–(2.38), (2.44)–(2.46). At this stage we now emphasize each quantity that depends on space and/or time. At each instant of time we must solve the boundary value problem (2.37),
 $$\begin{eqnarray}\displaystyle \hspace{-15.00002pt}\frac{\partial }{\partial x}\left(k(x)\frac{\partial p_{0}^{+}(x,t)}{\partial x}\right)-2{\it\Gamma}k_{m}(x,t)p_{0}^{+}(x,t)={\it\Gamma}k_{m}(x,t)\left(c_{1}(t)\int _{0}^{x}\frac{\text{d}x}{k(x)}+c_{2}(t)\right), & & \displaystyle\end{eqnarray}$$
subject to conditions (2.38)
 $$\begin{eqnarray}\displaystyle p_{0}^{+}(0,t)=1,\quad p_{0x}^{+}(0,t)=-\frac{c_{1}(t)}{k(0)}, & & \displaystyle\end{eqnarray}$$
 $$\begin{eqnarray}\displaystyle p_{0}^{+}(1,t)=-\left(c_{1}(t)\int _{0}^{1}\frac{\text{d}x}{k(x)}+c_{2}(t)\right),\quad p_{0x}^{+}(1,t)=0, & & \displaystyle\end{eqnarray}$$
in terms of which the pressures in the support layers are given by (2.23), (2.36). Note that we have four boundary conditions (2.53), (2.54) for the second-order equation (2.52), which ensures that the unknown functions
 $c_{1}(t)$
and
 $c_{2}(t)$
are fixed also. The membrane permeability
 $k_{m}(x,t)$
varies quasi-statically in (2.52) due to the fouling; it satisfies (2.44),
 $$\begin{eqnarray}\displaystyle k_{m}(x,t)=a(t)^{4}\left[n(x,t)+\frac{(1-n(x,t))}{(1+{\it\rho}_{b}a(t)^{4})}\right],\quad \text{where }a(t)=1-{\it\beta}t. & & \displaystyle\end{eqnarray}$$
The number density of unblocked pores,
 $n(x,t)$
, varies according to (2.45),
 $$\begin{eqnarray}\displaystyle \frac{\partial n(x,t)}{\partial t}=-n(x,t)a(t)^{4}\text{e}^{-ba(t)}\left(2p_{0}^{+}(x,t)+c_{1}(t)\int _{0}^{x}\frac{\text{d}x}{k(x)}+c_{2}(t)\right),\quad n(x,0)=1. & & \displaystyle \nonumber\\ \displaystyle & & \displaystyle\end{eqnarray}$$
The solution scheme for this system is straightforward. At time
 $t=0$
assign
 $k_{m}(x,0)=k_{m0}=1$
. Then: (i) solve the boundary value problem (2.52)–(2.54) for
 $p_{0}^{+}(x,t)$
; (ii) use this solution, and the current membrane permeability
 $k_{m}(x,t)$
and pore radius
 $a(t)$
as given by (2.55) to solve (2.56) for
 $n(x,t)$
; (iii) update
 $k_{m}(x,t)$
and
 $a(t)$
via (2.55) according to the new
 $n(x,t)$
; and (iv) use the updated
 $k_{m}(x,t)$
and return to step (i); repeat.
3 Results
The model contains a number of parameters, which are summarized in table 1 (dimensional parameters) and table 2 (dimensionless parameters) along with typical values, where known. Considerable variation in the exact values is possible as indicated in the table, but exhaustive investigation of the effects of each parameter is impractical, hence for most of our simulations we fix their values as discussed below.
The relative measure of the resistance of the packing material to that of the membrane,
 ${\it\Gamma}$
, could certainly vary quite widely from one system to another depending on the detailed structure of the filter membrane and the support layers. Our analysis assumes
 ${\it\Gamma}=O(1)$
, which appears to be in line with data for real pleated filters (A. Kumar, 2014, Private communication). Based on the values given in tables 1 and 2 we take
 ${\it\Gamma}=10$
throughout most of our simulations (figures 4–6), but consider how results depend on
 ${\it\Gamma}$
in figure 7. The dimensionless pore shrinkage rate,
 ${\it\beta}$
, is unknown but will be small (this represents the time scale on which pores close due to adsorption, relative to that on which particles block individual pores from upstream): we set
 ${\it\beta}=0.02$
. Assuming the characteristic particle size to be larger than the membrane pore size, we set
 $b$
, the ratio of initial pore size to characteristic particle size, to
 $0.5$
for most simulations. Finally, assuming that blocking of a pore by a particle increases its resistance by some
 $O(1)$
factor, we set
 ${\it\rho}_{b}=2$
for most simulations. We briefly demonstrate the effect of changing parameters
 ${\it\rho}_{b}$
and
 $b$
in figure 6.
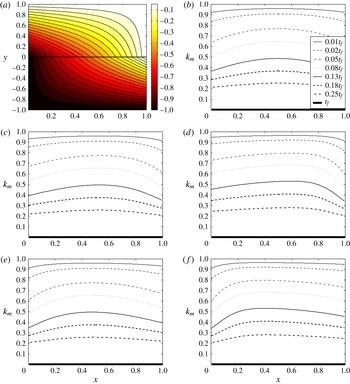
(a) The streamlines (level curves of
 ${\it\psi}^{\pm }(x,y)$
) at time
 $t=0.2t_{f}$
for the case of uniform support layer permeability
 $k(x)=k_{1}(x)=1$
. (b–f) Membrane permeability
 $k_{m}$
at several different times (indicated in the legends) for the support permeability profiles
 $k_{1}$
–
 $k_{5}$
(defined in (3.1)), respectively. In all cases,
 $t_{f}=50$
. Other parameter values are:
 ${\it\beta}=0.02$
,
 ${\it\Gamma}=10$
,
 $b=0.5$
,
 ${\it\rho}_{b}=2$
.

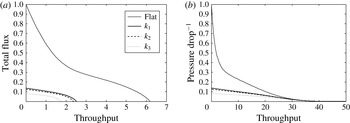
(a) Total flux
 $q(t)$
versus throughput
 $\int _{0}^{t}q(t^{\prime })\,\text{d}t^{\prime }$
with imposed constant pressure drop for the pleated membrane with support permeabilities
 $k_{1}$
,
 $k_{2}$
,
 $k_{3}$
(defined in (3.1)), and for the non-pleated membrane solution of appendix A (labelled ‘Flat’ in the legend). (b) Scaled inverse pressure drop versus throughput
 $\int _{0}^{t}q(t^{\prime })\,\text{d}t^{\prime }$
for the case of imposed constant total flux, for the pleated membrane with support permeabilities
 $k_{1}$
,
 $k_{2}$
,
 $k_{3}$
and for the non-pleated membrane solution. Parameter values in both cases are set to the ‘default’ values:
 ${\it\beta}=0.02$
,
 ${\it\Gamma}=10$
,
 $b=0.5$
,
 ${\it\rho}_{b}=2$
.

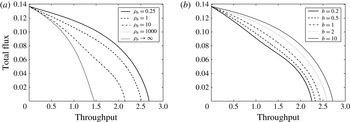
Flux-throughput graphs for the uniform support layer permeability
 $k=k_{1}=1$
(a) for several different values of
 ${\it\rho}_{b}$
(a measure of the relative increase in pore resistance when a pore is blocked by a large particle), with
 $b=0.5$
; and (b) for several different values of
 $b$
, with
 ${\it\rho}_{b}=5$
. Other parameter values are
 ${\it\beta}=0.02$
,
 ${\it\Gamma}=10$
.

Flux-throughput graphs for the uniform support layer permeability
 $k=k_{1}=1$
for several different values of
 ${\it\Gamma}$
, with
 ${\it\beta}=0.02$
,
 $b=0.5$
,
 ${\it\rho}_{b}=2$
.

For the support layer permeability function
 $k(x)$
we investigate several different profiles to see how this affects the outcome. For a real pleated filter we anticipate that decreasing support layer permeability will be the more realistic scenario, since the annular cartridge leads to higher compression (and lower permeability) of the layers at the inner cartridge boundary (corresponding to
 $x=1$
; we refer the reader back to figures 2 and 3 for the cartridge geometry). However, for a more complete investigation, and to gain further insight into the model behaviour, we also consider increasing support permeability profiles, and the case of uniform support permeability. The different profiles considered are:
 $$\begin{eqnarray}\displaystyle k(x)=\left\{\begin{array}{@{}l@{}}k_{1}(x)=1\quad \text{uniform }\\ k_{2}(x)=1.5-x\quad \text{linear decreasing}\\ k_{3}(x)={\displaystyle \frac{1}{1.2}}\left(\tanh \left({\displaystyle \frac{0.5-x}{0.25}}\right)+1.2\right)\quad \text{abruptly decreasing}\\ k_{4}(x)=0.5+x\quad \text{linear increasing}\\ k_{5}(x)={\displaystyle \frac{1}{1.2}}\left(\tanh \left({\displaystyle \frac{x-0.5}{0.25}}\right)+1.2\right)\quad \text{abruptly increasing}\end{array}\right. & & \displaystyle\end{eqnarray}$$
(note that each of these support permeability profiles averages to 1, in line with the non-dimensionalization chosen for
 $k(x)$
).
We solve the model numerically for each chosen permeability profile, until the membrane becomes impermeable and the total flux through it falls to zero at final time
 $t=t_{f}$
: for each simulation considered here the flux falls to zero by virtue of the pore radius
 $a\rightarrow 0$
and hence
 $t_{f}=1/{\it\beta}=50$
(see (2.55)). Our numerical scheme is straightforward, based on second-order-accurate finite difference spatial discretization of the equations, with a simple explicit time step in the pore-blocking equation (2.56). Figure 4(a) shows the streamlines, obtained by plotting the level curves of
 ${\it\psi}^{\pm }(x,y)$
defined in (2.50), within the support layers at
 $t=0.2t_{f}$
for the case of uniform support layer permeability
 $k_{1}$
; since the streamlines appear qualitatively similar for the other cases
 $k_{2}$
to
 $k_{5}$
we do not show streamlines for all cases. Figure 4(b–f) shows the evolution of the membrane permeability
 $k_{m}(x,t)$
until it falls to zero, for each support permeability profile
 $k_{1}$
–
 $k_{5}$
in (3.1). We also (below) compare results for our pleated filter model with the closest equivalent non-pleated membrane (a flat membrane, surrounded by the same porous support layers as the pleated filter, but in dead-end filtration; see appendix A for the solution of this problem).
Figures 4(a) and 4(b) show the results for the case of uniform support layer permeability (USP),
 $k_{1}(x)=1$
. Here the fouling profile remains symmetric about the centreline
 $x=0.5$
, but is distinctly non-uniform in
 $x$
. Fouling occurs preferentially at the edges of the domain, near the pleat valleys and tips. Since the pore-clogging (adsorption) mechanism is assumed to operate homogeneously throughout the membrane, this enhanced edge-fouling can be due only to greater pore-blocking there, which itself is a consequence of enhanced flux through the membrane in those regions (evidenced by the streamline pattern).
Figures 4(c) and 4(d) show results for decreasing support layer permeability (DSP) profiles. In both cases the symmetry is now broken; the highest flow rate, and the fouling, are skewed towards the right-hand boundary
 $x=1$
where support permeability is lowest. Compared with the previous USP case, the support permeability is higher where the flow enters. Hence, compared with USP, the flow has an easier path through the support layer, and a greater proportion of the flow entering will pass along the support layer in the
 $x$
-direction, rather than through the membrane. Both figures show this trend, but the effect is more dramatic in figure 4(d) where the support permeability spatial profile is more extreme (and hence the support permeability at entry is higher).
As we would anticipate, the converse trend is seen for the increasing support layer permeability (ISP) profiles (figures 4
e and 4
f). Here, the fluid has an initially difficult path through the upper support layer parallel to the membrane. Thus initially (again relative to the USP case) a greater proportion of fluid prefers to flow through the membrane near the boundary
 $x=0$
, rather than along the support layer in the
 $x$
-direction. This leads to a greater flux through the
 $x=0$
end of the membrane, with greater particle deposition in that region, giving decreased membrane permeability there as time increases.
In all cases, however, as
 $t\rightarrow t_{f}$
the membrane permeability necessarily becomes uniform again. The explanation for this is straightforward: if
 $k_{m}\rightarrow 0$
in one area of the membrane then that part is impermeable, and fluid must pass through other parts of the membrane, fouling those until
 $k_{m}=0$
over the whole membrane.
We remark that the fouling patterns obtained here, with increased fouling in the neighbourhood of pleat valleys and tips, appear qualitatively consistent with the experimental data of Fotovati et al. (Reference Fotovati, Hosseini, Vahedi Tafreshi and Pourdeyhimi2011) on the deposition of dust particles within a pleated filter. It is also of interest to note that the fouling patterns we find (due to adsorption and pore-blocking) are quite different in nature to those obtained by King & Please (Reference King and Please1996), who model only cake formation on a pleated filter (and in the absence of any permeable support layers). This suggests that the type of fouling can significantly affect how the filtration proceeds, and hence it is important to know which fouling modes are operational at all stages. Our model is relevant to the many applications in which cake formation occurs only in the very late stages, when the filter is already heavily fouled, and is near the end of its useful life.
To gain insight into the performance of the filter membrane, we plot the graphs of total flux (
 $q(t)$
, defined by (2.39)) versus throughput (defined by
 $\int _{0}^{t}q(t^{\prime })\,\text{d}t^{\prime }$
). In order to present results that are readily distinguished from one another, and to focus attention on problems of most immediate industrial relevance, we plot these graphs for simulations corresponding to the uniform and decreasing support permeabilities
 $k_{1}$
–
 $k_{3}$
in (3.1) (note also that, given the symmetries observed in figure 4 we anticipate results for
 $k_{2}$
and
 $k_{4}$
to be identical, and results for
 $k_{3}$
and
 $k_{5}$
to be identical). This flux-throughput graph is a commonly used tool in the filtration literature to characterize experimentally the performance of filter membranes (see e.g. Daniel et al.
Reference Daniel, Billing, Russell, Shimskey, Smith and Peterson2011; Giglia & Straeffer Reference Giglia and Straeffer2012; van der Sman et al.
Reference van der Sman, Vollebregt, Mepschen and Noordman2012 among many others). Such curves exemplify the tradeoffs often inherent in membrane performance: high total throughput over a filter lifetime may only be obtained at the expense of low flux (meaning that filtration is slow); or flux may be high over the filter lifetime, but total throughput low (meaning that the filter has a short lifespan). Both scenarios are costly in different ways, and usually in practice some compromise between the two is found.
The results for our pleated filter model are shown in figure 5(a), alongside the corresponding graph for the equivalent non-pleated membrane filter (the solution for which is outlined in appendix A). The graphs clearly demonstrate the superior performance of the non-pleated membrane, which gives a higher net throughput and higher total flux throughout. Figure 5(b) shows results for the case in which total flux through the system, rather than pressure drop across it, is prescribed. In this case as the membrane is fouled the pressure drop required to maintain the constant flux rises in time, and we demonstrate this by plotting the inverse pressure drop across the system as a function of throughput. The same cases as for figure 5(a) are shown, and once again the superior performance of the equivalent non-pleated filter is apparent: comparing this filter with any of our pleated simulations, the same throughput is achieved at lower pressure drop during the later stages of filtration when blocking becomes significant. The lower pressure drop required for the same throughput is clearly a more efficient scenario, requiring less power to carry out the filtration.
Figure 6 briefly demonstrates the effect of varying the parameters
 ${\it\rho}_{b}$
and
 $b$
, which measure (respectively) the relative increase in pore resistance when a pore is blocked, and the relative size of pores and particles. These results reveal that the pleated filter model retains features qualitatively similar to those observed for ‘dead end’ filtration models (for non-pleated filters). In particular as
 ${\it\rho}_{b}$
varies from large to small there is a clear qualitative change in the shape of the flux-throughput performance curves, as the model transitions from blocking-dominated to adsorption-dominated behaviour (figure 6
a; this figure also includes the limit
 ${\it\rho}_{b}\rightarrow \infty$
, which represents the case in which deposition of a large particle over a pore blocks it entirely). Such qualitative changes have been observed experimentally as the membrane type and/or filtrate is varied, see e.g. Giglia & Straeffer (Reference Giglia and Straeffer2012). Similar qualitative changes are observed as the parameter
 $b$
is varied (figure 6
b). Again, this may be attributed to the model transitioning from blocking-dominated (small
 $b$
; pores smaller than particles) to adsorption-dominated (large
 $b$
; particles smaller than pores) behaviour. Figure 6(b) demonstrates how the flux-throughput graph varies as
 $b$
is changed for
 ${\it\rho}_{b}=5$
(other parameters as before). When a smaller value of
 ${\it\rho}_{b}$
is used (e.g.
 ${\it\rho}_{b}=0.25$
) there is less variation in the flux-throughput graphs with
 $b$
.
Since other parameters remained constant for these simulations of figure 6, overall filter performance deteriorates as
 ${\it\rho}_{b}$
increases (larger
 ${\it\rho}_{b}$
means that blocking of individual pores by large particles leads to a greater decrease in system permeability); nonetheless there is a clear and distinct change in the shape of the flux-throughput curves as
 ${\it\rho}_{b}$
changes, and this is in line with what would be anticipated from the empirical laws commonly assumed in the filtration fouling literature (as described, e.g. by Giglia & Straeffer Reference Giglia and Straeffer2012). Similar inferences may be made for the variations with
 $b$
.
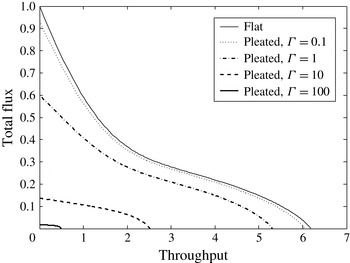
Figure 7 shows how the results change as the parameter
 ${\it\Gamma}$
varies. In line with the asymptotic small-
 ${\it\Gamma}$
results of § 2.3, we observe convergence of the pleated filter results to the non-pleated (flat) filter as
 ${\it\Gamma}\rightarrow 0$
and the membrane resistance is the dominant contribution to the total system resistance. For very large values of
 ${\it\Gamma}$
the support layer adds very significant additional resistance to the system, and overall filter performance is very poor.
4 Discussion and conclusions
We have presented an asymptotically reduced, first-principles model that can describe the key features of flow through and fouling of a pleated membrane filter. Our model accounts for the non-uniform flow induced by the pleated geometry, and for fouling by two distinct mechanisms: adsorption and pore-blocking. While essentially predictive, our model contains several parameters that may be difficult to measure for a given system (most notably, the relative importance of blocking and adsorption,
 ${\it\rho}_{b}$
, and the dimensionless adsorption rate,
 ${\it\beta}$
). In practice such parameters could be inferred by fitting to a reliable dataset; but even so these parameters will vary from one membrane-filtrate system to another, since they depend on membrane structure, and the chemical interactions between the filtrate particles and the membrane material. In the absence of definitive data, for our simulations we chose what we believe to be plausible parameter values (summarized at the start of § 3 and in tables 1 and 2).
The focus in this paper is on development of a model that can be used to quantify (i) the performance of a pleated filter with known characteristics under given operating conditions and (ii) the key differences between this and the closest equivalent non-pleated membrane filter in dead-end filtration. There are many different metrics that can be used to quantify filter performance: we focus primarily on optimization of filtrate throughput over the filter lifetime, for fixed filter-membrane characteristics. Though particle capture efficiency is obviously another important performance indicator, we assume that the same filter membrane will make an equally good (or bad) job of this whether in a pleated or flat configuration, and instead try to elucidate how results depend on cartridge design, and why the comparable unpleated case performs better. We present selected results that bear out the expected performance discrepancy, but we do not, in this paper, investigate exhaustively how this discrepancy depends on all model parameters.
One of the suggested hypotheses for the underperformance of pleated filters relative to non-pleated filters is that the presence of the porous support layers in the pleated filter cartridges could be key, due to the increased system resistance they impart. In making our comparisons, we therefore compared our model to a non-pleated filter surrounded by support layers with the same dimensions and permeability as those in our pleated filter (see appendix A). A critical performance parameter in our models turns out to be
 ${\it\Gamma}=K_{m0}L^{2}/(K_{av}HD)$
(see tables 1 and 2), a scaled dimensionless measure of the ratio of the membrane resistance and the support layer resistance. Recalling the brief analysis of the small-
 ${\it\Gamma}$
limit presented in § 2.3.1 we note that this case corresponds, at leading order, to the non-pleated membrane solution. As can be seen from figure 7 the performance of the membrane approaches that of the flat membrane as
 ${\it\Gamma}\rightarrow 0$
and furthermore, this is the optimal value of
 ${\it\Gamma}$
in the sense that it maximizes throughput before the membrane becomes completely fouled. In the light of this observation we briefly consider what steps might be taken to reduce
 ${\it\Gamma}$
. These could include reducing the length
 $L$
of the pleat, or increasing the thickness
 $H$
of the support layer, but both of these act counter to the goal of pleating the membrane in the first place, which is to pack a large amount of membrane into a compact device of small volume. The only realistic way of reducing
 ${\it\Gamma}$
is therefore to increase the average permeability
 $K_{av}$
of the surrounding support layers.
Our model can account for spatial variations in permeability of the support layers, which may be present due to the annular geometry of the filter casing, or could be introduced by choice of support material. These permeabilities were assumed symmetric about the membrane (though the model could be easily adapted to describe the situation when this is not the case); and we investigated primarily how filtration performance varies as this support permeability profile varies with distance
 $x$
along the pleat. Our results indicate firstly that such variations in support permeability can lead to different fouling patterns within the membrane, at least at intermediate filter lifetimes. More importantly, if variations in support permeability are sufficiently abrupt, they can give rise to a marked decrease in filter performance, as borne out by figure 5(a). It was also noted, however, that variations of support permeability in the
 $y$
-direction perpendicular to the membrane may be described within the basic modelling framework, provided only that the support permeability is averaged in the
 $y$
-direction (see (2.34)). This observation suggests that a smaller value of
 ${\it\Gamma}$
could be obtained simply by adding an additional layer of highly permeable material (e.g. mesh, as seen in figure 1) to the existing support, which would increase
 $K_{av}$
and hence decrease
 ${\it\Gamma}$
, with an accompanying performance improvement.
The consistency of our results with previous models and literature gives us confidence that our model, based as it is on first-principles assumptions about how fouling occurs, is sound, and provides a good basis for predictive simulations. While a more complicated model could provide more accurate predictions, our model has the advantage that it is simple and quick to simulate, offering a useful tool for investigating filter design characteristics. Future work on the pleated filter problem, already underway, will include: (i) calibrating and testing the present model against reliable experimental data; (ii) exploring reasonable model parameter space to identify optimum performance within industrial constraints; and (iii) refining the model presented here.
Many possible refinements of our modelling could be pursued, depending on the end goal. From the point of view of more realistically describing an industrial pleated filter cartridge geometry, one could, for example, model the variations along the cartridge axis. As figure 2(a) indicates, the two ends of the annular cartridge are not subject to identical conditions: the top end at
 $Z=L_{c}$
is capped off, while the bottom end
 $Z=0$
is where the drainage occurs. There will, therefore, be some axial variation, neglected in the present model. Such variation could be modelled by first solving an ‘outer’ problem, in which the entire annular cartridge is treated as a porous annulus, across which Darcy flow occurs, driven by a uniform pressure exterior to the annulus, with
 $Z$
-dependent interior pressure determined by solving an inviscid flow problem with no flux through
 $Z=L_{c}$
and uniform pressure at
 $Z=0$
. With sufficiently slow axial variation, this interior
 $Z$
-dependent pressure could then feed parametrically into the present model. Another geometric refinement would be to drop our implicit assumption of radial symmetry (which translates to periodicity in
 $Y$
in our idealized problem), and investigate how azimuthal variation in the fouling affects the flow through the whole device.
We are also currently investigating more fundamental model refinements, of relevance to more general filtration applications. These include: (1) improving the description of the filter membrane, from its current characterization in terms of identical cylindrical pores; (2) improving the model for particle adsorption within pores; and (3) expanding the model to allow for caking, which occurs in the late stages of membrane fouling (such work, at least in the pleated filter application, can draw on the modelling and ideas of King & Please Reference King and Please1996). Such refinements will require that we model specifically the concentration of small adsorbing particles carried by the feed, which are directly responsible for the internal stenosis of the membrane pores, but which are only implicitly modelled in the present work. This leads naturally to modelling of membranes with depth-dependent permeability, with non-uniform, non-cylindrical pores, whose shape evolves as fouling occurs, and one can begin to address questions regarding the optimum depth profile of the membrane itself. More sophisticated modelling of the particle concentration carried by the feed will also enable us to quantify this important aspect of filter performance. We have already made significant progress with modelling some of these issues.
Acknowledgements
This work arose from a problem presented at the 2013 Mathematical Problems in Industry (MPI 2013) Workshop, by Pall Corporation. We gratefully acknowledge several helpful conversations with Drs A. Kumar and M. Hurwitz, both of Pall Corporation, and we thank the anonymous reviewers for their many helpful comments on an earlier version of this paper (in particular, for drawing the work by King & Please Reference King and Please1996 to our attention). Partial financial support from NSF-DMS-1261596 and NSF-DMS-1153954 and Pall Corporation is gratefully acknowledged.
Appendix A. Non-pleated membrane model
In our simulations we compared the performance of our pleated filter model to that of the closest equivalent non-pleated membrane filter. The scenario we consider for the unpleated membrane is a three-layer sandwich (support layer in
 $H\geqslant Y\geqslant D/2$
; filter membrane in
 $D/2\geqslant Y\geqslant -D/2$
; support layer in
 $-D/2\geqslant Y\geqslant -H$
) through which unidirectional flow is driven by an imposed pressure drop, with
 $P^{+}(X,H)=P_{0}$
and
 $P^{-}(X,-H)=0$
(all notation here is as introduced in § 2.2). The support layer permeability is here considered constant,
 $K=K_{av}$
, and flow is perpendicular to the membrane (‘dead end’ filtration). Due to the uniformity of conditions along the
 $X$
-axis the problem is independent of
 $X$
, so the support layer permeability
 $K_{m}$
will vary only in time. We again assume Darcy flow through both support layers, with continuity of flux across the membrane, which sustains a pressure drop according to its permeability.
We introduce the same scalings and non-dimensionalization as in § 2.3, which leads to the following problems in upper and lower support layers:
 $$\begin{eqnarray}\displaystyle \frac{\text{d}^{2}p^{\pm }}{\text{d}y^{2}}=0\quad \text{with }p^{+}(1)=1,p^{-}(-1)=0. & & \displaystyle\end{eqnarray}$$
Additional conditions matching the flow across the membrane must be imposed as in § 2.3, giving
 $$\begin{eqnarray}\displaystyle \frac{\text{d}p^{+}}{\text{d}y}({\it\delta}/2)=\frac{\text{d}p^{-}}{\text{d}y}(-{\it\delta}/2)=\frac{K_{m}}{K_{av}{\it\delta}}[p^{+}({\it\delta}/2)-p^{-}(-{\it\delta}/2)]. & & \displaystyle\end{eqnarray}$$
We assume, as before, that the membrane and support layer permeabilities satisfy a certain balance:
 $K_{m0}/(K_{av}{\it\delta})={\it\epsilon}^{2}{\it\Gamma}$
, where the measure of the resistance of the packing material to that of the membrane,
 ${\it\Gamma}$
, is order-one with respect to both
 ${\it\epsilon}$
and
 ${\it\delta}$
(see (2.22); note that, in this problem where the
 $X$
length scale
 $L$
does not enter the problem, this balance of permeabilities may be considered as the definition of
 ${\it\epsilon}$
). This allows us to seek a perturbation expansion for the pressure as
 $p^{\pm }=p_{0}^{\pm }+{\it\epsilon}^{2}p_{1}^{\pm }+\cdots \,$
. Using (A 1) and (A 2) together, we obtain
 $$\begin{eqnarray}\displaystyle & \displaystyle p^{+}=1+{\it\epsilon}^{2}{\it\Gamma}\frac{k_{m}}{k}(y-1)+O({\it\epsilon}^{4}), & \displaystyle\end{eqnarray}$$
 $$\begin{eqnarray}\displaystyle & \displaystyle p^{-}={\it\epsilon}^{2}{\it\Gamma}\frac{k_{m}}{k}(y+1)+O({\it\epsilon}^{4}), & \displaystyle\end{eqnarray}$$
representing the fact that, as we would anticipate for a membrane whose permeability is low compared to that of the surrounding layers, the pressure is constant to leading order in each surrounding layer, with the pressure drop taking place across the membrane. To close the model, we need to couple it to the fouling model developed in § 2.2, § 2.3 for adsorption within pores (represented by pore radius
 $a(t)$
; (2.46)) and occlusion of pores by large particles (represented by
 $n(t)$
; (2.45)). For the simple one-dimensional model here, this reduces to
 $$\begin{eqnarray}\displaystyle \hspace{-20.00003pt} & \displaystyle k_{m}(t)=a(t)^{4}\left[n(t)+\frac{(1-n(t))}{(1+{\it\rho}_{b}a(t)^{4})}\right],\quad \text{where }a(t)=1-{\it\beta}t,{\it\beta}=\frac{8{\it\mu}ED}{{\rm\pi}A_{0}^{5}P_{0}G_{\infty }}, & \displaystyle\end{eqnarray}$$
 $$\begin{eqnarray}\displaystyle \hspace{-20.00003pt} & \displaystyle \frac{\text{d}n(t)}{\text{d}t}=-a^{4}(t)\text{e}^{-ba(t)}n(t),\quad n(0)=1, & \displaystyle\end{eqnarray}$$
and
 ${\it\rho}_{b}$
is again a dimensionless number characterizing the additional resistance induced when a large particle blocks a pore (see (2.9)).