I. INTRODUCTION
Research on photocatalytic (PC) materials has attracted much interest as a sustainable method for pollutant degradation, water splitting, and synthetic fuel production.Reference Hoffmann, Martin, Choi and Bahnemann1–Reference Tang, Zou and Ye3 Nanocrystalline forms of wide band gap semiconducting oxides, and primarily, the anatase form of TiO2, is by far the most studied of these materials.Reference Hoffmann, Martin, Choi and Bahnemann1, Reference Fujishima, Zhang and Tryk4 TiO2 requires, however, ultraviolet (UV) light to excite the chemically active valence electrons to the conduction band, and solar-based conversion is thus limited to ∼4% of the sunlight. Since it is desirable to exploit also visible light, a second generation of efficient UV–visible active PC materials is currently sought, where, e.g., low-dimensional doped TiO2, WO3, and mixed metal oxides, with and without additions of noble metals for enhanced electron–hole pair separation, have received considerable attention.Reference Zheng, Ou, Strano, Kaner, Mitchell and Kalantar-Zadeh5–Reference Chen and Mao8 WO3 is a promising material for a wide range of environmental and energy applications. The electrochromic effect of WO3 has been widely studied, and the material is much used in fabrication of smart windows.Reference Deb9–Reference Granqvist11 PC oxidation for indoor air purification and self-cleaning is today considered in several applications in the built environment.Reference Smith and Granqvist12, Reference Zhao and Yang13 Recently, WO3 has drawn attention because of its high efficiency in PC activity under daylight illuminationReference Shi, Huang, Tian, Lv, Li, Ye and Zou14–Reference Cross, Parkin and O’Neill17 and its ability to photodegrade a wide range of environmental pollutants.Reference Abe, Takami, Murakami and Ohtani16, Reference Waldner, Bruger, Gaikwad and Neumann-Spallart18, Reference Cross, Parkin, White and Williams19 Nano-WO3 is reported to have much higher PC activity compared to bulk WO3 photoelectrodes.Reference Zheng, Ou, Strano, Kaner, Mitchell and Kalantar-Zadeh5, Reference Santato, Ulmann and Augustynski20 This is related to the different mechanism of charge separation and charge transport in the nanocrystalline semiconductor films, which is a subject of continuing discussion.Reference Hagfeldt and Grätzel21
The PC activity depends on the electronic structure, which is related to crystal structure and surface morphology. WO3 exists in several phases, which differ with respect to each other by the tilting and displacement of the atoms in the octahedral building blocks that comprise the WO3 structure. The thermodynamically favored phase is reported to change with temperature (at standard pressure) for crystalline bulk WO3 as follows: monoclinic Pc (ε-WO3) up to 230 K, triclinic P1 (δ-WO3) 230–300 K, monoclinic P21/n (γ-WO3) 300–623 K, orthorhombic Pnma (β-WO3) 623–1020 K, tetragonal P4/ncc (α-WO3) 1020–1171 K, and, finally, tetragonal P4/nmm (α-WO3) to the melting point at 1700 K. Reference Howard, Luca and Knight22–Reference de Wijs, de Boer and de Groot26 The stability of each of these phases is modified by preparation procedures. For nanocrystalline thin films, the detailed growth conditions are critical, including type of substrate, temperature, and pressure. Apart from high surface area, which is beneficial in many environmental applications, nano-WO3 exhibits structures and morphologies with unique properties that do not exist in bulk. The small size of grains in a material can substantially influence charge transport, electronic band structure, and optical properties. Nano-WO3 is readily reduced, and nonstoichiometry is reported to involve structural changes.Reference Polaczek, Pekala and Obuszko27–Reference Salje, Rehmann, Pobell, Morris, Knight, Herrmannsdoerfer and Dove29 Substoichiometry gives rise to polarons, which change the optical properties and increase the absorption in the near-infrared (NIR) spectral region.Reference Salje, Rehmann, Pobell, Morris, Knight, Herrmannsdoerfer and Dove29, Reference Salje30 For small values of substoichiometry, x, crystals of WO3−x are reported to undergo a structural phase transition from the room temperature δ phase to the low temperature ε phase at T ∼ 250 K.Reference Bullett31 The δ phase shows metallic behavior, and the ε phase has insulating properties for the electron/hole carriers.Reference Salje32 Reported values for the electronic band gap of nano-WO3 vary considerably from E g = 2.6 to 3.25 eV,Reference Hjelm, Granqvist and Wills33, Reference Chatten, Chadwick, Rougier and Lindan34 and this is probably due to a combination of one or several of the effects discussed above. Further, the small size of nano-WO3 crystallites will enhance the surface energy of the system.Reference Krishnamachari, McLean, Cooper and Sethna35, Reference McLean, Krishnamachari and Peale36 With higher surface energy, the melting point and temperature for phase transitions decrease.Reference Boulova and Lucazeau37
In this article, we report on the preparation and characterization of the structural, optical, and PC properties of nano-WO3 films made with reactive dc magnetron sputtering. This method offers freedom in deposition conditions and is suitable to span a large parameter space to address some of the issues discussed above. In particular, the physical properties of nano-WO3 films have been studied as a function of working pressure, P tot. The photodegradation of stearic acid (SA) was measured to determine the degradation rate and quantum yield for the different nano-WO3 films prepared at different P tot.
II. EXPERIMENTAL SECTION
A. Sample preparation
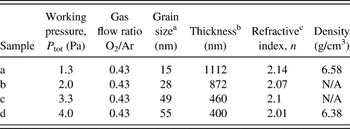
Nanocrystalline tungsten oxide thin films were prepared by reactive dc magnetron sputtering using a versatile deposition system based on a Balzers UTT 400 unit (Balzers AG, Balzers, Liechtenstein). The sputter target was a 5-cm-diameter plate of W with 99.95% purity (Plasmaterials, Inc., Livermore, CA). Sputtering was conducted in a plasma of Ar and O2. The purity of the gases was 99.998%, and the sputtering power was set to 200 W with the substrates positioned 13 cm from the target. The total working pressure was varied between P tot = 1.3, 2.0, 3.3, and 4.0 Pa, respectively. The substrate temperature was maintained at T s = 553 K, and the O2/Ar gas flow ratio was kept fix at 0.43. The deposition time was set at 35 min, and the sample holder was rotating with constant speed to obtain uniform thickness of the films. The samples were subsequently postannealed at T a = 673 K for 1 h. Films were sputtered on 13-mm-diameter CaF2 substrates (Crystran Ltd., Poole, UK). The CaF2substrates were cleaned with deionized water and ethanol before sputtering.
B. Material characterization
The surface morphology and grain sizes of the formed nanostructures were characterized with scanning electron microscopy (SEM), using a LEO 1550 FEG instrument (LEO Electron Microscopy Ltd., Cambridge, UK) with in-lens detector operating at 10 kV.
The crystalline structure of the films was determined by x-ray diffraction (XRD). For thin films, grazing incidence x-ray diffraction (GIXRD) was used (Siemens D5000 Th-2Th, PANalytical B.V., Almelo, Netherlands), using Cu Kα (λ = 1.54051 Å) radiation. Scans were taken in the range from 10 to 90° (2θ). Broadening of the diffraction peaks due to the average grain size, L, and strain, ε, are present simultaneously and were extracted from experimental data using the Williamson–Hall methodReference Williamson and Hall38:
 $$\cos ({\rm{\theta }})({\rm{\beta }}_{\rm{c}} - {\rm{\beta }}_{\rm{i}} ) = {{k{\rm{\lambda }}} \over L} + \left\langle {{\rm{\varepsilon }}^2 } \right\rangle ^{1/2} \sin ({\rm{\theta }})\quad,$$
where ε = ΔL/L is the strain in the [hkl] direction, k ≈ 0.9 is the geometric shape factor for a spherical scatterer, λ is the x-ray wave length, βc the full width at half maximum, FWHM, of the XRD peak, βi the instrumental broadening, and θ the diffraction angle. The program XPERT PRO was used to remove the contribution from the Cu Kα2 line and determine βc. Peaks in the diffractograms were fitted to a weighted superposition of the Gauss and Cauchy functions.
Raman spectra were recorded in backscattering geometry using a confocal Raman microscope (HR800 Labram; Horiba Jobin-Yvon, Lille, France). A 514-nm Ar laser was directed through a 50x long working distance objective (NA = 0.45), using a 600 grooves/mm grating, yielding a spectral resolution of approximately 3.5 cm−1. A low laser power (5 mW) was used to ensure that no structural modifications of the samples occurred due to local laser heating. The spectra were calibrated against the Si peak at 520.7 cm−1of a Si(110) wafer.
Composition, stoichiometry, and density were determined using the Rutherford backscattering spectroscopy (RBS) on films deposited on C substrates. The measurements were carried out at the Uppsala Tandem Accelerator Laboratory using 4He ions at energy of 2 MeV. An azimuthal angle α = 7° was applied to avoid the risk of channeling into the crystals. The ions were backscattered at an angle of 172°. Data were analyzed with the program SIMNRA, which yielded the number of atoms per cm2 (N s) and the number of atoms in a formula unit (N). For a perfect stoichiometric film, the number of atoms in a WO3 unit is N = 4, and for understoichiometric films, N = 4 − X, where X is the number of missing O atoms. Film density, δ, was calculated from the formula:
 $${\rm{\rho }} = {{MN_{\rm{s}} } \over {NdN_{\rm{A}} }}\quad,$$
where M is the mass per mol of formula unit, N A is the Avogadro constant, and d is the film thickness (in cm).
Optical properties were measured with a Perkin-Elmer Lambda 900 double-beam UV/Vis/NIR spectrophotometer (PerkinElmer, Waltham, MA) equipped with an integrating sphere and a Spectralon reflectance standard. The absorptance, A(λ), was determined from measured transmittance, T(λ), and reflectance, R(λ), according to:
 $$A({\rm{\lambda }}) = 1 - T({\rm{\lambda }}) - R({\rm{\lambda }})\quad,$$
and using appropriate corrections for diffuse scattering and instrument calibration.Reference Roos39
The film thickness, d, was determined both from surface profilometry (Tencor Alpha Step 200, SPEC, Santa Clara, CA) and calculated from the interference fringes seen in optical transmittance data, following the method of SwanepoelReference Swanepoel40:
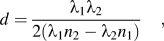 $$d = {{{\rm{\lambda }}_1 {\rm{\lambda }}_2 } \over {2({\rm{\lambda }}_1 n_2 - {\rm{\lambda }}_2 n_1 )}}\quad,$$
where n 1 and n 2 are the refractive indices at two adjacent transmittance maxima at λ1 and λ2, respectively. The refractive index of the of CaF2 substrate, s, was determined from transmittance measurements of the bare substrate. From the transmittance maxima, T M, and minima, T m, of the interference fringes seen in the spectrum for WO3 thin films on CaF2 substrates, a refraction number, N, was calculated according to:
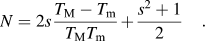 $$N = 2s{{T_{\rm{M}} - T_{\rm{m}} } \over {T_{\rm{M}} T_{\rm{m}} }} + {{s^2 + 1} \over 2}\quad.$$
The refractive index, n, of the films was then calculated from the equation:
 $$n = [N + (N^2 - s^2 )^{1/2} ]^{1/2} \quad.$$
From T(λ) and R(λ), the absorption coefficient, α(λ), can be determined according toReference Hong41:
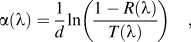 $${\rm{\alpha }}({\rm{\lambda }}) = {1 \over d}\ln \left( {{{1 - R({\rm{\lambda }})} \over {T({\rm{\lambda }})}}} \right)\quad,$$
where d is the thickness of the film.
C. Photodegradation measurements
Photodegradation of SA (C18H36O2; Merck, Darmstadt, Germany) was measured with Fourier transform infrared (FTIR) spectroscopy operated in transmission mode using a Bruker IFS66v/S spectrometer (Bruker, AZ Wormer, Netherlands). FTIR spectra were recorded with 4 cm−1 resolution using 30 s scan time per spectrum and 30 s dwell time between consecutive spectra. Application of SA was done following earlier reported methods to determine self-cleaning properties of TiO2.Reference Paz, Luo, Rabenberg and Heller42, Reference Mills and McFarlane43 SA was applied to the surface of the WO3 films by pipetting 10 mm3 of 0.8 mM methanol solution followed by spin coating at 1500 rpm. FTIR spectra were, after appropriate baseline corrections, integrated between 2700 and 3000 cm−1, which contains the ν(C–H) vibrations in SA. The number of SA molecules per cm2 per integrated absorbance unit (1 A.U.) in this wave number region has previously been reported to be N 1A.U. = 3.17 × 10¹⁵ molecules/cm2 for TiO2.Reference Paz, Luo, Rabenberg and Heller42 The number of SA adsorption sites on the WO3 surface were estimated using an organic dye molecule D35 (C54H58N2O6S; Merck; M w = 863.11 g/mol) as previously reported.Reference Hagberg, Jiang, Kaufmann, Gabrielsson, Linder, Marinado, Brinck, Hagfeldt and Sun44 D35 has one anchoring carboxyl group just like SA. A sample of WO3 thin film was immersed for 12 h in 0.2 mM solution of dye dissolved in ethanol. Absorbance spectra were measured using a Perkin-Elmer Lambda 900 double-beam UV/Vis/NIR spectrophotometer. The absorbance of the bare WO3 thin film on a CaF2 substrate was subtracted to obtain the absorbance due to D35. To calibrate the absorbance, a dye solution of 0.01 mM in ethanol was recorded on a HR-2000 Ocean Optics fiber optics spectrophotometer (Ocean Optics, Dunedin, FL). A normal quartz cuvette (1 cm path length) was used for the measurement of dye solution. From the Beer–Lambert’s law, I = I 0 × 10–εcd, where ε is the extinction coefficient (εD35 = 31300 M−1/cm), c the concentration, and d the thickness, the D35 concentration on the WO3 film was determined to 0.0013 mM, which corresponds to 0.0013 μmol/cm2 or 7.82 × 10¹⁴ molecules/cm2.
A Hg arc lamp operated at 300 W was used as irradiation source. Band-pass filters (Oriel Instruments, Stratford, CT) centered at 546, 436, 406, and 313 nm, respectively, each with a bandwidth of Δλ = 10 nm, were used to measure the photodegradation rate at different wave lengths in the band gap region. To reduce the infrared part of the lamp spectrum, the light was first directed through a 75-mm-long water filter (Milli-Q water, 18.2 MΩ). The light was collected into a fused silica fiber bundle and directed onto the sample cell through a CaF2 window at an angle of 25° to the surface normal. The photon power was measured to be 102 mW/cm2in the spectral range between 300 and 800 nm using a thermopile detector (Ophir, North Andover, MA).
A lower limit of the quantum yield, Φ (assuming all absorbed photons in the film reach the surface), was calculated according to:
 $$\Phi = {{N_{1{\rm{A}}{\rm{.U}}{\rm{.}}} A_0 k_{{\rm{dec}}} } \over {\int {F({\rm{\lambda }})(1 - e^{ - {\rm{\alpha }}({\rm{\lambda }})d} )d{\rm{\lambda }}} }}\quad,$$
where A 0 is the integrated absorbance between 2700 and 3000 cm−1 due to SA at t = 0 min, k dec is the degradation rate (s−1), F(λ) is the photon flux (s−1/cm2),  $(1 - e^{ - {\rm{\alpha }}({\rm{\lambda }})d} )$ is the absorption in the WO3 film, and d is the film thickness.
In a second experiment, simulated solar light was used using a Xe arc lamp source operated at 200 W and filtered through a set of air mass filters (AM1.5). The light source setup was otherwise identical to the one described above. The photon power was measured to be 100 mW/cm2in the wave length range 300–800 nm in these experiments.
III. RESULTS AND DISCUSSION
A series of WO3 thin films were prepared by reactive dc magnetron sputtering at different working pressures (Table I). All samples showed high optical transparency after postannealing at T a = 673 K for 1 h. The samples sputtered at low working pressure, P tot = 1.3 and 2.0 Pa, showed a light bluish color, whereas films prepared at P tot= 3.3 and 4.0 Pa showed a slight yellow to red coloring.

A. Scanning electron microscopy
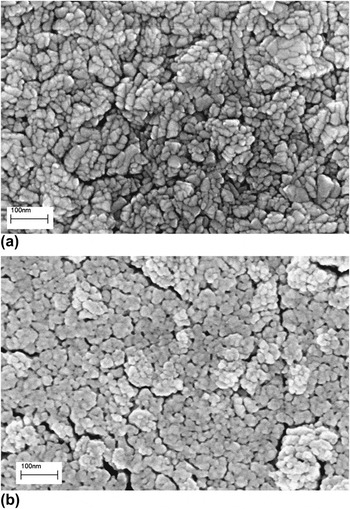
Figure 1 shows SEM images of sputtered nano-WO3 films prepared at low and high P tot, respectively. It is evident from Fig. 1(a) that films with rectangular shaped structures are formed at low P tot. Inspection of the images reveals that sizes of these structures are approximately between 30 and 60 nm. At P tot = 4.0 Pa, the films appear to consist of structures with rounder shapes [Fig. 1(b)]. The underlying substrate is clearly seen in the cracks between the structures, which is consistent with lower deposition rate with increasing P totand hence thinner films. The image indicates a relatively porous morphology, where the grain boundaries are smeared out.
SEM images of nano-WO3 thin films sputtered at (a) P tot = 1.3 Pa and (b) P tot = 4.0 Pa. The films were sputtered at T s = 553 K and postannealed at T a= 673 K for 1 h.

B. Rutherford backscattering spectroscopy
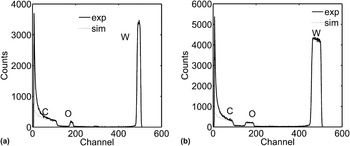
Figure 2 shows spectra from RBS measurements of films prepared at low and high P tot, respectively. Also shown in Fig. 2 are corresponding simulated spectra using SIMNRA, from which the stoichiometry and density of the films were obtained.Reference Mayer45 In all cases, the nano-WO3 films exhibited a stoichiometry of WO3−x with |x| < 0.1. However, within the uncertainty in these calculations (4%), the variation in x of nano-WO3 films due to different P tot could not be distinguished. The calculated density was determined to be δ = 6.58 g/cm3 and δ = 6.38 g/cm3 for films prepared at P tot = 1.3 and 4.0 Pa, respectively. The RBS results show that high sputtering rates (i.e., low P tot) result in more dense films, while low sputtering rates (i.e., high P tot) result in films with lower density. Compared with the bulk density of WO3 (δ = 7.14 g/cm3), it is seen that the film porosity is between 8% and 11%, i.e., the films are rather compact. These results qualitative corroborate the SEM results presented above.
RBS spectra of nano-WO3 thin films on carbon substrates, sputtered at (a) P tot = 1.3 Pa and (b) P tot= 4.0 Pa, respectively.

C. X-ray diffraction
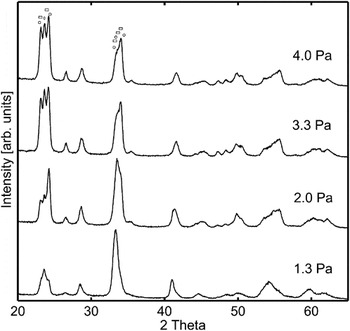
Figure 3 depicts XRD spectra of nano-WO3 films at different P tot. The structural distortions of the corner-sharing WO6 octahedra comprising the WO3 unit cell are quite complex and make definitive assignments of WO3 phases from XRD data alone rather difficult, despite the apparent simple stoichiometry of WO3. In Fig. 3, the most interesting part of the spectra, acquired between 2θ = 10° and 90°, is extracted. The first diffraction peaks in Fig. 3 correspond to reflection from the (002), (020), and (200) planes, respectively, and are in good agreement with reported diffractograms for the δ-WO3 and monoclinic γ-WO3 phases.Reference Woodward, Sleight and Vogt46 These two phases are very similar with respect to angular distortions and atomic distances and are thus expected to have similar thermodynamic stability. Indeed, both phases have been reported to coexist at room temperature and are sensitive to the way the samples are prepared, e.g., T s, T a, and P tot.Reference Woodward, Sleight and Vogt46–Reference Souza Filho, Mendes Filho, Freire, Ayala, Sasaki, Freire, Melo, Julião and Gomes48 However, the (002) diffraction angle in ε-WO3 at 23.19° is close to the corresponding reflections in the γ-WO3 and δ-WO3 phases,Reference Salje, Rehmann, Pobell, Morris, Knight, Herrmannsdoerfer and Dove29 which occur at 23.12°,Reference Woodward, Sleight and Vogt46 and the experimental value of the peak at 23.15° may indicate mixing of the low temperature monoclinic ε-WO3 phase at low P tot. Supporting this argument is the observation of the peak at 24.25°, which is shifted to lower diffraction angles compared with references for the monoclinic γ-WO3 (200) planes at 24.37° and triclinic δ-WO3 (200) planes at 24.33°.Reference Woodward, Sleight and Vogt46 This may be due to a feature from the low temperature monoclinic phase ε-WO3 (110) planes at 24.11°. Finally, it is apparent that the intensity of the peak corresponding to the (020) planes decreases relative to peaks from diffraction planes of (002) and (200) with increasing P tot. In the range 2θ = 33–35°, the highest intensity occurs at P tot = 1.3 Pa, and the diffractogram resembles the ε-WO3 phase, which has an analogous XRD pattern, and a dominant peak at 33.34°, corresponding to the (−112) reflection,Reference Salje, Rehmann, Pobell, Morris, Knight, Herrmannsdoerfer and Dove29 again supporting significant ε-WO3 phase mixing at low P tot. With increasing P tot, the relative intensity of the (−112) reflection decreases compared to the adjacent peak from diffraction planes of (202) at 34.08, which eventually dominates the XRD spectrum at P tot = 4.0 Pa, and corresponds to reflection in either the δ-WO3 or the γ-WO3 phase, which is reported to occur at 34.08° and 34.17°, respectively. Which one of these latter two phases is most abundant cannot be determined from the XRD data. The phase transitions in nano-WO3 films occur gradually rather than abruptly, as in bulk WO3, and result in a range of coexisting phases depending on exact preparation conditions. However, previous reports have shown that the temperature range of coexisting δ and ε phases is much larger than the simultaneous existence of δ and γ phases,Reference Woodward, Sleight and Vogt46 which may indicate that the ε and δ phases are the dominant phases in our nano-WO3films.
XRD patterns of the nano-WO3 thin films prepared at different P tot = 1.3 – 4.0 Pa. Circles correspond to diffraction peaks due to γ-WO3 [(from the left (002), (020), (200), (−202), (022) and (202)]. Squares correspond to diffraction peaks due to ε-WO3[(from the left (002), (110), (−112), (200) and (112)].

In Fig. 3, it is seen that the intensity of the diffraction peaks in the 22.5–24.5° range increases with increasing P tot, whereas the intensity of the peaks in the range 33–35° decreases. We conclude that the nano-WO3 exhibits a preferred growth direction depending on P tot, which changes with increasing pressure from the [202] and [−112] directions to the [020] and [200] directions.
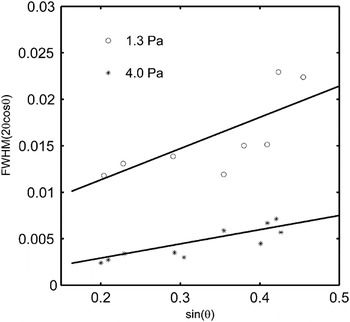
Average grain size and strain were calculated from the broadening of the diffraction peaks using Eq. (1). Figure 4 shows a Williamson–Hall plot, where the experimental data are fitted by straight lines. The strain was obtained from the slope of the lines and the grain size from their intersection with the y-axis. It is seen that strain is significant for films sputtered at 1.3 Pa with ε ≈ 3.6%, while it is ε ≈ 1.7% for films sputtered at 4.0 Pa. The high strain in the film sputtered at 1.3 Pa is probably caused by imperfections such as oxygen vacancies, phase mixing with the ε-phase, and may also be related to its higher density. The average grain sizes are given in Table I. The linear fit is more uncertain for the sample prepared at 1.3 Pa due to overlapping reflection peaks, which are difficult to unambiguously separate.
Williamson–Hall plot using data on diffraction angle and broadening from experimental XRD spectra. Fits to Eq. (1) are given by the straight lines. The approximate linear relations indicate strain effects in films sputtered at 1.3 Pa, ε = 3.6% with average grain size L = 15 nm and at 4.0 Pa, ε = 1.7% and L = 55 nm.

Low P tot and hence high sputter rate, i.e., high kinetic energy of the particles bombarding the surface, may result in slight compression of the films, which is reported to influence the WO3 structure and phase.Reference Cazzanelli, Vinegoni, Mariotto, Kuzmin and Purans47 Under these sputter conditions, significant amounts of oxygen vacancies may also be created, which give rise to polarons (see below).Reference Chatten, Chadwick, Rougier and Lindan34 In nano-WO3 thin films, both grain size and substrate interactions are suggested to change the relative thermodynamic stability of WO3 phases.Reference Boulova and Lucazeau37 A transition to a compressed phase can be obtained either by using high external pressure or by accumulating internal compressive strain due to polarons.Reference Xu, Carlson and Norrestam23, Reference Cazzanelli, Vinegoni, Mariotto, Kuzmin and Purans47 It has been reported that slightly reduced WO3−x, with x ≈ 0.05, promotes formation of the ε phase,Reference Salje, Rehmann, Pobell, Morris, Knight, Herrmannsdoerfer and Dove29 qualitatively consistent with our data. There is no change of the octahedral tilt angle between the δ-WO3 and ε-WO3 phases. Instead, the position of the central W atom is shifted in ε-WO3, which develops a spontaneous polarization along the a-axis in the unit cell. Of all WO3 phases, ε-WO3 is the only structure, which is noncentrosymmetric. This results in variations of the O–W–O atom distance along the [110] direction, which affect the electrical and optical properties of the ε-phase. In particular, higher E g for ε-WO3 relative to δ-WO3has been reported.Reference Woodward, Sleight and Vogt24
D. Raman spectroscopy
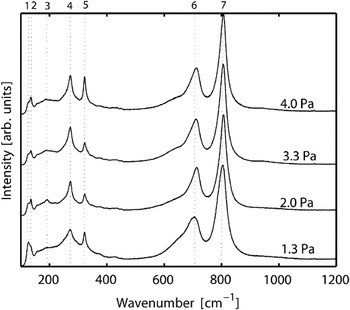
Figure 5 shows Raman spectra of nano-WO3 films prepared at different P tot. Peaks 6 and 7 are typical for crystalline WO3 and are common to several WO3 phases. These correspond to the symmetric and asymmetric ν(O–W–O) stretching modes.Reference Daniel, Desbat, Gerand, Figlarz and Lassegues49, Reference Souza Filho, Freire, Pilla, Ayala, Mendes Filho, Melo, Freire and Lemos50 Peak 6 has a shoulder at lower wave numbers, which has a maximum at approximately 645 cm−1, characteristic for the monoclinic ε-phase.Reference Souza Filho, Freire, Pilla, Ayala, Mendes Filho, Melo, Freire and Lemos50, Reference Salje51 It should be noted that this vibrational band also has been discussed in the literature as being due to hydrated tungsten oxide.Reference Daniel, Desbat, Gerand, Figlarz and Lassegues49, Reference Santato, Odziemkowski, Ulmann and Augustynski52 Our combined RBS, XRD, and Raman spectroscopy data give, however, no evidence of hydrated tungsten oxide, and this can therefore be ruled out. Peaks 2, 4, and 5 correspond to the δ(W–O–W) bending vibrations in monoclinic γ and triclinic δ phases.Reference Salje51 The intensity of peak 5 can be correlated to the amount of the monoclinc γ-phase according to some reports.Reference Souza Filho, Freire, Pilla, Ayala, Mendes Filho, Melo, Freire and Lemos50 The relatively large intensity of peak 5 and the relatively broad peaks 6 and 7 compared to bulk data may also be indicative of the nanoporosity in the films. A relatively high intensity of the band at approximately 330 cm−1 is, e.g., reported for W18O49compounds.Reference Hayashi, Sugano, Arai and Yamamoto53
Raman spectra of nano-WO3 films prepared at different P tot. Peaks are labeled 1 = 125 cm−1, 2 = 136 cm−1, 3 = 184 cm−1, 4 = 274 cm−1, 5 = 323 cm−1, 6 = 715 cm−1, and 7 = 807 cm−1.

Peak 1 agrees with previous reports of the presence of ε-WO3 phase,Reference Hayashi, Sugano, Arai and Yamamoto53 consistent with XRD data, but we note that a similar peak has previously also been interpreted as being due to the triclinic δ-phase.Reference Cazzanelli, Vinegoni, Mariotto, Kuzmin and Purans47 However, the presence of a small peak at 184 cm−1 (peak 3), which previously has been assigned to the ε phase,Reference Souza Filho, Mendes Filho, Freire, Ayala, Sasaki, Freire, Melo, Julião and Gomes48 supports the interpretation of peak 1 as being due to an ε phase. In spectrum obtained at P tot = 2.0 Pa in Fig. 5, the intensity of peak 1 is observed to decrease together with the shoulder at 645 cm−1, compared with spectrum obtained at 1.3 Pa. Simultaneously, the intensity of peak 2 increases, which indicates a higher fraction of the δ or γ phase as P tot increases. In comparison with XRD data in Fig. 3, we see that similar changes occur between P tot = 1.3 and 2.0 Pa, where the (002) peak increases. We conclude that a structural transition occurs somewhere between these two values of P tot, where the relative fraction of δ or γ phase increases at the expense of the ε-phase.
A weak vibration at 940 cm−1 is observed at 3.3 Pa and 4.0 Pa in Fig. 5, which can be assigned either to the W–O surface modeReference Kuzmin, Purans, Cazzanelli, Vinegoni and Mariotto54 or a ν(W = O) mode due to terminal W = O surface groups, which are reported to be located at about 950 cm−1.Reference Boulova and Lucazeau37, Reference Santato, Odziemkowski, Ulmann and Augustynski52 Since this peak appears on the thinner films, which have higher porosity, it is tempting to attribute it to surface W = O species. It qualitatively correlates with the SEM, RBS, and XRD results above, i.e., the films become more porous with increasing P tot. This is also qualitatively supported by the concomitant increase of the FWHM of peak 6 and 7, which indicates a decrease of the structural order in the films.
E. UV–vis spectroscopy
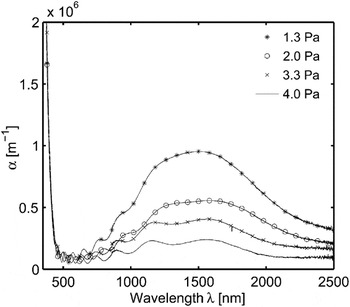
Absorption in the films was calculated from transmittance and reflectance measurements. Figure 6 shows the absorption coefficient in the wave length range 300–2500 nm for nano-WO3 films prepared at different P tot. The oscillations, mainly present in the 500–1000 nm wave length range, are interference fringes that are not compensated for by Eq. (7). T(λ) is measured at normal incidence and R(λ) at a slightly different angle. It is obvious that there is significant absorption in the NIR region, exhibiting a broad peak maximum centered at about 1500 nm, consisting of (at least) two absorption bands. With increasing P tot, the NIR absorption decreases. At P tot = 3.3 and 4.0 Pa, only two weaker NIR bands are observed at 1200 and 1600 nm. The absorption in this range has earlier been attributed to polarons.Reference Augustin and Mott55, Reference Iguchi and Miyagi56 Maxima near 1450 and 1800 nm have previously been observed in a substoichiometric WO3−x ε phase, as reported by Salje.Reference Salje30 These peaks were ascribed to two types of polarons that occur simultaneously, one extended mobile type and the other more localized.
The absorption coefficient α in the wave length range 300–2500 nm for nano-WO3 thin films prepared at different P totbetween 1.3 and 4.0 Pa.

From the results above, a slightly substoichiometric and strained film structure, which consists of a small amount of the ε phase, is inferred at low P tot. Both the strain and the ε phase gradually disappeared at higher P tot, as evidenced by XRD and Raman spectroscopy. The strength of the polaron absorption indicates that x ≈ 0.01 at 1.3 Pa and decreases with increasing P tot, in fair agreement with the RBS results. This estimate was obtained from a comparison with published polaron absorption strengths for Li–WO3 thin films.Reference Larsson, Sernelius and Niklasson57 It is thus evident that optical transmittance and reflectance measurements are much more sensitive to detect small substoichiometries than RBS.
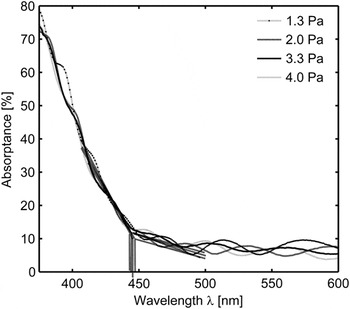
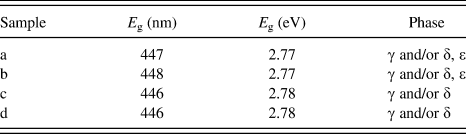
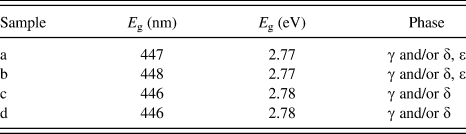
In a simple model, the band gap can be approximated from the slope of the absorptance. We refer to a forthcoming publication for a detailed account of the nature of the interband excitations in WO3 and the existence of band gap states in nano-WO3 films. Here, it suffices to note that band gap states contribute significantly to the absorption just below the optical band edge. Figure 7 shows that all absorptance curves meet at ∼447 nm or ∼2.78 eV. The band-to-band excitations of electrons from the valence band to the conduction band are seen as the steep slope in the short wave length range 300–445 nm. At ∼447 nm, the inclination of the slope clearly changes, as marked by the dashed lines in Fig. 7. This marks the demarcation energy, which may be used to approximate the transition between the Urbach tail,Reference Ferlauto, Ferreira, Pearce, Wronski and Collins59 and the absorption due to electronic interband transitions. The demarcation energies deduced from the analysis are shown in Table II. The small absorption in the range 448–500 nm is due to states in the band gap. These states can be caused by the mixing of phases and variations in bond lengths and angles (here evidenced by mixed phases inferred from XRD and Raman spectroscopy data), grain boundaries (here, the grain sizes deduced from XRD are generally smaller than SEM structures, suggesting that the SEM structures contain several grains), or strain effects (here inferred from XRD data and polaron absorption at low P tot). Localized band gap states give rise to a new regime beyond the extended band edges. Photoexcited electrons and holes can interact with these localized states and contribute to photoinduced processes. In Sec. III. F, we explore whether these contribute to photodegradation of SA in comparison with interband excitations across the band edge.
Absorptance of nano-WO3 films prepared at different P totbetween 1.3 and 4.0 Pa around the optical band edge in the wave length region 300–600 nm.

Band gap energy, E g, deduced from UV–vis spectrophotometry and crystalline phases derived from XRD and Raman spectroscopy for nano-WO3thin films.
F. Photodegradation of SA
Figure 8 shows the photodegradation of SA as a function of solar light irradiation time in a log-linear plot. It is apparent that the initial decay of the integrated SA absorbance between 2700 and 3000 cm−1 as a function of irradiation time obeys first-order kinetics. In comparison with previous work on SA spin coated on TiO2 using similar procedures, where multilayer SA was inferred,Reference Paz, Luo, Rabenberg and Heller42 the first-order reaction kinetics indicates that the SA coverage in our case is in the monolayer regime. This is also quantitatively supported by the measured absorbance on the nano-WO3 films, using the calibrated value for the integrated absorbance unit,Reference Paz, Luo, Rabenberg and Heller42 and comparing with the estimated number of surface sites from the D35 titration measurements presented above. With these estimates, we obtain a maximum SA coverage of approximately 0.5 monolayer.
Semilogarithmic plot of the normalized absorbance due to SA as a function of irradiation time for nano-WO3 films prepared at different P tot: (A) 4.0 Pa and (B) 1.3 Pa. A is the integrated absorbance between 2700 and 3000 cm−1 due to the μ(C–H) bands at time, t, and A 0 is the absorbance at t = 0. Simulated solar light (AM1.5) was used as light source.

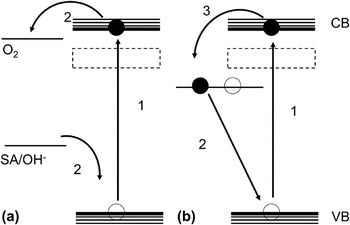
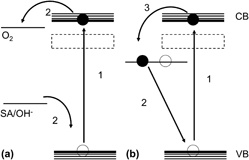
From Fig. 8, it is clear that k dec is more than twice as high at P tot = 4.0 Pa compared to 1.3 Pa, under otherwise identical conditions. These observations correlate with the findings above that the low P tot nano-WO3 films exhibit mixed phase structures, which are associated with strong polaron absorption due to the presence of a substoichiometric and strained film structure. This suggests that even the presence of small amounts of excess electrons in the band gap at approximately 1 eV below conducting band (CB), which give rise to the polaron absorption bands in Fig. 6, effectively can quench photoexcited electron–hole pairs. We propose a possible mechanism that may be responsible for the quenching of photoexcited electron–hole pairs in slightly substoichiometric WO3. In Fig. 9, we schematically depicted this mechanism. Here, electrons populating localized polaron states rapidly recombine with photoexcited holes. Subsequently, photoexcited CB electrons repopulate these states. This is a relatively fast process compared with the interfacial charge transfer processes of CB electrons to the affinity level on adsorbed O2. The efficiency of this process depends on the character of the polarons and how extended these states are. The small substoichiometry deduced from the polaron absorption may nevertheless, despite its low value x ≈ 0.01, affect e–h pair recombination if the spatial extension of the polaron is large. This shows the importance of precise control of the materials synthesis to prepare photoactive WO3nanostructures.
Schematic pictures of the electronic states in WO3 responsible for photodegradation of organic molecules in air. (a) Excitation of a VB electron to the CB in stoichiometric WO3 and interfacial charge transfer (O2 reduction and organic oxidation) to adsorbed molecules at the surface. (b) Electron–hole pair excitation in substoichiometric WO3–xwith localized polaron states ∼1 eV below CB gives rise to an electron–hole pair recombination process. The numbers indicate the sequence of reactions. The dashed square represents the location of band gap states responsible for the visible light photoactivity.

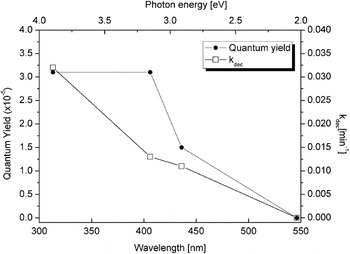
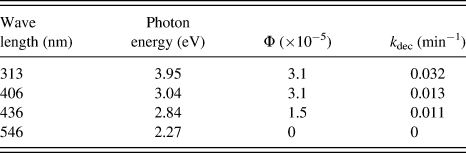
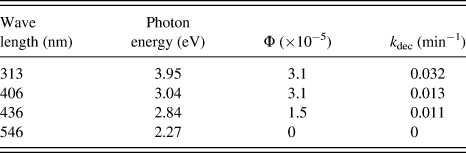
Figure 10 shows the PC SA degradation rate, k dec, and the quantum yield, Φ, calculated by means of Eq. (8) at different wave lengths for a nano-WO3 film prepared at P tot = 3.3 Pa. It is seen that k dec decreases continuously up to 436 nm and is zero at 546 nm. Visible light active photodegradation is proved by the nonzero k dec = 0.011 min−1at 436 nm, about one-third of the value at UV photon energies (313 nm).
Quantum yield (left ordinate) and degradation rate k dec (right ordinate) as a function of photon energy (upper abscissa) and wave length (lower abscissa) for a nano-WO3 film prepared at P tot= 3.3 Pa.

Table III summarizes the photodegradation data. It is, however, more instructive to look at Φ. The low Φ values compared to measurements in colloidal solutions can be attributed to the inefficient collection of photoexcited electron–hole pairs in the SA/nano-WO3 film system, where excitations deep in the film must diffuse to the surface of the film to take part in SA photodegradation. Nevertheless, we find that Φ is about 50% lower at 436 nm than at UV energies and is equal at 406 and 313 nm. This suggests that there exists an energy threshold comparable to the demarcation energy estimated from the absorptance data. This gives further support that E g is around 2.8 eV, in good agreement with previous reports.Reference Migas, Shaposhnikov, Rodin and Borisenko60, Reference Gillet, Aguir, Lemire, Gillet and Schierbaum61 Further, a possible explanation of the lower Φ at 436 nm, may be that the states giving rise to absorption at hν < 2.9 eV, lie below the affinity level of O2, so that only hole oxidation occurs at these smaller energies. Hence, in this model, the photooxidation reaction is not truly PC at these low photon energies, a hypothesis that warrants further studies.
Quantum yield and photodegradation rate of nano-WO3 film prepared at P tot= 3.3 Pa at different excitation wave lengths.
IV. CONCLUSION
Nanostructured WO3 films were prepared using reactive dc magnetron sputtering at different working pressures, P tot. At high P tot, stoichiometric nano-WO3 films are formed, which exhibit a structure consisting of δ-WO3, possibly coexisting with γ-WO3. At low P tot, the nano-WO3−x films are slightly substoichiometric (|x| < 0.1), exhibit significant strain, have higher density, and contain significant amounts of the ε-WO3 phase. These films are also associated with strong polaron absorption. The optical properties of nano-WO3 films prepared at low and high P tot, respectively, are very different despite their structural similarities and are manifested in their different color and NIR absorption. The energy band gap, defined by the demarcation energy, is, however, similar, E g ≈ 2.8 eV (445 nm). The existence of band gap states was inferred from weak absorption in the 450–500 nm region. Comparisons of the photodegradation rate at different P tot showed that photodegradation rate was significantly reduced at low P tot. This is attributed to substoichiometry and existence of a strained ε phase characterized by an efficient recombination process, whereby excess localized electrons in the band gap recombine with photoexcited electron–hole pairs. Wave length-resolved photodegradation measurements of SA showed that the nano-WO3 films were visible light active up to wave lengths of at least 436 nm. A lower bound for the quantum yield was determined to be approximately 3 × 10⁻⁵ for films prepared at high P tot at photon energies larger that the band gap energy. The quantum yield dropped to 50% above the band gap, at 436 nm, which is tentatively attributed to inefficient O2reduction due to photon absorption into low lying band gap states.
ACKNOWLEDGMENTS
The authors thank Christian Lejon and Andreas Mattsson for assistance with the PC measurements, Per Petersson with RBS measurements, and Erik Johansson for fruitful discussions. This work was financially supported by Swedish Research Council Grant No. 2010-3514.