Key Points
-
• Outbreaks which began before widespread vaccine uptake may be different from outbreaks which began afterward.
-
• As more infectious variants of severe acute respiratory syndrome coronavirus 2 (SARS-CoV-2) emerged, median outbreak duration, median outbreak size, and the total number of outbreaks increased in Los Angeles County nursing homes (NHs).
-
• Median resident hospitalizations and median resident deaths per outbreak (per 100 licensed beds) did not increase in parallel.
-
-
• Policy should prioritize promoting COVID-19 vaccination among NH staff and residents to reduce severe health outcomes resulting from the emergence of more transmissible SARS-CoV-2 variants.
Background
Skilled nursing facilities, also known as “nursing homes” (NHs), are facilities licensed by their state and subject to regulatory requirements from the Centers for Medicare and Medicaid Services. They provide care to residents requiring the involvement of skilled nurses or rehabilitative staff, but not the level of care provided in a hospital setting. NH residents are at high risk of contracting and experiencing severe health outcomes associated with coronavirus disease 2019 (COVID-19), the disease caused by severe acute respiratory syndrome coronavirus 2 (SARS-CoV-2). Between February and August 2020, people 65 years and older in the United States comprised approximately 17% of the population but accounted for 79% of deaths related to COVID-191; residents of NHs in the United States comprised <0.5% of the population but 27% of COVID-19 deaths.2
Whereas many studies have documented the impact of COVID-19 on health outcomes among NH residents,Reference Tang, Bigelow and Sheikh3–Reference Lee, Ma and Chu6 few have described the characteristics of COVID-19 outbreaks in NHs. Burton et alReference Burton, Bayne and Evans7 described outbreak characteristics in 334 Scottish care home COVID-19 outbreaks in 2020, before vaccines were available. Recker et alReference Recker, White and Yang8 examined antigen and polymerase chain reaction (PCR) test concordance in COVID-19 outbreaks among residents of 306 NHs across 23 states but did not assess outbreak characteristics. Crèvecoeur et alReference Crèvecoeur, Hens and Neyens9 compared COVID-19 long-term care facility outbreak characteristics before and after the introduction of vaccines in Flanders, Belgium, in 2020 and 2021, but did not include time periods when Omicron subvariants (BA.1, BA.2) were predominantly circulating. Adams et alReference Adams, Chamberlain and Wang10 estimated the infectiousness of staff and resident cases in Fulton County, Georgia NHs, but their study included just 299 cases after NH vaccination prior to Omicron subvariant dominance. Chen et alReference Chen, Kezhekkekara, Kunasekaran and MacIntyre11 conducted a meta-analysis of 139 NH COVID-19 outbreaks and quantified transmission and outbreak size and duration as a function of universal masking and vaccination but did not account for facility size or analyze rates of severe outcomes (hospitalizations and deaths).
Los Angeles County (LAC) has 383 NHs, housing more than 35,000 licensed beds. LAC Department of Public Health (LAC DPH) investigated all outbreaks in NHs since the beginning of the pandemic in 2020. This paper describes the characteristics of COVID-19 outbreaks at LAC NHs between March 2020 and February 2022, a period spanning multiple surges in community transmission (Figure 1), assessing trends in COVID-19 outbreaks within a single public health jurisdiction. This highly populous and diverse county presents a more comprehensive sample than that available in existing literature, showing the impact of quickly evolving outbreak response activities over time (i.e., viral testing capacity and technology, COVID-19 vaccine introduction, changing outbreak management protocols, and pharmaceutical interventions), and the evolution of SARS-CoV-2, on severe COVID-19 outcomes.
Crude monthly COVID-19 incidence per 100,000 residents in Los Angeles County (LAC), March 2020–April 2022. COVID-19 cases were assigned to a month based on their episode date. Data excludes Long Beach and Pasadena. Population data estimates derived from LA County PEPS 2018 demography files. Case definition was based on the Council of State and Territorial Epidemiologists’s case definition at the time of episode date and includes both lab-confirmed (NAAT/PCR) as well as antigen (point of care) tests performed in clinical settings and serology tests.

Design and methods
Surveillance methods
LAC DPH has conducted disease surveillance for nearly 10 million residents in 86 cities, excluding Long Beach and Pasadena. Laboratories and providers were required to report all COVID-19 infections, hospitalizations, and deaths to DPH. All LAC NHs were required to test symptomatic residents and staff and were previously required to conduct regular COVID-19 screening tests among asymptomatic staff and residents without known close contact with confirmed cases. Cases were defined as NH staff or residents who tested positive for COVID-19 in a PCR or antigen-based test. When a staff member or resident tested positive for COVID-19, they were reported as a case by the facility, and the facility was required to test all staff and residents weekly (i.e., response testing) until no new infections were identified in 2 consecutive rounds of testing. Prior to October 6, 2020, NH resident cases were assigned to NH only if the resident had stayed in the NH for 14 or more days prior to symptom onset or positive specimen collection date. After October 6, 2020, this requirement was removed. Surveillance testing varied throughout the study period, but from December 15, 2021, through February 14, 2022 was required weekly for all residents and staff regardless of vaccination status, presentation of symptoms, or a facility’s outbreak status.
A NH outbreak was defined as the occurrence of ≥1 COVID-19 case in a resident. All outbreaks were investigated promptly by an outbreak investigation team comprised of a public health physician, nurses, and epidemiologists, who provided outbreak management guidance and collected extensive epidemiologic data to monitor each outbreak. LAC NHs were required to adhere to DPH’s COVID-19 guidance12 on managing future outbreaks, which incorporated state and federal guidance and requirements.
Data collection and management methods
Data on reported cases was managed in a centralized database called the Integrated Reporting, Investigation and Surveillance System (IRIS). IRIS also stored data that was externally matched to other data sources at the case level, including hospitalization data reported by LAC hospitals, death data from the CDPH California Comprehensive Death File for Los Angeles County, and vaccination data from the California Immunization Registry (CAIR2). Given the paucity of vaccination data, this study focused on primary series uptake among residents, which was defined as 2 doses of an FDA-approved COVID-19 mRNA immunization (Moderna or Pfizer) or 1 dose of an FDA-approved adenovirus vector immunization (Johnson and Johnson) (Table 3). DPH maintained resident and staff case lists for all COVID-19 outbreaks, which included information about a case’s date of birth, address, symptom onset date, test dates, hospitalization status, and date of death, if applicable. Names of cases from NH outbreak case lists were cross-referenced against IRIS to obtain additional information on cases that might not be known to the facility (e.g., vaccinations received or deaths that occurred outside the facility). Facility-level information for each NH, such as number of licensed beds, was obtained from California State licensing surveys.
Data analysis methods
The case’s episode date was defined as the earlier of either the date of COVID-19 symptom onset or the initial positive test collection date. Outbreak onset was defined as the date of the first resident case’s episode date within a facility. Outbreak closure date was defined as 14 days after the last resident case’s episode date. If there were 15 or more days between episode dates of 2 resident cases or clusters of cases, a new outbreak was created for the purposes of this study. Staff were defined as any employed or contracted personnel within the facility who were either directly or indirectly involved in patient care. For this analysis, we included all NH outbreaks with an onset date between March 1, 2020, and February 28, 2022. The study period was divided into 6 distinct time periods (Figure 2) based on specific temporal characteristics, such as surges, new dominant variants, and the availability of COVID-19 vaccines.
Los Angeles County nursing home COVID-19 outbreak analysis time period date ranges, COVID-19 vaccination milestones, and dominant* COVID-19 variants. *Dominant variant is the COVID-19 variant that made up >50% of genotyped isolates in Los Angeles County. Blank spaces indicate that no variant made up >50%.

Size* of COVID-19 outbreaks in Los Angeles County nursing homes by time period, March 2020–April 2020. *Outbreak size was calculated as the total number of nursing home residents who tested positive for COVID-19 during an outbreak. Staff cases were not included in the outbreak size.

An outbreak and its associated cases, hospitalizations, and deaths were assigned to a time period based on the outbreak onset date. Outbreaks at pediatric NHs or NHs that were housed within acute care hospitals (distinct-part NHs) were excluded from this analysis. Outbreaks at any of the 40 NHs located in LAC but under local (Pasadena or Long Beach), state, or federal jurisdiction were also excluded. Outbreaks at the remaining 313 NHs were eligible for inclusion. Cases with insufficient information to determine if they were staff or residents, and cases not laboratory-confirmed positive for COVID-19 were excluded. For cases with multiple positive test results within 90 days, the earliest test date was used. Outbreak size was defined as the total number of NH residents, exclusively, who tested positive for SARS-COV-2 during an outbreak (Figure 3). Outbreak duration was the number of days between the outbreak onset date and closure date. Hospitalizations were the total number of resident cases admitted to a hospital after testing positive (based on PCR or antigen-based test, or patient report of such a test) for COVID-19. COVID-19-associated deaths were defined as any death from a non-accidental or non-traumatic cause occurring ≤60 days of the first positive PCR test (or ≤90 days if intubated) if the death occurred prior to January 1, 2022. The definition for COVID-19-associated death changed to death within 30 days of the first positive PCR test (or 60 days if intubated) from January 1, 2022, onward. Severe outcomes were standardized to a denominator of 100 licensed beds to control for differences in facility sizes. NH resident cases were required to have resided in the outbreak facility for 14 or more days prior to their episode date starting on October 6, 2020. Before that date there was no confirmation of length of stay prior to a resident’s episode date.
The California State Department of Public Health Licensed and Certified Healthcare Facility Listing provided licensed bed count information for NHs with outbreaks. Descriptive analysis was conducted, and medians and interquartile ranges were calculated for outbreak duration, outbreak size by resident case count, resident hospitalizations, resident deaths, staff hospitalizations, and staff deaths. The distribution of cases and severe outcomes, before and after mass vaccination in LAC SNFs was also analyzed. All analysis was carried out in SAS 9.4.
Results
Investigators identified 1,587 total outbreaks at 313 NHs involving 27,141 residents and 17,138 staff cases. All 313 NHs experienced at least 1 outbreak during the study period. An initial set of 48,259 COVID-19 cases (27,463 resident and 20,796 staff) were reviewed; 3,980 cases (322 resident and 3,658 staff) did not meet the study inclusion criteria and were excluded. Cases were grouped into 1,286 COVID-19 outbreak records at the time of investigation. Included cases were retrospectively reorganized using the standardized outbreak definition yielding a total of 1,587 outbreaks. The licensed bed count of the included facilities ranged from 27 to 391, with a median of 99.
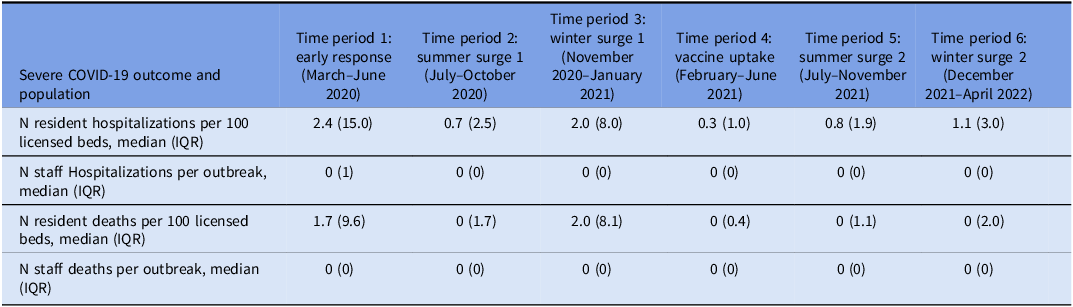
Median outbreak duration peaked in time period 3, though it was rivaled by that of the time period 6. Time period 6 had the greatest median outbreak size but maintained much lower rates of severe outcomes characteristic of outbreaks in post-vaccination time periods (Tables 1–2).
Size1 and duration2 of COVID-19 outbreaks in Los Angeles County skilled nursing facilities, March 2020–April 2022

Note. IQR, interquartile range; N, number.
1 Outbreak size was defined as the total number of nursing home residents who tested positive for COVID-19 during an outbreak. Staff cases were not included in outbreak size.
2 Outbreak duration was defined as the time from the index case’s episode date to 14 days after the last resident case’s episode date.
Severe outcomes among COVID-19 outbreaks in Los Angeles County skilled nursing facilities, March 2020–April 2022

Note. IQR, interquartile range; N, number.
NH outbreaks that began in the periods of highest community transmission (time periods 3 and 6) had the highest median number of resident cases.
The pre-vaccination “half” of the study period (March 2020–January 2021; time periods 1–3) contributed 87% of resident hospitalizations and 89% of resident deaths, despite being 3 months shorter than the “half” of the study period (February 2021–April 2022; time periods 4–6) after widespread vaccine uptake in LAC NHs (Figure 4).
Proportion of Los Angeles County nursing home outbreaks, resident cases, resident hospitalizations, and resident deaths in time periods 1–3 (Mar. 2020–Jan. 2021) vs time periods 4–6 (Feb. 2021–Apr. 2022). Widespread vaccination of LA County nursing home residents took place at the very end of time period 3. Outbreaks, cases, and severe outcomes were assigned to a time period based on the episode date of the index case of the outbreak.

Resident hospitalizations and deaths per 100 resident cases fell from 31 and 24 among outbreaks before mass NH vaccination (time periods 1–3) to 11 and 7, respectively, after (time periods 4–6).
Discussion
This descriptive analysis highlights differences before and after widespread changes, such as the COVID-19 vaccine, affecting the characteristics of COVID-19 outbreaks within a diverse NH population in a county of nearly 10 million residents. While many of our findings have been observed elsewhere,Reference Burton, Bayne and Evans7,Reference Crèvecoeur, Hens and Neyens9,Reference Adams, Chamberlain and Wang10,13 the current paper expands upon existing literature by providing the longest duration and largest population of NHs yet reported from a single jurisdiction. Reporting from a single jurisdiction helped to standardize local public health guidance, community transmission levels, and dominant circulating variants among all facilities in a given time period.
It is possible that vaccine uptake and availability were the main drivers in preventing severe COVID-19 disease in NHs, an interpretation that would be supported by the disproportionate number of resident hospitalizations, and resident deaths in the pre-vaccination time periods compared to post-vaccine time periods. Severe outcomes decreased then rebounded between pre-vaccination time periods (Table 2) but plateaued (at 1 and 0, respectively) in post-vaccination time periods. The different patterns corroborate the findings of other studies13 that show mRNA vaccination even among populations with high rates of prior infection confers greater protection than immunity induced from prior infection alone. This observation is most pronounced when comparing winter surge 2, following widespread vaccination in NHs, to winter surge 1. Despite peak or near-peak outbreak duration and size in the winter surge that followed vaccination, the decline in severe outcomes observed upon vaccine introduction endured. Increased surveillance testing of all residents and staff, improved reporting, and heightened community transmission may have affected outbreak size and duration in time period 6, the apex of community and NH incidence. However, the study did not control for strain type nor any prior infection induced immunity, either of which may confound the effect of the vaccine on the NH population.
The ratio of severe outcomes and cases presented (Figure 4) may be inaccurate for the earlier time periods because death and hospitalization reporting was more likely to be incomplete before data streams used later were established. However, limited test capacity in those time periods led to an underreporting of cases at the same time, so the overall effect is unlikely to be significant. The impact of the COVID-19 vaccine may have been influenced over time by differences between SARS-CoV-2 variants, evolving mitigation strategies recommended by public health authorities, availability of outpatient therapeutics, natural immunity due to prior infection, and greater familiarity and competence in infection prevention and control practices in NHs. However, the high uptake of the COVID-19 vaccine in NHs correlated with a precipitous fall in death and hospitalization rates. This supports the rationale to maintain high vaccination rates among NH staff and residents. The data presented within this paper underestimates the number of COVID-19 cases and deaths that occurred prior to widespread testing availability in June 2020, the inclusion of which may have further highlighted the difference in severe outcome rates. This study looked at fully vaccinated status defined as having received the primary series but did not include an analysis of booster doses given starting in fall 2021. Additionally, individual vaccination status and risk factors for severe outcomes were not available at the case level, potentially affecting severe outcome rates assessed in this study. Based on existing studiesReference Danza, Koo and Haddix14–Reference Johnson, Amin and Ali17 on the protection of 1 monovalent booster dose in adults, the inclusion of booster status has been unlikely to weaken or reverse the correlation between widespread NH vaccination and lower rates of severe COVID-19 outcomes among residents.
Based on the data presented by our study, after widespread availability and uptake of the COVID-19 vaccine, hospitalization and death rates do not consistently correlate with overall COVID-19 infection rates. Although the median duration of outbreaks was comparable between time periods 3 and 6, the size of outbreaks was notably larger in time period 6. However, hospitalization and mortality rates were significantly lower in time period 6 than time period 3. The surge in outbreak size may be related to the increased frequency of surveillance testing for asymptomatic residents and staff during time period 6. However, even when immunization did not entirely eliminate infection, these results suggest it remains effective for outbreak management and reducing disease severity. These findings corroborate prior researchReference Adams, Chamberlain and Wang10 which demonstrated a link between disease severity and how infectious COVID-19 cases are. This may suggest severe outcome measures, such as hospitalizations and deaths, are preferable to incidence rates to inform changes in mitigation measures.Reference Silk, Scobie and Duck18
Though not directly addressed by our study and highlighted by other studiesReference Cronin and Evans19–Reference Khairat, Zalla, Adler-Milstein and Kistler21 exploring the correlation between Nursing Home Compare 5-Star rating and COVID-19 survival, NHs do not comprise a monolithic entity, and they significantly differ in aspects that contribute to outcome rates, such as nurse to resident staffing ratios, proportion of residents on Medicaid,Reference Li, Temkin-Greener, Shan and Cai22 location,Reference Khairat, Zalla, Adler-Milstein and Kistler21,Reference LeRose, Merlo and Duong23 etc. Our study also adds to existing evidence that surges in community transmission are strongly correlated with the spread of SARS-CoV-2 in NHs.Reference Konetzka, White, Pralea, Grabowski and Mor20 Community spread continues to be a main driver of severe outcomes in NH residents, even after widespread vaccine availability, and highlights the extent to which NHs are not isolated from other parts of the healthcare system or the general community. Thus, while focusing vaccination efforts on high-risk populations is necessary, it is not sufficient.Reference Konetzka, White, Pralea, Grabowski and Mor20
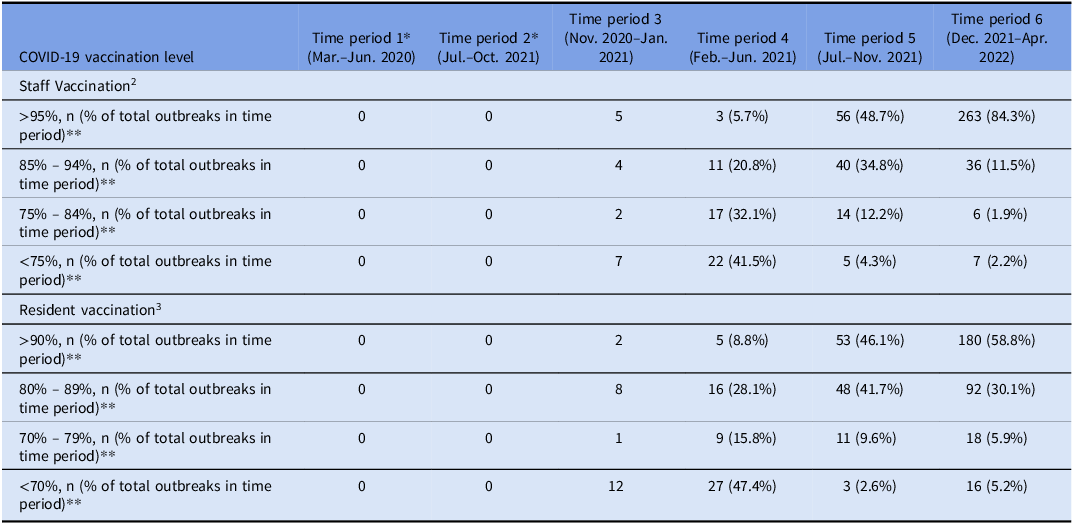
COVID-19 vaccination level1 among Los Angeles County skilled nursing facility staff or residents at the start of a COVID-19 outbreak, by time period, March 2020–April 2022

1 Level cutoffs for staff are higher than for residents because staff were subject to the California Department of Public Health healthcare staff vaccination mandate.
2 Percentage of staff which completed primary series vaccination by the start of outbreak n = 498
3 Percentage of residents who completed primary series vaccination by start of outbreak n = 501
*Vaccination was not available during time periods 1 and 2.
**Percentage of time period only provided for time periods 4–6 due to scarcity of data in time period 3.
Acknowledgments
The authors would like to thank the Los Angeles County Department of Public Health for its support in this research. They would also like to thank the Centers for Disease Control and Prevention’s (CDC) Epidemiology and Laboratory Capacity (ELC) Cooperative Agreement (CK19-1904) called “Nursing Home & Long-term Care Facility Strike Team and Infrastructure Project,” which funded this research.
Competing interests
Amanda van Rest, MPH, held a position funded through the ELC Cooperative Agreement (CK19-1904) and received financial support to attend the Infectious Disease Week Conference 2023 in Boston, MA, while employed with the CDC Foundation.
Anthony Clarke, MPH, held a position funded through the ELC Cooperative Agreement (CK19-1904).
Prabhu Gounder, MD, declares no conflicts of interest or financial gain related to this research.
Pingting (Karen) Nie, MD, declares no conflicts of interest or financial gain related to this research.
Chandana Das, MD, declares no conflicts of interest or financial gain related to this research.
CaSaundra Bush, MPH, declares no conflicts of interest or financial gain related to this research.
Zachary Rubin, MD, declares no conflicts of interest or financial gain related to this research.