INTRODUCTION
The shallowest waters of the Gulf of Gdańsk play an important role in the ontogeny of many fish species. They are places of spawning, feeding and growth (Skóra, Reference Skóra and Korzeniowski1993). In the same region, blooms of cyanobacteria are observed every summer. The blooms are mainly composed of Aphanizomenon flos-aquae (L.) Ralfs ex Bornet et Flahault, Nodularia spumigena Mertens ex Bornet et Flahault and less abundant Dolichospermum (Anabaena) species. As N2-fixing microorganisms, they can form a large biomass even when dissolved inorganic nitrogen is depleted. Additionally, gas vesicles (aerotopes) make them buoyant and facilitate formation of surface accumulations when weather is calm. Summer blooms of N. spumigena are regular over the whole Baltic Sea. Based on satellite measurements, it has been possible to determine that cyanobacteria can cover over 100,000 km2 of the Baltic Proper (Kahru et al., Reference Kahru, Savchuk and Elmgren2007). In general, cyanobacterial blooms begin to develop in the open water, but the waves and wind can push the scums towards the coastal zone.
Large-scale development of cyanobacteria in the Baltic Sea has a negative impact on the ecosystem. Blue-green algae may affect the Baltic Sea ecosystem directly or indirectly. High-biomass blooms can prevent sunlight penetration into the water column, which contributes to the loss of water clarity and consequently suppresses aquatic macrophytes, and negatively affects invertebrate and fish habitats. Furthermore, effects of cyanobacterial blooms include visual and mechanical interference in feeding and changes in the pelagic environment, from transparent to turbid conditions offering a refuge for smaller prey (Karjalainen et al., Reference Karjalainen, Engström-Öst, Korpinen, Peltonen, Pääkkönen, Rönkkönen, Suikkanen and Viitasalo2007).
Bacterial decomposition of dying blooms may lead to oxygen depletion (hypoxia and anoxia), and subsequent fish kills (Paerl & Otten, Reference Paerl and Otten2013). These organisms can produce a number of metabolites through their secondary metabolism, some of which can be extremely harmful. The blooms can be particularly harmful when the nodularin (NOD)-producing species, N. spumigena, dominates. NOD is a cyclic pentapeptide with hepatotoxicity associated with liver accumulation, where it inhibits hepatocellular serine: threonine protein phosphatase-1 and -2A (PP1 and PP2A, respectively). The effect of NOD accumulation in aquatic animals from different trophic levels has been documented, both in field studies and in laboratory experiments (Landsberg, Reference Landsberg2002; Karjalainen, Reference Karjalainen2005, Reference Karjalainen, Engström-Öst, Korpinen, Peltonen, Pääkkönen, Rönkkönen, Suikkanen and Viitasalo2007; Pääkkönen et al., Reference Pääkkönen, Rönkkönen, Karjalainen and Viitasalo2008; Persson et al., Reference Persson, Stenroth and Legrand2011; El-Shehawy & Gorokhova, Reference El-Shehawy, Gorokhova, Ferrão-Filho and Da2013; Mazur-Marzec et al., Reference Mazur-Marzec, Sutryk, Hebel, Hohlfeld, Pietrasik and Błaszczyk2015).
In consequence, cyanobacteria-induced fish mortalities are caused by either poisoning due to toxin release, anoxia or a combination of both. However, not every cyanobacterial bloom causes a fish kill. The released toxins should normally dissolve rapidly within a water body and therefore, the concentration of toxins usually remains below a lethal level. Moreover, fish may migrate within a given water body and thus avoid exposure to a toxic cyanobacterial bloom (Ernst, Reference Ernst2008 and references therein).
It is commonly considered that fish, as mobile organisms, leave a region contaminated with harmful substances.
Therefore, it can be presumed that algal blooms would reduce the number of fish in the study area.
The objective of our study was to compare the species composition of ichthyofauna in a shallow zone of the Gulf of Gdańsk during a N. spumigena bloom and in a period with no algal bloom.
MATERIALS AND METHODS
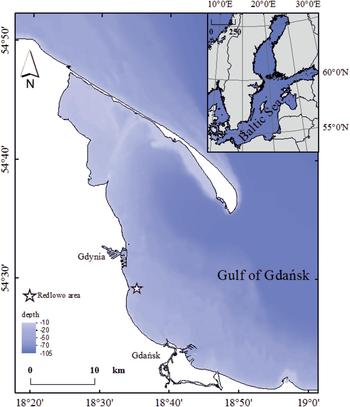
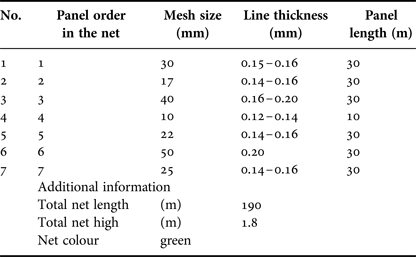
The study was carried out in the Gulf of Gdańsk (the Southern Baltic Sea) on 29/30 June and 29/30 July 2011 in the Gdynia-Redłowo area (54°27,979′N 18°34,219′E) (Figure 1). Every year, this area is affected by summer blooms of the toxic cyanobacterium N. spumigena. Gillnetting was carried out to study fish composition and abundance. In addition, the cyanobacteria composition was investigated. Samples were collected during a cruise of Oceanograf II. Each experimental set-up consisted of three gillnets (Nordic Nets 64) multi-mesh and each gillnet was composed of seven different mesh sizes, ranging from 10 to 50 mm, knot to knot (Table 1). Each time, experimental set-ups were deployed parallel to the shoreline, at a depth of 4 and 6 m and were left for 24 h.
Study area in the Redłowo territory in the western part of the Gulf of Gdańsk.

Gillnet (Nordic Nets 64) parameters (CEN, 2005; Psuty, Reference Psuty2011).

Taxonomy, total length and wet weight were determined for each fish. The abundance and biomass of each fish species were determined in each sampling and net set separately.
Basic physicochemical water parameters (temperature, salinity, oxygen, pH) were measured in situ with a WTW Multi 340i meter (measuring each 1 m from surface to bottom). Surface water samples for qualitative and quantitative analyses of phytoplankton were collected into 200 ml bottles during deployment and collection of gillnets. Water samples were preserved with Lugol's solution (1%) and stored under cool and dark conditions. The biomass of cyanobacteria was determined according to the Utermöhl method (Edler, Reference Edler1979) using an inverted microscope (Nikon TMS, Tokyo, Japan) with 200× and 400× magnification. The size of the counting chambers (2 or 10 ml) and the sedimentation time (8 or 24 h) depended on the abundance of phytoplankton. The bloom samples (30 June 2016) were diluted 10 times. The biomass of cyanobacteria was calculated from cell size and shape using appropriate geometric formulas proposed by Olenina et al. (Reference Olenina, Hajdu, Andersson, Edler, Wasmund, Busch, Göbel, Gromisz, Huseby, Huttunen, Jaanus, Kokkonen, Ledaine and Niemkiewicz2006).
Statistical analyses
Differences between sampling sets were analysed with Factor Analysis (PCA, without rotation) and Cluster Analysis (Ward's, 1-Pearson's r).
Cluster Analysis (Ward's, 1-Pearson's r) was chosen as Ward's method is generally known as effective but produces relatively small groups and we wanted to group items according to variance present in all investigated material. Factor Analysis (PCA, without rotation) was chosen to check if it is possible with a reduction of the number of variables to find factors explaining generally observed changes in fish community.
All analyses were completed with Statsoft Statistica v. 12 software.
RESULTS
In 2011, only a short episode of the toxic N. spumigena bloom (6.27 × 10⁷ 100 µm filaments dm−3, 1531 mg dm−3) was recorded in week 26 (29/30 June) (Table 2). One month later, i.e. at the end of July, N. spumigena and nodularin were not detected in the phytoplankton samples.
Average of water temperature (°C), salinity, abundance (100 µm filaments dm−3) and biomass (mg dm−3) of N. spumigena during fish sampling. Concentration of nodularin (NOD) after Mazur-Marzec et al. (Reference Mazur-Marzec, Sutryk, Kobos, Hebel, Hohfeld, Błaszczyk, Toruńska, Kaczkowska, Łysiak-Pastuszak, Kraśniewski and Jasser2013) and unpublished data.

No significant differences were determined for any of the measured environmental parameters (salinity, water temperature, oxygen concentration, pH). Water temperature variability between June and July sampling was less than 1°C, salinity less than 0.5. and pH –0.4 (Table 2). Oxygen concentration during sampling was close to 100%, in the inshore area of the Gulf of Gdańsk, which is typical for most of the year.
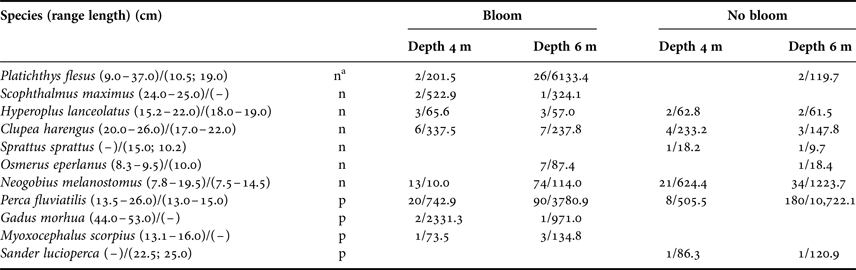
A total of 458 fish belonging to 11 species were captured (Table 3).
Abundance, biomass (ind./mass (g)) and length range (June)/(July) of fish species in samplings.

a n-not predator; p-predator.
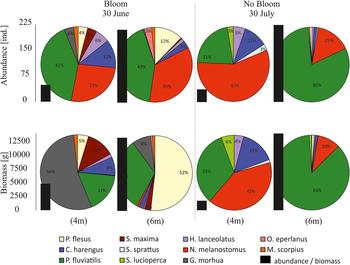
During June sampling, 49 fish with a total weight of 4823.6 g were caught at a depth of 4 m. They were represented by eight fish species (Figure 2), the most abundant of which were perch (41%) and round goby (27%), and they contributed (in terms of weight) 17% and 0.3% to the total fish biomass, respectively. Smaller fish were more common in this sampling. Cod represented 54% of the fish biomass and 4% of the total fish count in the sampling.
Fish abundance, biomass and species composition in samplings during and after cyanobacterial bloom.

In the sampling at 6 m depth, 148 fish with a total weight of 12,048.8 g, represented by nine fish species, were caught (Figure 2). Perch (43%) and round goby (35%) were most abundant. Flounder (52%) dominated in terms of the biomass (Figure 2). Three predator fish species, i.e. cod, perch and sculpin, were observed in these samplings.
Altogether 261 fish with a total weight of 1395.1 g, represented by eight fish species, were caught in July samplings. During 4 m depth sampling, 37 fish with a total weight of 1530.4 g, represented by six fish species, were collected (Table 1). Round goby was represented by the largest number of specimens and contributed 57% to the total catch (in terms of the total number of individuals) and 41% to the total fish biomass (Figure 2).
During the 6 m depth sampling (with a total number of 224 fish and total weight of 12,423.7 g), sprat and pikeperch were caught in addition to fish species present in the 4 m sampling (Figure 2). Two predator species were observed in July samplings – pikeperch and perch (Table 3).
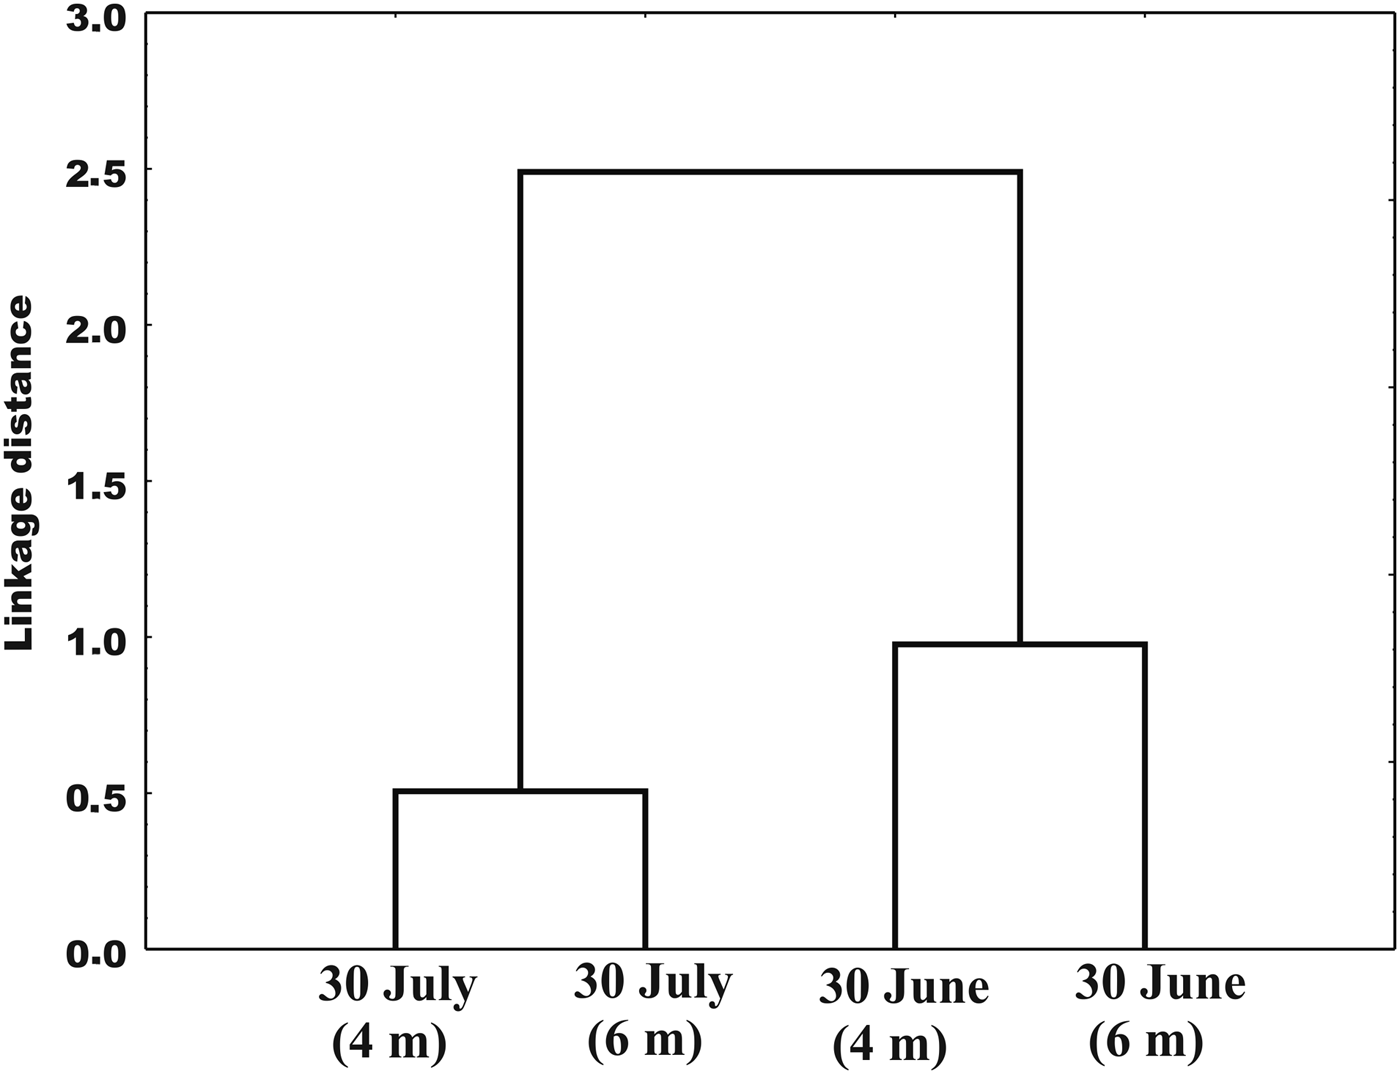
The similarity between the samples was checked by cluster analysis. The resulting dendrogram separated the sampled species into two groups (Figure 3). There are large differences in the fish structure in June (bloom) and July (no bloom) samplings (Figure 3). The date of sampling was more significant than the depth of sampling set exposure.
Similarity between gillnet samplings (Ward's, 1-Pearson's r).

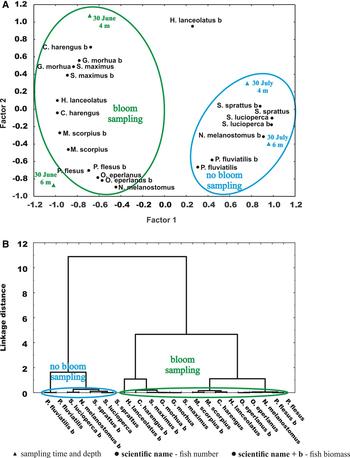
In the factor analysis, two groups of fish were recognized (Figure 4). Factor 1 divides the fish into two groups according to time of sampling. Factor 2 divides the fish mostly according to the main depth of occurrence.
Statistical similarities between fish assemblages present during sampling (the number and biomass), A – PCA, without rotation: factor 1–62.10%, factor 2–32.10%; B – Ward's, 1-Pearson's r.

Group 1 includes fish with higher abundance and biomass during bloom samplings, Group 2 includes fish (sprat, pikeperch, perch) correlated with no bloom samplings.
DISCUSSION
In 2011 a short episode of the toxic N. spumigena bloom was observed. One month later N. spumigena and nodularin were not detected in the phytoplankton samples. No significant differences were determined for any of the measured environmental parameters (salinity, water temperature, oxygen concentration, pH) during samplings. We have investigated, in shallow-water areas of the Gulf of Gdańsk, fish communities since 1993 and algal blooms since 1997. Due to the heterogenic characteristics of blooms in this area this was the first time we were able to check fish structure, composition, biomass and abundance during a N. spumigena bloom. In our studies, we were able to check how the occurrence of N. spunigena blooms affects the fish structure and abundance in the coastal area of the Gulf of Gdańsk. This is the first study related to the species composition and abundance of fish occurring in the initial phase of cyanobacteria blooms in the inshore zone.
Fish distribution in natural ecosystems during toxic cyanobacterial blooms has been studied in the last decade (Ernst et al., Reference Ernst, Hoeger, O'Brien and Dietrich2007; Sotton et al., Reference Sotton, Anneville, Cadel-Six, Domaizon, Krys and Guillard2011). The response of fish to toxic cyanobacteria may vary depending on fish and blue-green algae species, as well as the level of toxicity (Baganz et al., Reference Baganz, Staaks, Pflugmacher and Steinberg2004; Ernst et al., Reference Ernst, Hoeger, O'Brien and Dietrich2007; Godlewska et al., Reference Godlewska, Izydorczyk, Kaczkowski, Jóźwik, Długoszewski, Ye, Lian and Guillard2015). Changes in the behaviour of fish in response to contact with toxic blue-green algae are probably complex and may depend both on the fish species and cyanobacteria species composition, as well as the intensity of blooms and their toxicity (Baganz et al., Reference Baganz, Staaks, Pflugmacher and Steinberg2004; Ernst et al., Reference Ernst, Hoeger, O'Brien and Dietrich2007). Toxic blooms may affect swimming activity of fish (Baganz et al., Reference Baganz, Staaks, Pflugmacher and Steinberg2004), their feeding, reproduction and survival (Karjalainen et al., Reference Karjalainen, Engström-Öst, Korpinen, Peltonen, Pääkkönen, Rönkkönen, Suikkanen and Viitasalo2007).
The first research in Poland on the number of fish during cyanobacterial blooms was conducted by Godlewska et al. (Reference Godlewska, Izydorczyk, Kaczkowski, Jóźwik, Długoszewski, Ye, Lian and Guillard2015) in the shallow Sulejów reservoir. The number of fish was determined using hydroacoustic methods. Changes in the dominant fish species were observed due to the bloom intensity in the study area. Fish were less abundant in the area of the bloom, although not totally absent, when a low cyanobacteria biomass was detected, the fish biomass was unpredictable and could have either very small or very high values (Godlewska et al., Reference Godlewska, Izydorczyk, Kaczkowski, Jóźwik, Długoszewski, Ye, Lian and Guillard2015).
Shallow inshore waters of the Gulf of Gdańsk are mostly inhabited by marine fish species (Skóra, Reference Skóra2000; unpublished data from coastal fish monitoring). In 1-year studies of fish composition in the Redłowo area, 13 marine, three freshwater and one anadromous species were identified. The most common fish species in summer include freshwater (i.e. perch P. fluviatilis, pikeperch S. lucioperca, three-spined stickleback G. aculeatus) and marine (i.e. flounder P. flesus, round goby N. melanostomus and sandeel A. tobianus) organisms (Koszarowski unpublished; unpublished data from coastal fish monitoring). In samplings conducted in 2011, altogether 11 fish species were identified, including eight marine and three freshwater species. According to previous investigations fish species composition, during the bloom sampling, was typical for the coastal area of the Gulf of Gdańsk in summer.
In 2011, only a short episode of toxic N. spumigena was recorded on 29–30 June in coastal waters in the Gulf of Gdańsk. But large-scale blooms of this species were observed in July and August in the central and northern Baltic (ICES, 2012). The peak of N. spumigena biomass and the highest concentration of nodularin (1236 µg dm3) was determined in the surface bloom samples collected on 30 June (Mazur-Marzec et al., Reference Mazur-Marzec, Sutryk, Kobos, Hebel, Hohfeld, Błaszczyk, Toruńska, Kaczkowska, Łysiak-Pastuszak, Kraśniewski and Jasser2013).
During the conducted study, we were able to correlate the time of bloom occurrence with the net setting. It enabled us to observe differences in the species composition, abundance and biomass of fish during June (bloom) and July (no bloom in the water column) samplings. Fish, as mobile organisms, are expected to escape from the region where toxic algal blooms occur. According to Sotton et al. (Reference Sotton, Anneville, Cadel-Six, Domaizon, Krys and Guillard2011), however, whitefish (Coregonus lavaretus) was found in the same water layer of perialpine Lake Bourget as the bloom of Planktothrix rubescens. Based on statistical analysis, we were able to distinguish two groups of fish species, i.e. species not affected by bloom and fish avoiding the bloom region. In both groups, pelagic and benthic fish species were present.
It is likely that fish could respond to environmental conditions altered by algal blooms. Data on pH during algal blooms from coastal areas are sparse, but pH may increase above 9 and become as high as 9.25 and 9.75 in enclosed water bodies. In the Baltic Sea, pH values above 9.3 were measured during such blooms (Møgelhøj et al., Reference Møgelhøj, Hansen, Henriksen and Lundholm2006 and references therein). In the Gulf of Gdańsk, pH values above 9.1 were measured during N. spumigena blooms in 2008–2010 (unpublished data). During our investigations pH was from 8.7 to 9.1 during bloom sampling and 8.2 months later.
Environmental conditions (e.g. oxygen concentration, pH), during samplings, within the bloom and a month later were typical for shallow waters of the Gulf of Gdansk during summer and suitable for the fish. We observed that the total number of fish and their biomass were higher, as well as predators being more abundant within the bloom sampling. In June, we observed the occurrence of large individuals of cod, sculpin, flounder and turbot, usually present in a shallow-water area during the night (Lizińska, Reference Lizinska2002). Similar regularity was observed during studies of diel shifts conducted by Yeoh et al. (Reference Yeoh, Valesini, Hallett, Abdo and Williams2017) in nearshore estuaries where small pelagic fishes were more abundant during the day, while larger pelagic, benthic-pelagic and demersal fishes prevail at night.
We assume that those differences were probably caused by a decrease in visibility. The increase in organic matter raises the level of eutrophication and encourages algal blooms, which leads to further increase in turbidity (Utne-Palm, Reference Utne-Palm2002). Several studies reveal that relatively small increases in turbidity may change the structure of fish communities affecting, for example, their migratory activity, increase the use of open water by young fish and reduce the predation risk (Utne-Palm, Reference Utne-Palm2002 and references therein). Turbidity may also affect prey-searching behaviour (Utne-Palm, Reference Utne-Palm2002). In the laboratory study, foraging of cod on evasive prey in highly turbid water was attributed to the use of both visual and non-visual senses (Meager et al., Reference Meager, Solbakken, Utne-Palm and Oen2005).
In addition to fish predation, we can expect bird predation, especially by cormorants and herons which are abundant in this region and pose a direct threat to fish in shallow-water areas during the day (Bzoma, Reference Bzoma2004; Jakubas & Mioduszewska, Reference Jakubas and Mioduszewska2005). This type of predation occurs mostly during the day (Terorde, Reference Terorde2008) and its range is small within turbid macrotidal estuaries (Baker & Sheaves, Reference Baker and Sheaves2007; Tweedley et al., Reference Tweedley, Warwick and Potter2016).
There are various methods used to monitor cyanobacterial blooms. Most frequently, the biomass of potentially toxic species has been determined by spectrophotometric measurements of chlorophyll-a (Chl-a) concentration and by microscopic counts and biomass calculated of phytoplankton. There is a lack of literature describing fish abundance and phytoplankton abundance and biomass or Chl-a concentration in the same time in the shallow-water areas. These are the first observations on fish reactions in a coastal zone during a cyanobacterial bloom in the Gulf of Gdańsk. Mastin et al. (Reference Mastin, Rodgers and Deardorff2002) conducted laboratory and environmental study where influence of toxic algal blooms (with blue algae Lyngbya domination) on fish (Pimephales promelas) ontogenesis was examined. Fish survival rate was 76.7% even if Chl-a concentration was over 2600 µg dm−3. The same investigations revealed that P. promelas significantly (P < 0.05) avoided Lyngbya-dominated cyanobacteria, collected in the spring (175 µg Chl-a dm−3). In summer and winter time no statistically significant avoidance reaction was detected when the maximum concentration of Chl-a were 200 and 140 µg dm−3, respectively.
During our study the Chl-a concentration was not measured, because in the Baltic Sea the correlation between Chl-a and nodularin concentration may vary widely, from r = 0.683 (Henriksen, Reference Henriksen2005) to r = 0.943 (Schlüter et al., Reference Schlüter, Garde and Kaas2004). The mean correlation between Chl-a and nodularin concentration carried out in the coastal waters of the Gulf of Gdańsk in 2004 and 2005 was r = 0.8 (Mazur-Marzec et al., Reference Mazur-Marzec, Krężel, Kobos and Plinski2006). A much better correlation is determined between biomass of N. spumigena and NOD concentrations. Therefore the blooms were determined by microscopic methods. In surface water the abundance, biomass of N. spumigena and nodularin concentration were 6.27 × 10⁷ 100 µm filaments dm−3, 1531 mg dm−3 (Table 2) and 1236 µg dm−3 (Mazur-Marzec et al., Reference Mazur-Marzec, Sutryk, Kobos, Hebel, Hohfeld, Błaszczyk, Toruńska, Kaczkowska, Łysiak-Pastuszak, Kraśniewski and Jasser2013), respectively. The concentration of NOD with the biomass of N. spumigena measured in 2008–2011 by Mazur-Marzec et al. (Reference Mazur-Marzec, Sutryk, Kobos, Hebel, Hohfeld, Błaszczyk, Toruńska, Kaczkowska, Łysiak-Pastuszak, Kraśniewski and Jasser2013) was well correlated (P < 0.05, r = 0.946). These results are in agreement with earlier studies by Henriksen (Reference Henriksen2005).
It is well known that nodularin can accumulate in various organs of fish that are exposed to Nodularia blooms (Sipiä et al., Reference Sipiä, Kankaanpää, Lahti, Carmichael and Meriluoto2001a, Reference Sipiä, Kankaanpää, Flinkman, Lahti and Meriluotob, Reference Sipiä, Neffling, Metcalf, Nybom, Meriluoto and Codd2008; Karlsson et al., Reference Karlsson, Sipiä, Kankaanpää and Meriluoto2003; Mazur-Marzec et al., Reference Mazur-Marzec, Tymińska, Szafranek and Pliński2007; Sotton et al., Reference Sotton, Domaizon, Anneville, Cattanéo and Guillard2014). NOD produces some cellular effects, such as oxidative stress, leading to apoptotic processes and, at a larger scale, causing physiological disturbances. However, fish can detoxify NOD when exposed to the toxins and thus to counteract the negative effects of NOD (Sotton et al., Reference Sotton, Domaizon, Anneville, Cattanéo and Guillard2014). It should not be forgotten that Nodularia can also produce other metabolites that may adversely affect fish. To better understand the impact of a toxic bloom of Nodularia on fish, the NOD concentration was investigated in fish by Mazur-Marzec et al. (Reference Mazur-Marzec, Sutryk, Kobos, Hebel, Hohfeld, Błaszczyk, Toruńska, Kaczkowska, Łysiak-Pastuszak, Kraśniewski and Jasser2013). According to studies conducted in parallel with ours, NOD accumulation in round goby (N. melanostomus), caught during the most intensive N. spumigena bloom (30 June), reached 257.7 ± 151.2 ng NOD g−1 in muscles and 23.6 ± 7.0 ng NOD g−1 in liver. A month later, on 29 July, round goby muscles and liver contained 347.3 ± 564.2 and 920.9 ± 1769.1 ng NOD g−1, respectively. Nodularin concentration in flounder (P. flesus) muscles and liver on 29 July was 13.6 and 191.8 ng g−1, respectively. In the fish muscles, the toxin content exceeded the tolerable daily intake value (TDI) for humans (Mazur-Marzec et al., Reference Mazur-Marzec, Sutryk, Kobos, Hebel, Hohfeld, Błaszczyk, Toruńska, Kaczkowska, Łysiak-Pastuszak, Kraśniewski and Jasser2013). This study showed that round goby accumulated higher amounts of the toxin than flounder. These differences may be due to the type of food being eaten and to the presence of these fish in different habitats. Round goby prefers shallow water and mainly feeds on mussels (Karlsson et al., Reference Karlsson, Sipiä, Kankaanpää and Meriluoto2003; Sapota, Reference Sapota2004), which is contaminated throughout the year by NOD (Sipiä et al., Reference Sipiä, Kankaanpää, Lahti, Carmichael and Meriluoto2001a, Reference Sipiä, Kankaanpää, Flinkman, Lahti and Meriluotob, Reference Sipiä, Neffling, Metcalf, Nybom, Meriluoto and Codd2008; Karlsson et al., Reference Karlsson, Sipiä, Kankaanpää and Meriluoto2003; Mazur-Marzec et al., Reference Mazur-Marzec, Tymińska, Szafranek and Pliński2007). On the other hand, the flounder migrates between the coastal zone and the open sea and feeds primarily on Macoma baltica and, to a lesser degree, on mussels. This composition of plant foods reduces the risk of NOD intake in comparison with round goby. Those investigations were conducted on fish from both samplings described in this publication. Our investigations shown that fish do not avoid N. spumigena blooms in the initial phase. One method of protection may be an increased in biosynthesis of enzymes involved in biotransformation of xenobiotics as redox couple GSH/GSSG and related enzymes such as GS, GST and GSPXx. However, the responses of these enzymes in different fish exposed to different toxins (also cyanotoxin) are inconsistent for the different type of fish species studied (Mazur-Marzec et al., Reference Mazur-Marzec, Sutryk, Kobos, Hebel, Hohfeld, Błaszczyk, Toruńska, Kaczkowska, Łysiak-Pastuszak, Kraśniewski and Jasser2013; Srikanth et al., Reference Srikanth, Pereira, Duarte and Ahmad2014). Future studies are needed regarding the detoxification capacities and the effects of NOD on the reproduction processes of fish that are exposed to toxic Nodularia blooms, both for short and long durations, to better understand the potential risk of NOD contamination on fish populations.
CONCLUSION
Given the observed level of nodularin concentration, the tendency of fish to encroach on areas of N. spumigena blooms may increase accumulation of toxic substances in fish tissue, thus raising the risk of contaminated fish consumption by humans. For a better assessment of the actual risk (not only for fish but also for humans), it is important to determine to what extent algal blooms tend to attract the fish and the residence time of nodularin in fish tissues.
ACKNOWLEDGEMENTS
This work was supported by the Institute of Oceanography, University of Gdańsk (statutory research topic no. D530-G205-D424-11).