1 Introduction
In view of the looming ageing problem and the costs of maintaining pay-as-you-go (PAYG) systems, many countries are enhancing the role of pension funding. One of the major complications in the design of a funded pension system is the measurement of pension liabilities. The methodology is typically set by regulation, while there is only a weak conceptual basis for any such approach. The problem has two dimensions. On the one hand, cash flows may be estimated from accrued pension rights or from pension rights projected forward using expected wage increases. On the other hand, in order to properly assess obligations (Geanakoplos and Zeldes, Reference Geanakoplos and Zeldes2009) and the portfolio allocation of the fund's assets (Lucas and Zeldes, Reference Lucas and Zeldes2009), cash flows should be discounted using rates reflecting the systematic risk of liabilities. Unfortunately, there are no market instruments replicating such risk perfectly (De Jong, Reference De Jong2008). Therefore, practitioners use fixed ad hoc rates or market-related rates generically accounting for aggregate risk. The potential consequences are non-negligible as different discounting methods may produce substantial differences in the volatility of the pension fund's funding ratios (the ratio of assets over measured liabilities) and, therefore, in the necessary frequency of policy adjustments. This paper explores the consequences of alternative discounting methods for both pension fund buffers and welfare for individuals of different ages and skills. Our analysis is based on simulations of a model that incorporates a pension system calibrated to that in the Netherlands, which is one of the few countries with a traditionally large role for defined benefit (DB) pension funds. In fact, their capitalization is around 130% of Dutch GDP (Pelsser and Vlaar, Reference Pelsser and Vlaar2008). However, our results may also be of interest for other countries, such as the U.S., where most public pension funds are currently of the DB type (Munnell et al., Reference Munnell, Aubry and Muldoon2008).
The Dutch pension system is characterized by a PAYG public pension (the first pillar) for which everyone is eligible, a funded second pillar with mandatory participation and a small funded third pillar with voluntary participation. The first two pillars are roughly of equal size. The first pillar is organized by the government and allows for intragenerational redistribution, because contributions are wage dependent, while benefits are flat. The second pillar is formed by private pension funds that receive contributions from workers and firms, invest those contributions and pay benefits to the retired. Here, the dominant pension contract is what the Pension Law calls ‘defined benefit’, although economists would more appropriately describe it as a hybrid between defined benefit (DB) and defined contribution (DC). Through their contributions workers accumulate within a personal account rights to a flat nominal benefit as of the mandatory retirement age. Each year the account is increased by a number of euros as a percentage of the wage in that year. The accumulated amount of euros (‘the account’) at retirement date becomes the annual benefit that would remain flat in nominal terms when indexation is absent. However, the accounts of both workers and retirees are usually indexed to wage or price inflation, a decision that each year is taken by the pension fund's board, which consists of representatives from the employers and trade unions.
Until recently, pension liabilities in the Netherlands were measured by discounting the future benefits associated with the accumulated pension rights against a fixed actuarial interest rate set at 4% by the supervisory authority. However, after the introduction of the new Pension Law and its supervisory framework in 2007, pension funds are obliged to value their liabilities through discounting on the basis of a market term structure of interest rates. The particular term structure to be used is the swap curve. The motivation for this regulatory shift was to provide a clearer picture of the true value of the liabilities. As emphasized by Brown and Wilcox (Reference Brown and Wilcox2009), DB pensions offer retirees a safe stream of income in the sense that there are strong contractual and legal protections against default on promised benefits. Yet, fund participants share with fund managers the considerable risk from uncertain future salaries, demographic developments and financial market returns. Market-based valuation helps to reflect those uncertainties in the value of the pension liabilities. Nevertheless, there is widespread fear that such valuation leads to excessively volatile funding ratios because market term structures themselves are highly volatile and exhibit mean reversion, which implies overly frequent and large policy adjustments.
These worries are not merely imaginary as the recent crisis has shown. Asset markets lost a substantial share of their value, thereby dealing a severe blow to the value of pension funds' assets, while interest rates, and the swap curve in particular, at the same time reached unprecedentedly low levels, thereby boosting the liabilities. Dutch pension funds are required to have a solvency buffer reflecting the riskiness of their investments. For the typical pension fund, this implies a target funding ratio of 125%. When the funding ratio falls below 125%, the pension fund has to devise a long-term restoration plan, while in the case of a fall below 105% (‘underfunding’) it has to submit a short-run restoration plan to the supervisor (the Dutch Central Bank – DNB). The plan should present a realistic set of measures to escape the state of underfunding in 3 or 5 years. This is the situation a large number of Dutch pension funds find themselves now in. In many instances, drastic measures are needed, such as reduced indexation of pensions to price or wage increases, higher contributions by employers and workers and, in the worst case, a reduction in pension rights. Yet, there are clear indications that the picture of the situation at the depth of the crisis was too gloomy. Asset values were exceptionally low due to limited market liquidity and a sharp increase in risk aversion, while interest rates seem unusually low due to a generic ‘flight to quality’. Moreover, in contrast to the usual situation, the swap curve fell below the term structure on high-quality public debt, allegedly because pension funds were trying to hedge against a further fall in the interest rate by buying fixed streams of interest income while selling variable interest income. Hence, the purported danger of a mark-to-market valuation approach is that it requires costly, but often unnecessary, policy adjustments that unduly increase the uncertainty about future pensions and hurt specific groups that find it hard to respond to those adjustments (for example, by working longer). Ideally, measured liabilities would only respond to structural movements in the term structure.
To explore the consequences of different methods of valuing pension fund liabilities, we use stochastic simulations based on a realistic calibration of the Dutch pension system and a full set of demographic, economic and financial shocks representing the aggregate risk in the Dutch economy. Our baseline compares mark-to-market valuation based on the swap curve against valuation based on an average of past swap curves, our sample average swap curve, and a constant and flat (over maturities) discount rate. Our main result is that the alternatives to mark-to-market valuation produce a rather substantial reduction in pension buffer volatility. This implies less frequent adjustment of the policy parameters (in particular, indexation rates and, if necessary, contribution rates). However, aggregate welfare turns out to be slightly higher with mark-to-market valuation, although the differences among the variants are small. These results are not affected in our extensive robustness analysis.
The remainder of the paper is structured as follows. Section 2 presents the model. Section 3 discusses the benchmark calibration, simulation details and the fund's policy rule. The baseline numerical results are discussed in Section 4, while Section 5 reports the results of a sensitivity analysis in order to check the robustness of our results. Section 6 concludes the paper. An online appendix (not for publication) available at http://www1.fee.uva.nl/mint/beetsma.shtm provides further details on the model, the policy rule imposed on the pension fund and the estimation of the shock processes underlying the simulation.
2 The model
We employ an overlapping generations model with a number of D cohorts alive in any given period t. A period in our model corresponds to 1 year.
2.1 Cohorts and demography
By index j=1, …, D we indicate the age of the cohort, computed as the amount of time since entry into the labor force. Individuals face an exogenous age-dependent probability of dying in each period. The probability is stochastic and exhibits a downward trend, thereby causing the population on average to become older over time. Further, we assume that the cohort of newborn agents in period t is 1+n t times larger than the cohort of newborn agents in period t−1, where n t is also stochastic.
2.2 Skill groups and the income process
Each individual belongs to some skill group i, with i=1, …, I, and she remains in her skill group during her entire life. This may be viewed as a strong assumption. However, given that we follow individuals after entry into the labor force, they have finished their schooling and skill differences have largely been settled by then. Moreover, allowing for skill mobility would distract attention from the focus of our paper. Learning-by-doing and experience effectively enter the model through the seniority index, which makes income grow progressively with age. A higher value of i denotes a higher skill level. Further, all the skill groups are of equal size. The skill level of a person determines her income, given her age and the macro-economic circumstances. We allow for skill-induced differences in income, because in the Dutch system below a certain income level individuals do not build up claims to a second-pillar pension and, hence, groups with low skills will hardly be affected by policy changes in the second pillar. In fact, even though the average replacement rate is similar among the skill groups, first-pillar benefits dominate for the low-skilled groups, while second-pillar benefits dominate for the high-skilled groups. The implication is that background shocks affect skill groups differently. In particular, higher-skilled groups are affected more heavily by a change in the second-pillar policy. This may affect the aggregate welfare comparison between different policies. Further, to be able to compare policies in a realistic setting, we want to capture the main elements of relevance in the Dutch system.
Individuals work until their exogenous retirement age R and they live for at most D years. During their working life (j=1, …, R), they receive labor income yi,j,t given by

where e i, i=1, …, I, is the efficiency index for skill group i, s j, j=1, …, R, is a seniority index (income varies with age for a given skill level) and z t is an exogenous process:

where g t is the exogenous nominal growth rate of the process and z 0=1. Hence, individuals in a given cohort in period t only differ in terms of their income, while all individuals in a given skill-group earn the same income.
2.3 Social security and accidental bequests
Social security is based on a two-pillar system that resembles the Dutch pension system. The first pillar consists of a defined-benefit PAYG program that pays a flat benefit to every retiree. This pillar is organized by the government, which sets the contribution rate to ensure that it is balanced on a period-by-period basis. Even though the first pillar does not feature explicitly in our analysis, it provides an important part of retirees' income and, hence, we include it in our model to produce realistic total pensions. The second pillar consists of private pension funds that provide ‘defined benefit’ nominal pensions that are usually indexed to some combination of price rises and productivity increases. Finally, the government redistributes the accidental bequests left by those who die.
The first pension pillar
Each period, an individual of working age pays a mandatory contribution p F i,j, t into the first pillar of the pension system. This contribution depends on the size of his income y i,j, t relative to the thresholds δly t and δuy t:

where δl, δu and θF t are policy parameters and y t is the average income across all working individuals. Hence, for high-income workers the contribution is capped. The retired also pay no contribution. In period t a retiree receives a flat benefit that is a fraction ρF of the average income in the economy:

Given the benefit formula in equation (4), each period the contribution rate θF t is adjusted such that aggregate contributions into the first pillar equal aggregate first-pillar benefits.
Note that under this system an individual on a low income pays no contributions but still receives the same benefit as someone with a high income.
The second pension pillar
Each period, an individual of working age also pays a mandatory contribution p S i,j, t into the second pillar if her income exceeds the franchise income level λy t, where parameter λ denotes the franchise as a share of the average income. Specifically,

where θS t is a policy parameter. We assume that θS t is capped at a maximum value of θS,max >0.
A cohort that enters retirement at age R+1 rceives a benefit linked to its entire wage history. The second-pillar benefit in period t of an individual in skill group i of cohort j is

where the ‘stock of nominal pension rights’ M i,j, t accumulated by the end of period t evolves as

where the parameter μ denotes the annual accrual rate of nominal rights as a share of income above the franchise level. The productivity indexation parameter ιt and the price indexation parameter κt capture the degree of indexation of earlier accumulated nominal rights M i,j−1,t−1 to real income growth,  , and inflation, πt, respectively. Indexation aims at following total wage growth, in which case ιt=κt=1. However, the actual degree of indexation will depend on the financial position of the pension fund. Further, m t captures a proportional change in nominal rights that is applied when the pension buffer is so low that the other instruments (the indexation rates and the contribution rate) are insufficient to restore the buffer within the allowed restoration period (m t<0) or when earlier cuts in nominal rights are undone (m t>0). Each individual enters the labor market with zero nominal claims. Notice that, in contrast to the first-pillar pension benefit, the second-pillar benefit depends on both the cohort and the skill level of the individual.
As we shall describe in more detail below, an important determinant of the policies of the pension fund is the so-called funding ratio F t, which is the ratio between the fund's assets, A t, and its liabilities, L t:

At the end of period t the fund's assets are the sum of the second-pillar contributions from workers in period t minus the second-pillar benefits paid to retirees in period t plus the fund's assets at the end of period t−1 grossed up by their return in the financial markets, which is given by

where r f t is the nominal rate of return on the pension fund's asset portfolio with a constant share z e invested in equities (with return r e t) and the remainder invested in long-term bonds (with return r lb t). In view of their long-term obligations, pension funds have a preference for investing in long-term, rather than short-term, debt. Here, we assume that the entire fixed-income part of the pension fund's portfolio consists of 10-year zero coupon bonds. We assume that the returns on these long-term bonds and equities are determined on the international financial markets and are, therefore, exogenous. Our assumption that the pension fund only holds 10-year bonds implies that at the end of each year bonds of 9-year maturity are sold to purchase new 10-year bonds. The online appendix shows that

where r b 10,t−1 (r b 9,t) is the yield on 10-year (9-year) zero coupon bonds in t−1(t).
The fund's liabilities are the sum of the liabilities to all cohort-skill groups currently alive:

where L i,j,t is the fund's liability to the cohort of age j and skill level i, which is computed by discounting the projected future nominal benefits resulting from the current stock of nominal rights against a term structure of annual nominal interest rates  :

where ψj,t−j+1∊[0,1] is the probability that a person who enters the labor force at age zero at the beginning of period t−j+1 reaches age j at the end of period t, conditional on having reached age j−1 at the end of period t−1. When j⩽R, we discount all future benefits to the current year t, but of course they will only be paid out once individuals have retired. Importantly, notice that computation of the liabilities excludes the effects of possible future indexation. This is also why pension funds that aim at maintaining the purchasing power of the accumulated rights need to maintain a funding ratio that is substantially above 100%.
Accidental bequests
The role of accidental bequests is to ensure that resources do not ‘disappear’ because people die. All personal (non-pension) financial wealth of those who die is collected by the government. This is then distributed equally over all individuals alive at time t.
2.4 The individual decision problem
In a given period t an individual of skill group i in cohort j chooses sequences for nominal consumption and the share of savings invested in equity for the rest of her life. Hence, the individual solves

where  is real consumption, x i,j+l,t+l is the portfolio share invested in equity and u(.) is the period utility function, which we assume to be of the standard constant relative risk aversion format with coefficient of relative risk aversion (CRRA) γ>0,

subject to the intertemporal budget constraint

where a i,j+l,t+l are the financial assets of this cohort in year t+l and ỹ i,j+l,t+l is ‘net income’ (i.e. labor or pension income plus the accidental bequest h t+l minus contributions),

and subject to the expression of the overall return on the individual's asset portfolio in period t+l,

where r b 1,t+1 is the return on 1-year bonds. In contrast to the pension fund's portfolio, the individual's portfolio only includes short-maturity bond holdings. This assumption is intended to reflect the difference in investment horizon between pension funds and individuals, but has no consequences for the results.
The optimal individual decisions  at time t for skill group i of cohort j follow from the first-order conditions:

2.5 The shocks
We assume that there are only aggregate, hence no individual-specific, exogenous shocks. Specifically, we consider demographic shocks (to the growth rate of the newborn cohort and to survival probabilities), macro-economic shocks (inflation rate shocks, nominal income shocks) and financial market shocks (to equity returns, the swap curve and the bond yield curve). All the shocks are collected in the vector  with the following elements.
• εn t: the shock to the newborn cohort growth rate, n t.
• εψt: a vector of shocks to the set of survival probabilities
 .
• εg t: the shock to the nominal income growth rate, g t.
• επ t: the shock to the inflation rate, πt.
• εe t: the shock to the nominal equity return, r e t.
• εb k,t, k=1,…,D: the shock to the bond return at maturity k, r b k,t.
• εs k,t, k=1,…,D: the shock to the swap return at maturity k, r s k,t.
 .
All these shocks affect the size of the funding ratio (equation (8)), whereas only demographic shocks affect the first pillar of the pension system. As a consequence, when these shocks materialize the key parameters of the pension system have to be adjusted to restore the balance in the first pillar and to maintain sustainability in the second pillar.
The online document reports details of the estimation of the shock processes. The survival probabilities evolve according to a Lee and Carter (Reference Lee and Carter1982) model and are independent of the other shock processes. Further, we allow the newborn growth rate, the inflation rate, the nominal income growth rate, the 1-year bond return and the equity return to be correlated with each other and over time. Jointly, these variables follow a vector autoregressive (VAR) process of order one. In particular, we have
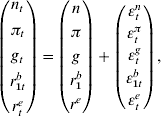
with means (n, π, g, r b 1, r e)′ and innovations (εn t, επ t, εg t, εb t, εe t)′ for year t that follow a multivariate annual VAR(1) process,

As regards the swap curve, we normalize the average swap rate at maturity k⩾1 years to a calibrated average 1-year bond yield r b 1 plus the sample average difference between the swap rate at maturity k and the 1-year bond yield. In this way we make swap rates comparable in magnitude to the calibrated average 1-year bond yield. The stochastic part of the swap curve is modeled as follows.Footnote 1 We take the difference of the actual swap curve observations from the sample average swap curve and, following the prevailing literature (see e.g. Evans and Marshall, Reference Evans and Marshall1998; Dai and Singleton, Reference Dai and Singleton2000), we model these excess rates as a vector autoregressive distributed lag (VADL) process with lag 1. The predetermined part of this process consists of the excess rates at all maturities in period t−1 and the period t−1 shocks to the VAR(1) process just described. The random part of the VADL(1) process is given by innovations that are allowed to be correlated across maturities.
The bond yield curve is modeled similarly to the swap curve. The average bond yield at 1-year maturity is the calibrated value r b 1. The average bond yield at maturity k⩾2 is normalized to r b 1 plus the sample average difference between the bond yield at maturity k and that at maturity 1 year. The stochastic part of the bond yield curve at maturities k⩾2 is modeled analogously to that of the swap curve.
2.6 Welfare measures
Welfare is evaluated at the start of year t=1 in our simulations (see below) – for notational convenience we drop the time subscript. Individual welfare for skill class i∊{1,..I}, cohort j∊{1,..D} at the start of year 1 is given by V i,j,1. For aggregate welfare we use two measures. The first, S A, is the unweighted average of the intertemporal utilities of all individuals alive at the start of the simulation,

while the other measure, S T, is defined as the unweighted average of the intertemporal utilities of all alive and unborn individuals, where we discount future generations' utility at an annual rate q:

with q the rate at which we discount welfare of future generations. Note that in (14) the sizes of unborn generations are normalized to the size of the population alive in year t=1. In the simulations, we will truncate the computation of welfare to 250 unborn generations, as the discounted welfare of subsequent generations becomes negligible in equation (14).
To ease the interpretation of our welfare measures, we report them in terms of ‘certainty equivalent consumption’. For an individual of age j, and skill level i, this is the certain, constant consumption level (denoted CEC i,j) over the remainder of her lifetime that gives her a utility equal to V i,j:

In the case of our aggregate welfare measures, we express ‘certainty equivalent consumption’ as the certain, constant consumption level, denoted CEC ϒ(ϒ=A,T), over the remaining lifetime of a person of average age  in the economy in year t=1 that yields her utility equal to S ϒ,

where

and int() is the function that generates the largest integer smaller than or equal to the number inside the parentheses.
3 Benchmark calibration, simulation details and policy rules
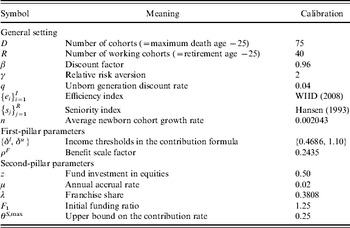
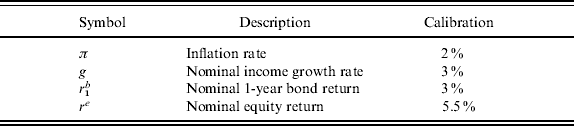
We calibrate the parameters of the model to reproduce the main features of the Dutch economy. Tables 1 and 2 summarize our benchmark calibration.
Calibration of exogenous parameters

3.1 Benchmark calibration
We assume that the economically active life of an agent starts at age 25. Individuals work for R=40 years until they reach the age of 65. They live for at most D=75 years, until age 100. The discount factor β is set to 0.96, as is common practice in the macro-economic literature. The CRRA γ is set to 2. While there is substantial uncertainty about the size of the coefficient, this assumption is in accordance with much of the macro-economic literature (see e.g. Imrohoroglu et al., Reference Imrohoroglu, Imrohoroglu and Joines2003) as well as estimates at the individual level (e.g. Gertner, Reference Gertner1993; Beetsma and Schotman, Reference Beetsma and Schotman2001). To compute the welfare measure (14), we try several discount rates q for the utility of unborn generations. However, qualitatively the results are insensitive to the specific value of q and we simply set q=10%. The efficiency index  is given by the income deciles in the Netherlands for year 2000 taken from the World Income Inequality Database (WIID, version 2.0c, May 2008). We normalize the index to have an average of 1. The seniority index
 uses the average of Hansen's (Reference Hansen1993) estimation of median wage rates by age group. We take the average between males and females and interpolate the data using the spline method.
The social security parameters mimic the institutional framework in the Netherlands. For the first pillar, the Dutch Tax Office (‘Belastingdienst’) reports for 2008 a maximum income assessable for contributions of EUR 3,850.40 per month. We therefore set our upper income threshold for contributions δu=1.10, roughly equal to 3,850.40∗12/42,403, where EUR 42,403 is our imputation of the economy's average income as of 2008.Footnote 2 The lower income threshold is set to δl=0.4686, so as to generate an initial contribution rate of θF 1 =12.77%, identical to the initial second-pillar contribution rate, θF 1= θS 1, calculated assuming that aggregate contributions at time 1 coincide with aggregate benefits in the absence of shocks. We finally set the benefit scale factor ρF=0.2435.
For the second social security pillar, we set z=0.50 for any level of the funding ratio F t. Our choice roughly corresponds to the balance sheet average for Dutch pension funds over the past 10 years (source: DNB, 2009). Because the bond and equity investments in the pension fund's portfolio generally have different realized returns, at the end of each period t its portfolio is reshuffled such that the system enters the next period t+1 again with the original portfolio weight z=0.50. Further, we set the accrual rate to 2% and the franchise to λ=0.3808.Footnote 3 The choices of ρF and λ are meant to generate realistic replacement rates that on average are equal to 30.40% for the first pillar and to 37.60% for the second pillar. The first-pillar replacement rate is higher for lower-skilled groups, and on average it ranges between 12.06% and 63.33%; the second-pillar replacement rate is higher for higher-skilled groups, and on average it ranges between 3.78% and 56.64%. Overall, the total replacement rate from the two pillars is higher for higher-skilled groups, and on average it ranges between 67.11% and 68.70%.
Initial assets are set so as to generate an initial funding ratio of F 1=1.25 in the absence of shocks.Footnote 4 The pension fund starts by providing full price indexation (κ1=1) and zero productivity indexation (ι1=1). As already mentioned, the initial second-pillar contribution rate ensures that aggregate contributions and benefits at t=1 are equal in the absence of shocks. This implies that θS 1=12.77%, which is close to the actual value in the Netherlands. The contribution rate is capped at θS,max=25%.
The deterministic component of the growth rate of the newborn cohort, n=0.2043%, is the historical average growth rate computed from 100 annual observations of the number of births in the Netherlands between 1906 and 2005 (source: Human Mortality Database). The combination of birth rates and survival probabilities, estimated using the Lee and Carter (Reference Lee and Carter1992) model, determines the size of each cohort. The starting value of the old-age dependency ratio (i.e. the ratio of retirees over workers) is 21.00%, in line with OECD (2009) figures for the Netherlands in 2005.
The calibration of average annual values of price inflation, nominal income growth rate, and bond and equity returns is crucial (see Table 2). We loosely follow the literature in this regard (see e.g. Brennan and Xia, Reference Brennan and Xia2002; Van Ewijk et al., Reference van Ewijk, Draper, ter Rele and Westerhout2006) and set the average inflation rate at π=2%, the average nominal income growth rate at g=3% (which corresponds to an average real productivity growth of 1% per year) and the average 1-year bond interest rate at r b
1=3%. Since our attention primarily concerns the volatility of the funding ratio, we assume that the expected return on the pension fund's long-term bond portfolio equals the expected return on short-term bonds, i.e. r lb=r b
1. Since the average of  in the simulations exceeds 1+ r b
1, we correct the simulated returns on long-term bonds by subtracting in each simulation run from these returns the average over the simulation run of
 and adding the constant r b
1 to those numbers. The average equity return is set at r e=5.5% to generate a funding ratio that is stable over time in the absence of shocks and changes in the policy parameters.Footnote 5
Calibration of the averages of random variables

To obtain the optimal consumption rules we solve the individual decision problem recursively by backward induction using the method of ‘endogenous grid points’ (Carroll, Reference Carroll2006). Shocks to the newborn growth rate, the inflation rate, the income growth rate, and the bond and equity returns introduce, through equation (13), five state variables into the model. To avoid the curse of dimensionality caused by having too many state variables, we determine the optimal rule in year t under the assumption that the shocks in year t−1 are all equal to 0, i.e. εn t −1=επ t −1=εg t −1=εb t−1=εe t−1=0. We approximate the random variable distributions by means of a Gauss–Legendre quadrature method (see Tauchen and Hussey, Reference Tauchen and Hussey1991) and discretize the state space using a grid of 100 points with triple exponential growth.Footnote 6 For points that lie outside the state space grid, we use linear extrapolation to derive the optimal rule.
3.2 Simulation details
We simulate Q=1,000 times a sequence of vectors of unexpected shocks over 2D−1+250=399 years, drawn from the joint distribution of all the shocks. Our welfare calculation is based on the economy as of the Dth year in the simulation. Hence, we track only the welfare of the cohorts that are alive in that year, implying that those that die earlier are ignored, and we track the welfare of cohorts born later, the latest one dying in the final period of the simulation. In other words, the total number of years of one simulation run equals the time distance between the birth of the oldest cohort that we track and the complete extinction of the last unborn cohort that we track. At each moment there are D overlapping generations. For convenience, we relabel the Dth year in the simulation as t=1. The purpose of simulating the first D−1 years is to simply generate a distribution of the assets held by each cohort at the end of t=0.
In each simulation run, we assume that the ageing process stops after t=40. That is, the mortality rates at any given age no longer fall. This assumption is in line with the fact that some important ageing studies, such as those by the Economic Policy Committee and European Commission (2006) and the United Nations (2009), only project ageing (and its associated costs) up to 2050, hence roughly 40 years from now. Moreover, it is hard to imagine that mortality rates continue falling for many more decades at the same rate as they did in the past. In particular, many of the common mortal diseases have already been eradicated, while it will become more and more difficult to treat the remaining lethal diseases. Effective treatment of these diseases will also surely be held back by the fact that the share of national income that can be spent on health care is bounded. To avoid an ever-growing population, we also assume that the average growth rate of the number of newborns falls to zero after t=40.
To allow for the cleanest possible comparison among the various discounting policies, we use the same shock series for all policies, while, moreover, during the initialization phase of each simulation run no policy responses occur. That is, all policy parameter values are set at their t=1 levels (complete price indexation, zero productivity indexation and a constant contribution rate). Hence, the situation at the start of t=1 (before choices are made) is identical in each run under the various policies. Because welfare depends on the size of the buffer after the initialization period in the simulation run, we reset the stock of pension fund assets such that the buffer at the end of t=0 equals 1.25. Finally, the process z t is renormalized to unity at the end of t=0 and the nominal pension claims of the various cohorts are rescaled by the same amount. At the start of the preceding D−1 ‘dummy’ years, liabilities are set at the steady state values implied by the income level at that moment. They are computed using (7) under the assumption of no shocks (i.e. expectations are treated as if they are realized).
3.3 The policy rule
The government automatically adjusts the contribution rate θF t∊[0, 1] to maintain a balanced first pension pillar. On average, this contribution rate increases over the years along with the ageing of the population.
More policy options are available to affect the funding ratio of the second pillar. There are three key parameters, whose period t+1 values are determined on the basis of the funding ratio F t in period t: the contribution rate θS t+1∊[0, θS,max], the two indexation parameters {κt+1⩾0, ιt+1⩾0} and, as a last resort, a reduction in the nominal pension rights (m t+1<0). The board of the fund selects the contribution rate and the indexation parameters, but can only reduce nominal rights under special circumstances, as described below.
The online appendix describes the policy rule in detail. Policymakers start with a benchmark parameter combination {θS
1, κ1 ι1} and a funding ratio equal to ξm=1.25. We set κ1=1 (complete price indexation) and  (zero productivity indexation). We define two threshold values for the funding ratio, ξl and ξu, with ξl<ξm<ξ u and ξl>1. In particular, we set ξl=1.05 and ξu=1.50. All policies are identical when the funding ratio F t is above ξm. In that case, after restoring possible earlier cuts in nominal rights, the fund's board sets the contribution rate at its initial level θS
1, price indexation to κt+1=1 and productivity indexation to
 . Hence, productivity indexation increases linearly in F t and becomes complete at ξu; it continues to increase at the same rate as F t rises above ξu. In this way the funding ratio is stabilized from above.
As mandated by the Dutch Pension Law, when the funding ratio falls below ξm, but remains above ξl, a long-term restoration plan is started, while when it falls below ξl a short-term restoration plan is started. The latter situation is termed ‘underfunding’. The long-term restoration plan requires a restoration of the funding ratio to at least ξm in at most K l=15 years (ignoring possible future shocks), while the short-term restoration plan requires its restoration to at least ξl in at most K s=5 years (ignoring possible future shocks). In the case of both a short-term and a long-term restoration plan, productivity and price indexation are always reduced first. If the adjustment is insufficient, the other instrument is also adjusted. Conforming to Dutch Law, when there is underfunding (F t>ξl) and the adjustments in the indexation parameters and the contribution rate are jointly insufficient, nominal rights are scaled back by whatever amount is necessary to eliminate the underfunding within the allowed restoration period. In the case of a long-term restoration plan, nominal rights remain untouched.
4 Results
4.1 Benchmark
Below, we will explore the consequences, for welfare and pension buffers, of different ways of discounting future pension payments. Our benchmark will consider four alternatives:
1. Discounting against the market swap curve,
, where describes the period-t swap curve.2. Discounting against a weighted average of current and past swap curves,
, where , and L=5 years is the number of current and past curves included.3. Discounting against the average swap curve
, where is the average swap curve computed over our sample period. Hence, discounting of all future liabilities takes place using a set of constant (over time) discount rates.4. Discounting at some constant and flat (across maturities) rate,
. We set d=4.99% at all maturities.
 , where
 describes the period-t swap curve.
 , where
 ,
 and L=5 years is the number of current and past curves included.
 , where
 is the average swap curve computed over our sample period. Hence, discounting of all future liabilities takes place using a set of constant (over time) discount rates.
 . We set d=4.99% at all maturities.
The second variant follows a ‘dampened’ mark-to-market approach, and hence potential structural changes in the market swap curve are still tracked. However, this case tries to avoid as much as possible the effects of high-frequency fluctuations in the swap curve that reverse themselves later. As regards the third variant, the online appendix shows that the average swap curve exhibits a quadratically looking profile, while as regards the fourth variant, we notice that the selected discount rate is exceeded by the average swap rate only at maturities longer than 15 years. Further, note that the final year in the term structures that we consider is D periods from now, so that all future pension payments associated with existing accumulated nominal rights can be discounted. Finally, all variants considered here imply identical initial asset levels and, hence, maximum comparability of aggregate welfare across the various discounting policies under consideration.Footnote 7
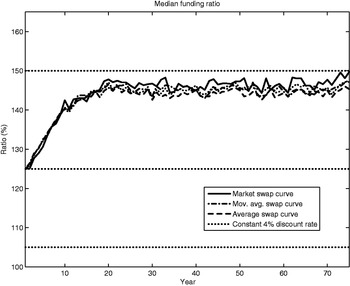
Figure 1 shows the median funding ratio under the different discounting variants.Footnote 8 Not surprisingly, in all cases our policy rule produces a median funding ratio between the thresholds ξm and ξu, fluctuating mostly around  .
Median funding ratio

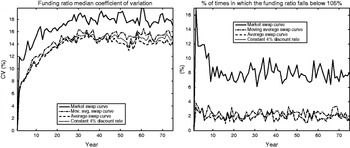
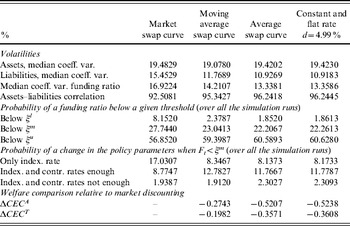
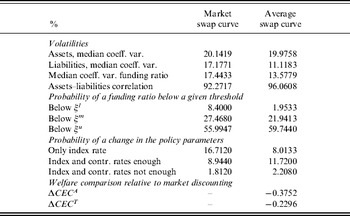
The variants differ in terms of the volatility of the funding ratio. Panel a) of Figure 2 shows the median coefficient of variation of the funding ratio, that is, the ratio between its median volatility (measured as half the interquartile range) and its median value. Compared with the case of discounting against the market swap curve, the volatility of the funding ratio is on average around 15% smaller when liabilities are discounted using a moving average swap curve and around 20% smaller when they are discounted using either a constant average swap curve or a constant and flat discount rate. This reduction of volatility is driven by the more stable liabilities under the alternatives to mark-to-market valuation (see Table 3). Differences in the volatility of the funding ratio also manifest themselves in the probability of underfunding, i.e. the likelihood that the funding ratio falls below ξl in the simulations (see panel b) of Figure 2 and Table 3). The likelihood of underfunding under its alternatives is in the longer run substantially lower than under mark-to-market valuation (on average around 2% against around 8% mark-to-market valuation). Not surprisingly, the higher volatility of the funding ratio under mark-to-market valuation also shows up in a higher likelihood that the threshold ξu for full indexation is exceeded.
Funding ratio volatility
Panel (a) Median coefficient of variation. Panel (b) Probability of falling below 105%.

Benchmark comparison of discounting variants

Note: ‘coeff. var.’ is ‘coefficient of variation’.
Table 3 reports additional summary statistics. It is worthwhile to noting the high correlation between assets and liabilities. Ceteris paribus, a higher correlation dampens the volatility of the funding ratio. The high correlation is to a large extent driven by our policy rule, which tends to stabilize the funding ratio, thus counteracting the wedge driven between assets and liabilities by any exogenous shock. As a result, the two components of the funding ratio tend to move into identical directions. In addition, some of the shocks (to income growth and demography) tend to move assets and liabilities into the same direction. However, shocks to the bond returns, which influence both the realization of the market swap curve and the fund's portfolio return, have opposite effects on assets and liabilities. For instance, a positive shock to bond returns produces a rise in the value of the fund's assets (its portfolio earns a higher return), while liabilities fall (the market swap curve tends to shift upward, implying heavier discounting). Indeed, in the case of discounting against the market swap curve, the correlation between the fund's assets and liabilities is slightly lower than in the other cases.
The third panel of Table 3 reports the frequency at which only the indexation parameters need to be adjusted to produce an acceptable restoration plan, the frequency at which adjustments in the indexation parameters and the contribution rate are necessary and sufficient for such a plan, and the frequency at which also nominal rights need to be cut. This is the last resort for restoration and it is applied in roughly 2% of all the observations (i.e. roughly once every 50 years). In the case of mark-to-market discounting, a change in only the indexation parameters is usually sufficient, while under the other variants in most of the relevant cases the contribution rate also needs to be changed.
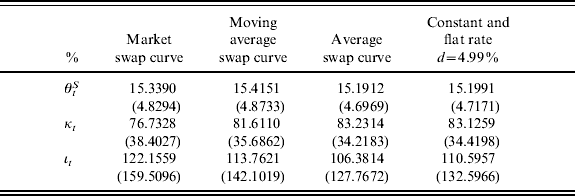
Table 4 reports the average (over all observations) values of the policy parameters together with the standard deviations. All averages are rather similar across the variants and the same is the case for the standard deviations. Only price indexation is a bit lower and productivity indexation a bit higher on average under mark-to-market discounting than under the alternatives.
Average policy parameters
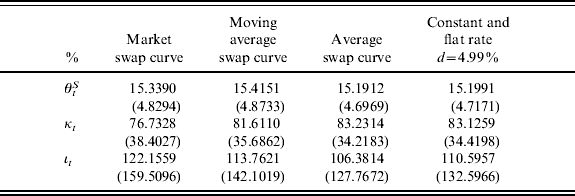
Note: Standard deviation is within parentheses.
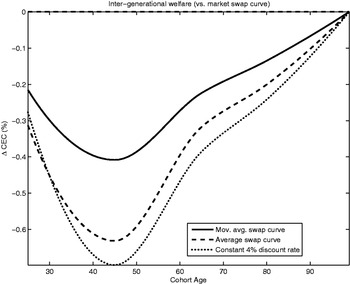
Mark-to-market discounting implies the highest aggregate welfare level because the policy interventions, although slightly more frequent than in the other cases, tend to be milder. However, not surprisingly, given the limited differences in funding ratio behavior and in the policy parameters, welfare differences among the alternatives are small and not more than 0.5% in terms of certainty-equivalent consumption. Differences among cohorts are also small, as Figure 3 shows. This figure shows a cubic interpolation over the cohort-specific differences in certainty-equivalent consumption relative to mark-to-market discounting. All cohorts prefer mark-to-market discounting, although the differences in certainty-equivalent consumption, which peak at around the middle of working life, are always small (a maximum of 0.7%).
Welfare comparison for existing generation
Note: ΔCEC>0 means better off under alternatives to discounting against the market swap curve.

4.2 Alternative ways of discounting future pension benefits
Alternative moving average swap curves
We now consider alternative moving averages of the swap curve. The first alternative takes an equally weighted moving average over the past 20 curves (L=20 and  for l=0,…, L − 1). Increasing the window L should generate a more stable moving average curve. The second alternative assumes that more recent swap curves receive a relatively higher weight in the computation of the moving average. In particular, under this alternative the weights are given by
 for l=0,…, L−1 with L=5.
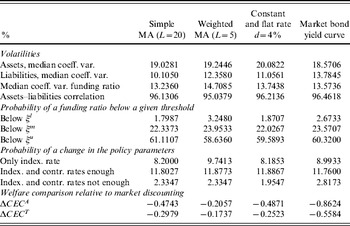
The summary statistics for these alternatives are found in columns 2 and 3 of Table 5. As expected, increasing the window L reduces the median coefficient of variation of the funding ratio (to 13.24% against 14.21% under the original 5-year window), which is rather close to the volatilities under the average swap curve and the constant and flat discount rate reported in Table 3. The volatility under the weighted moving average is slightly higher than the volatility with the simple moving average at window L=5. Comparing Table 5 with Table 3, we see that aggregate welfare is slightly higher under a weighted moving average than under a simple moving average with an identical window, while a smaller window (L=5) seems preferable to a larger window (L=20). However, none of these alternatives is preferred to discounting against the market swap curve.
Comparison with alternative discounting methods

Note: ‘coeff. var.’ is ‘coefficient of variation’ and ‘MA’ is ‘moving average’.
Alternative constant and flat discount rate
Until quite recently Dutch pension funds used a constant and flat rate d=4% to discount future pension benefits. Compared with our benchmark, the pension fund needs to hold a higher initial level of assets in order to enter each simulation run with a funding ratio of 125%. This may affect the welfare comparison with mark-to-market discounting. The next-to-last column of Table 5 reports this case and shows that the welfare difference with this benchmark is small.
Discounting against the bond yield curve
From a policy perspective, it may also be interesting to see how the results are affected if we use an alternative term structure of interest rates to discount future pension benefits. We now consider mark-to-market valuation of the liabilities using the term structure of yields on high-grade public debt (the ‘bond yield curve’). In the simulations all the shock series are identical to those before, except that the shocks to the bond yield curve replace the shocks to the swap curve. Because the bond yield curve generally lies below the swap curve, the average size of the liabilities is slightly higher. The initial level of liabilities is 1.4131 times the GDP rather than 1.3406 times the GDP. Also, the correlation between the assets and liabilities of the fund rises slightly, because the shocks to the bond returns affect both components of the funding ratio directly (compare the last column of Table 5 with the second column of Table 3). In turn, this implies that the funding ratio is slightly more stable when the bond yield curve rather than the swap curve is used: 13.57% (Table 5) instead of 16.92% (Table 3). Also, the frequency at which indexation rates need to be reduced and the frequency at which the contribution rate should be raised fall.
5 Sensitivity analysis
5.1 Short-term bonds in the pension fund portfolio
The analysis so far has assumed that the pension fund holds 10-year bonds. However, the maturity of the fund's bond holdings may not be an innocent choice. It is conceivable that a reduction in the maturity of the fund's bond portfolio lowers the correlation between the fund's assets and liabilities and, hence, affects the volatility of the funding ratio. After all, a downward shift in the swap curve raises the level of the liabilities, but it also raises the value of the fund's bond holdings (because the swap curve and the bond yield curve tend to move rather closely together). The effect on the fund's bond portfolio will be smaller, though, the lower its duration, suggesting that effects of shocks other than those to the swap curve may now play a relatively more important role, thereby leading to a lower correlation between the values of the assets and the liabilities.
In this subsection we assume that the fund's bond investments consist entirely of 1-year zero coupon bonds with return r b 1,t. Hence, the fund's total portfolio return now becomes

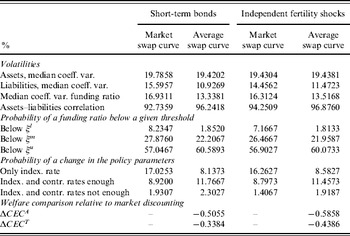
The first two columns of Table 6 report the statistics for the simulation of this case, both under mark-to-market liability valuation and under valuation using the average swap curve. Aggregate welfare is hardly affected by the switch to short-term bond holdings (compare Table 6 with Table 3). Also, the key statistics are very similar to those reported in Table 3 for the corresponding variants. Finally, the welfare comparison between the two variants is qualitatively unaffected.
5.2 Independent fertility shocks
Because of the lack of higher-frequency data, our benchmark calibration assumes a constant newborn growth rate within the year. Since this assumption may appear too strong, we now assume that the newborn growth rate is independent of the economic and financial shocks and follows an annual-frequency AR(1) process, while the inflation rate, the income growth rate, and the bond and equity returns jointly follow a VAR(1) process.Footnote 9 Further details on this model and the calibration process are available in the online appendix.
The last two columns of Table 6 report the results for mark-to-market liability valuation and for valuation using the average swap curve. Compared with our baseline situation reported in the previous section, the results are virtually unaffected.
Sensitivity analysis

Note: ‘coeff. var.’ is ‘coefficient of variation’.
5.3 Regime switches
An important rationale for applying mark-to-market valuation rather than discounting at some time-invariant yield curve is that mark-to-market valuation allows calculation of the liabilities to track structural shifts in the term structure. For example, a persistent fall in the real interest rate (holding inflation constant) that is not reflected in a reduction in the rate at which future pension payments are discounted would result in an increase in the value of the pension fund's portfolio (through an increase in the value of its long-term bond holdings) without a corresponding increase in its measured liabilities. This would give the false impression of an improved funding ratio, which leads to more generous indexation and/or lower pension contributions. At some moment the payment of the pensions would get under pressure as the mismatch between the true (market) value of the liabilities and the value of the fund's assets becomes too large.
In this subsection we allow for occasional shifts in the average 1-year bond return r b 1. In a given year t the realization of the bond return follows from the process in equation (12), where its average r b 1 may take on one of two values:

with q t a random variable. The average return is assumed to remain the same for 10 years. After 10 years, the probability of having q t+10=1 or 0, that is, a relatively high or low average bond return, depends only on q t:

A variation of 2 in the average bond return has a direct effect on the level of returns in the swap curve, which shift by the same amount 2. Note that in the benchmark scenario we implicitly assume that =0 (no change in average return). Here we set =0.03 and =0.01. For the purpose of comparability with the analysis so far, we impose the restriction that r b1 coincides in expectation with the value in the benchmark case (3%),

from which we have that p 1,1=p 0,1=p 1,0=p 0,0=0.5.
Table 7 reports the summary statistics for this case. The key statistics are rather similar to those reported in Table 3, while the aggregate welfare comparison between mark-to-market liability valuation and valuation using the average swap curve is unaffected.
Regime switches: bond returns

Analogous to introducing occasional regime switches in the average 1-year bond return, we can introduce occasional regime switches in the average equity return r e and the average nominal income growth rate g. The process for the regime switches is identical to that for r b 1 with equal deviations from the average under the benchmark and equal transition probabilities. The results, reported in the online appendix, reveal little difference with those reported for the baseline.
5.4 Heterogeneity in risk aversion and fertility across skill groups
So far, individuals of a given age in different skill groups only differed in terms of their skills. In this subsection we allow for systematic differences among skill groups along other dimensions as well. In particular, we will explore the consequences of systematic differences in risk aversion and in fertility rate. There exists literature that suggests that risk aversion and wealth are related (see Siegel and Hoban, Reference Siegel and Hoban1982; Morin and Suarez, Reference Morin and Suarez1983, Bucciol and Miniaci, Reference Bucciol and Miniaci2008), although there is no consensus on the direction of the relationship. Given that differences in wealth are to a large extent driven by differences in income (and, hence, skills), it is of interest to explore whether our results are robust to introducing a systematic relationship between skills and risk aversion. To this end, we aggregate the skill groups into the categories ‘low skill’ (skill groups 1–3), ‘average skill’ (skill groups 4–7) and ‘high skill’ (skill groups 8–10) and we explore two cases while always keeping average relative risk aversion at its benchmark value of γ. In one case, we assume relative risk aversion coefficients of γ−1, γ and γ+1 for, respectively, the ‘low skill’, ‘average skill’ and ‘high skill’ groups. In the other, the relative risk aversion coefficients are γ+1, γ and γ−1 for, respectively, the ‘low skill’, ‘average skill’ and ‘high skill’ groups. Since pension contributions are driven by the pension rule and exogenous income developments, the behavior of the funding ratio and the policy parameters is identical to that in the benchmark case. Further, the aggregate welfare comparison is hardly affected. When risk aversion is increasing with skill, a switch from mark-to-market valuation to discounting against the average swap curve produces a fall in ΔCEC A (ΔCEC T) of 0.38% (0.37%), while when risk aversion is decreasing with skill, the switch gives rise to a fall in ΔCEC A (ΔCEC T) of 0.57% (0.59%).
We have also explored how the results are affected when fertility varies systematically with skill level, where we assume the average fertility rate to remain unchanged. Again, we consider two cases. In the first, we let fertility increase with skill (n −0.01, n and n+0.01 for, respectively, the ‘low skill’, ‘average skill’ and ‘high skill’ categories). In the second, we let it decrease with skill (n+0.01, n and n−0.01 for, respectively, the ‘low skill’, ‘average skill’ and ‘high skill’ categories). We assume that the offspring belongs to the same skill group as the parent. Hence, heterogeneity in the fertility rate affects the funding ratio by affecting the distribution of skills. In turn, this may influence policy reactions and welfare. However, the simulations show outcomes that are very similar to those under the baseline. Hence, we report the numerical results in only the online appendix.
6 Conclusion
In this paper we have investigated the implications of alternative methods of discounting future pension outlays for the valuation of funded pension liabilities. The resulting differences in measured liabilities affect the funding ratios of pension funds and, thereby, their policies. In particular, we have explored the consequences for the volatility of pension buffers, policy parameters and welfare. The framework for our analysis was an overlapping-generations model of a small open economy, featuring a two-pillar pension system calibrated to that in the Netherlands. The economy was subjected to demographic, economic and financial shocks. We compared discounting of pension outlays against the market swap curve (the method currently followed in the Netherlands) against discounting against a moving average of past swap curves, discounting against the average swap curve and discounting against a constant and flat interest rate. Our main result is that the three alternatives to mark-to-market valuation produce a rather substantial reduction in pension buffer volatility. However, aggregate welfare turns out to be slightly higher with mark-to-market valuation, although the differences among the variants are small. The robustness analysis that we conducted did not affect these results.