Although Latinos have grown substantially as a percent of the American population to now comprise the largest ethnic-racial minority group in the U.S., whether or not this national population growth can translate into direct political influence in presidential elections has always been unclear (DeSipio Reference DeSipio1996; Fraga and Ramírez Reference Fraga and Ramírez2003–04). At least since the 1988 election, however, scholars of Latino politics have argued that Latino voters could serve as key swing voters if certain contextual and strategic conditions existed in specific contests (Guerra Reference Guerra, de la Garza and DeSipio1992). Among these are: a competitive election in states where Latinos are a determinative segment of the electorate; strategic mobilization of Latino voters; active engagement in the election by Latino elected officials, related organizational leaders, and Latino campaign strategists; a viable Latino candidate; and issues of specific relevance to Latino voters (Guerra and Fraga Reference Guerra, Fraga, de la Garza and DeSipio1996).
In this essay we argue that all these conditions were manifest in the 2008 primary election cycle and that many—indeed most—will also characterize the 2008 general election. Specifically, in this essay we will make five claims that we believe are well supported by the evidence and events of this election cycle. First, the historic candidacy of Governor Bill Richardson (D-NM) brought a focus to Latinos in general and especially to the importance of Latino voters early in the Democratic primary. Although his candidacy was short-lived, he brought a further credibility to Latino voters as key constituents of the Democratic Party. Second, Latinos were critical in determining the outcome of the primary election (or caucus) in a number of important and well-timed states and, at several of these crucial moments, preserved the viability and longevity of the Clinton campaign for the Democratic nomination. Third, we will examine the distribution of the Latino primary vote—and its strong tilt toward Hillary Clinton (D-NY)—and suggest that this preference has much more to say about the nature of the two campaigns and the name recognition of the respective candidates, and a lot less to say about any underlying social biases Latinos may possess and their long-term willingness to vote for an African American candidate. Fourth, we will look ahead to the general election and argue that the geographic concentration of Latino voters, particularly in potentially pivotal states like Colorado, Nevada, New Mexico, and Florida, substantially increases the chance that Latino voters will have a significant impact in determining the national outcome. Finally, we will examine the selection of John McCain (R-AZ) as the Republican nominee, and suggest that—among all the potential GOP nominees—he alone introduced a complicating factor that further placed Latino voters at the center of the national campaign. McCain was unique among major Republican candidates in having a history of both receiving considerable support from Latino voters in his home state and of promoting comprehensive immigration reform that included a pathway to citizenship for unauthorized immigrants. All of these dimensions of the 2008 presidential election make it impossible to understand critical components of the 2008 presidential election without understanding the unprecedented role played by Latinos and especially Latino voters.
The Latino Candidate for President
On May 21, 2007, William Blain Richardson III returned to Los Angeles, California, his birthplace, to officially announce his candidacy. The first sentence of his bilingual address was, “Con orgullo, espero ser el primer presidente latino de los Estados Unidos” (With pride, I hope to be the first Latino president of the United States). Richardson was not the first Latino to run for president (that honor goes to millionaire Ben Fernandez who competed in 18 of the Republican primaries in 1980), but he is considered the first credible Latino candidate.
Based on his long résumé of public service, many political observers thought Richardson was the best qualified among the declared candidates for president (Appleman Reference Appleman2007). After watching and listening to the seven-term congressman, former UN ambassador, former secretary of energy, international diplomat, and current governor of New Mexico interact with the audience as he unpretentiously discussed his list of accomplishments, White (Reference White2007) felt Richardson was easily the most impressive among all the candidates at the Democratic National Committee Winter 2007 Meeting. Moreover, the conventional wisdom was that since Richardson was Latino, he would have substantial Latino support, something especially needed in the swing states (Economist 2007). Also recall that Richardson was already in his second term as governor of a state with a critical mass of Latino voters that will likely be key in determining the outcome of the general election. Richardson's entrance into the contest clearly stimulated early interest in the potential impact of the Latino vote.
Muchos Problemas for Richardson
From the beginning, however, Richardson's campaign faced major obstacles. Most importantly, he did not have the national name recognition of Hillary Clinton and John Edwards, or even Barack Obama, and he certainly did not have their “star power” when it came to fundraising. Additionally, Richardson faced a problem common to racial-ethnic minority candidates seeking higher office. He was the Latino candidate but he did not want to be judged as representing only voters of his ethnicity. Thus another significant challenge for his campaign was to resonate with all voters, and at the same time appeal especially to his presumed voter base. Unfortunately, multiple polls indicated that Richardson was not well known among Latinos outside of his home state and his Anglo surname exacerbated the challenge for Richardson to successfully connect with Latino voters (Parker Reference Parker2007).
Mi Familia con Richardson
Richardson's perceived potential to mobilize the Latino vote probably instigated the Clinton campaign's early interest in courting Latino votes and locking up the endorsements of Latino elites. At a minimum, the character of Richardson's campaign perhaps signaled to candidates and party officials that new methods were needed to successfully court Latino support. Richardson called attention to the lack of understanding of Latino voters by traditional campaigns in a speech in Iowa in August 2007:
The Democratic leaders would ask me, well how are we going to appeal to Latinos—and you know they had the traditional way of doing things, they'd get rallies together, they'd get mariachis, the Mexican food, a little dancing, and that was it. That's not the way to appeal to Latinos, you've got to talk issues. You have to appeal to Latinos as mainstream Americans, and also as bilingual and bicultural Americans. (Richardson Reference Richardson2007a)
He was the first candidate to announce a specific plan targeting Latino voters, launching Mi Familia con Richardson in August of 2007. This mobilization strategy was introduced and implemented in Nevada, the first state contest with a sizable Latino electorate. Mi Familia was an innovative outreach program, targeting families rather than individuals. Families were encouraged to canvass, volunteer, and phone bank together, and to enlist other relatives and neighbors. It showed incredible insight into the Latino community by promoting a family-based message, while also reminding Latino voters that Richardson is part of la familia, that he is Latino. Yet, Richardson made clear in his Mi Familia announcement, as he did throughout his campaign, that he was more than just the Latino candidate: “I'm running for president because I believe I can bring people together. I'm running for president for all Americans, but I'm proud of being Latino, I'm enormously proud of being Latino. And … y yo sé porqué los Latinos vamos a ganar está elección (and I know we will win this election because of Latinos). And I am looking forward to a very strong Latino turnout in some of the early states—Nevada” (Richardson Reference Richardson2007b).
The fact that Richardson had many more Latinos on his team than any other candidate also shaped his overall campaign. For example, the Richardson campaign hosted Latino-targeted fundraisers, something most candidates ignore, writing off Latinos as too low income to financially support a campaign. Although Richardson lagged far behind Clinton and Obama in total dollars raised during 2007, as a share of his total funds raised, he received more money from Latinos than any other candidate (Castro Reference Castro2007; Scherer Reference Scherer2007). He always delivered bilingual speeches to Latino audiences and simply talked about the issues, instead of having a prop such as a mariachi on stage (Barack Obama in San Antonio and Hillary Clinton in El Paso), or giving a speech at a taco stand (Hillary Clinton in Los Angeles). While other candidates had portions of their regular campaign web site “en español,” Richardson was the only candidate to have a full parallel of his English site available in Spanish, with its own Spanish-language address, http://www.richardsonparapresidente.com. Finally, Richardson promoted policy positions consistent with Latino policy preferences (Latino Decisions 2007a; 2007b). His strident opposition to the Iraq War and calls for an immediate troop withdrawal were shared by a majority of Latino voters. He also favored changes to national education policy that included expanded access for bilingual education. On immigration reform, he insisted that any reform effort include a pathway to citizenship for undocumented immigrants.
¿Adiós Richardson?
Richardson campaigned non-stop for seven months and gained some ground in terms of name recognition and support, but he was never able to overcome his challenges. After finishing in fourth place in both New Hampshire and Iowa and, with essentially no money left in his chest, Richardson withdrew his candidacy on January 9, 2008. Before any of the major Latino states voted, Richardson was no longer a candidate. He remained neutralFootnote 1 through the most important Latino battleground contests, most notably on Super Tuesday, February 5, (Arizona, California, New Mexico, and Colorado) and later in Texas on March 4. On March 21, Richardson broke his neutrality and endorsed Obama.
The decision to support Obama is important for several reasons: his endorsement provided a nonbinding signal to delegates originally pledged to him where to redirect their votes; as a Democratic Party superdelegate, he had a high-profile role in the tight race for superdelegate votes, and may have brought other superdelegates to Obama's side. Finally, his support on the campaign trail may have served as a counterweight for Obama to Clinton's widespread popularity among Latino voters. If Richardson gains a high-level cabinet position in an Obama administration (such as secretary of state), he may be able to increase his name recognition and favorability, and he may well consider a second run at the White House. Early in the primary season Bill Richardson's very presence in the race cued other candidates of the need to attend to the increasingly important Latino voter bloc in this election year.
The Latino Vote in the 2008 Democratic Primary
Explaining the Latino Primary Vote
High name recognition, strong support for a family member's presidential administration, and major endorsements from Latino leaders were all-important factors in untangling the Latino vote in the presidential primary election—of 1968. Interestingly, almost the same dynamics were at play in 2008 with Hillary Clinton and the Latino electorate as in 1968 with Robert F. Kennedy. In 1968 the Chicano community is credited with helping Bobby Kennedy win the California Democratic primary election. Overwhelmingly, Latinos in California voted for Kennedy, due to incredible fondness for his brother John F. Kennedy's presidency, the ringing endorsement of César Chávez, president of the United Farm Workers Union, and outreach to Chicano voters by the Kennedy campaign. It was not until 40 years later that Latinos would have such an opportunity to vote in large numbers and influence the Democratic presidential primary outcome, and despite four decades of change, many of the same influences can be credited with explaining the Latino primary vote in 2008.
Clinton carried the Latino vote in the primaries for three main reasons: (1) higher name recognition and support of Bill Clinton; (2) endorsements from major Latino officials; (3) vigorous outreach to, and mobilization of, Latino voters. In addition, socioeconomic status also contributed to Clinton's margin among Latinos, just as it did among non-Latinos. In the electorate overall, Clinton did best among lower-income and lesser-educated voters, two socioeconomic groups in which Latinos are overrepresented. However, Clinton did better among Latinos, holding education and income variables constant, than she did among any other group of voters in the electorate. Thus, socioeconomic status explains only a part of her Latino support, and our three points above account for a more substantial portion of her support. However, it is also clear to us that the Latino vote should be viewed as pro-Clinton, not anti-Obama. As the campaign progressed, Latino support for Obama increased.
En Fuego: The Latino Firewall
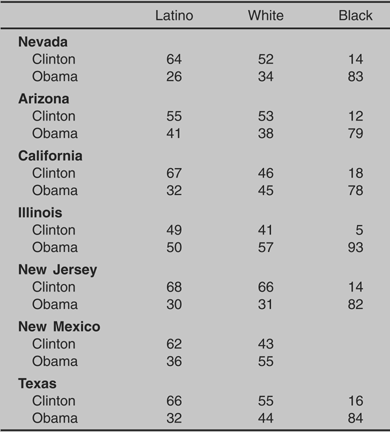
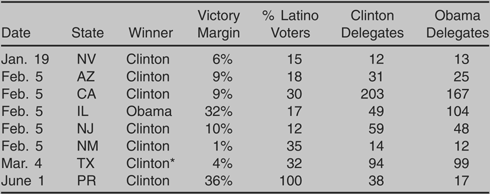
The centrality of Latinos as political actors in 2008 presidential primaries is perhaps best described in one word: firewall. This was the buzzword the Clinton campaign and media used to describe the expected decisive role Latino voters would have in securing statewide wins for her. Repeatedly the Clinton campaign projected that Latino voters would shift highly competitive states into her column. Latinos exercised their most impressive political muscle in several southwestern states where margins of victory were less than 10 points but Latino turnout and support for Clinton was substantial. Clinton carried Nevada, California, Arizona, and New Mexico as well as the popular vote in the Texas “two-step” primary. Obama emerged victorious in Colorado and won the caucus portion of the Texas election. National Election Pool (NEP) exit pollsFootnote 2 reported by CNN show that states with substantial Latino electorates voted for Clinton in higher proportions than any other racial or ethnic group (see Table 1). It is worth noting that Clinton's only caucus victory took place in Nevada, a state with a large Latino electorate. More importantly though, after New Hampshire the close finishes coincided with vulnerable points in the Clinton campaign, thus underscoring the importance of Latinos in keeping the race competitive and the Clinton candidacy viable in terms of both perception and momentum (see Table 2).
Candidate Choice by Race and Ethnicity

Source: 2008 NEP Exit Polls
Latino Vote in Selected States

* Clinton won popular vote; Obama won caucuses
Source: 2008 NEP Exit Polls
Clinton efficiently shored up her Latino “firewall” by maximizing her built-in advantages with targeted mobilization efforts. First, Clinton enjoyed incredible name recognition among Latino voters, due to her high profile from 1993–2008 as first lady and New York senator. For 15 years, Hillary Clinton has been a household name in the nation, and President Bill Clinton was incredibly popular among Latinos. In 1996 Bill Clinton was re-elected with 75% of the Latino vote, when he left office in 2000, over 80% of Latinos viewed him favorably. When the campaign for president began in 2007, Hillary Clinton was viewed favorably by 68% of Latino registered voters, and only 7% had no opinion of her. In contrast, Senator Barack Obama was viewed favorably by 48% of Latino voters, and 35% had no opinion of him (Latino Policy Coalition 2007). Even as late as January 2008, a Field Poll found that one out of four California Latinos stated “don't know” when asked for their opinion of Barack Obama—just three weeks before the February 5 election. With high approval and recognition of Hillary Clinton, and very little knowledge of Barack Obama, Latino voters tended to stay with the familiar choice.
Second, Clinton received a number of endorsements from well-known Latino elected officials and community leaders. As a result of racking up endorsements in 1992 and 1996 during Bill Clinton's presidential elections, many prominent Latinos were ready and waiting to endorse Hillary Clinton. Further, the Clintons had a much deeper network of Latino support due in part to the number of Latinos who were first elected to Congress during the 1990's or were appointed to the Clinton administration. The Latino elite support was especially evident in large states, with an extensive network of Latino elected officials such as California, Texas, New York, New Jersey, and Illinois. The Latino endorsements of Clinton were impressive not only in their total number, but in their scope. Clinton began accumulating Latino endorsements very early in the campaign, and by the time Obama began to seriously campaign for the Latino vote, almost all the consequential endorsements were locked up by Clinton.
Third, Clinton ran by far the most vigorous and successful Latino outreach campaign, and by comparison, Obama's Latino outreach was anemic. Even his own ally and chief Latino advisor, Congressman Luis Gutierrez of Chicago, lamented that Obama was not doing enough to get his message out to Latino voters. Until February 10 Clinton's top campaign manager was a Latina, Patti Solis Doyle. Under her direction the campaign greatly outspent the other candidates on Spanish-language advertising and hosted more Latino-targeted events than any other candidate. Clinton maintained a constant high profile in Latino majority communities by assigning celebrity status supporters, including Henry Cisneros, Antonio Villaraigosa, Eva Longoria, and America Ferrera, to share the stage at large public events. Over a two-week period there was a Clinton (be it Bill, Hillary, or Chelsea) in South Texas or El Paso every single day. As a result media markets with large Latino populations were saturated with local news coverage of her campaign in the days and weeks leading up to Super Tuesday and the Texas primary.
To some extent, the candidacy of Bill Richardson likely inspired the Clintons to campaign so heartily for Latino votes. Clinton was likely never worried about Obama, a relatively unknown junior senator, with Latino voters. However, she was quite likely worried about Richardson gaining momentum from Latino voters. As a result, Clinton began campaigning for Latino votes very early in the primary season, when she had a large funding advantage and a large lead in national polls. While Obama and Richardson had to concentrate on Iowa and New Hampshire or their candidacies were doomed, Clinton was available to target Latino voters in Los Angeles, Las Vegas, San Antonio, and of course New York City. Clinton's campaign strengths with the Latino community were Obama's weaknesses, and her campaign capitalized on those dynamics. Thus the firewall effect can be attributed to well-crafted mobilization efforts.
El Big Mo
At critical junctures in the primary season, Latino voters in specific states provided Clinton with needed momentum to keep her campaign competitive from a national vantage point (see Table 2). Officially the nomination hinges on the currency of pledged and super delegates, yet the importance of a win cannot be understated. Plainly, winning the popular vote creates, maintains, or changes momentum. Several additional measures of the horse race, including delegate counts, margins of victory, and, of course, racial and gender bloc voting provided additional drama to the 2008 Democratic primaries. Extensive post-election media coverage that frames the candidates as winners, contenders, or losers influences voters in upcoming races, undecided superdelegates, and campaign contributions (Mutz Reference Mutz1995; Damore Reference Damore1997). Whether via caucus, popular vote, or the infamous Texas combination format, a candidate's ability to declare victory is of the utmost importance in shaping momentum and ultimately the viability of the campaign (Bartels Reference Bartels1988; Norrander Reference Norrander1996). This was especially the case in 2008 with so many early primary states (Barreto, Collingwood, and Donovan Reference Barreto, Collingwood and Donovan2008).
The January Nevada caucuses marked the first time that a state with a large Latino population held an election so early on the calendar. Obama and Clinton arrived in Nevada with one high-profile win apiece (Iowa and New Hampshire respectively); expectations were that the caucus format and union support would favor Obama as it had in Iowa. Clinton's vulnerability had been exposed in Iowa and it was unclear whether Latino support would be substantial enough for her to win in this system. Though Obama won key union endorsements, Clinton targeted the rank and file Latino union members, sending them postcards, calling their homes, and visiting their union halls to ask for their votes. Ultimately Clinton emerged victorious in Nevada by a margin of 6%, establishing her strength with Latino voters. Latinos comprised an estimated 15% of the state's electorate, with 64% supporting Clinton. Most importantly though, the Nevada win fueled momentum in her favor and new buzz that Latinos would indeed be her go-to voting bloc in tight Super Tuesday races.
As Super Tuesday neared, Obama's surprising 28-point margin of victory in South Carolina had momentum squarely on his side, his national poll numbers were on the rise. The results of Super Tuesday yet again altered the momentum dynamics in the race. At the end of the day, Obama emerged the victor with wins in 13 states and a gain of 847 delegates compared to Clinton's 10 statewide wins and 834 delegates. However, Clinton's wins in blue and purple states with large Latino electorates hinted at her strength in states with plenty of electoral votes for those looking ahead. Latino voters were instrumental to her victories in Arizona, California, New Jersey, and New Mexico where 60% voted in her favor. Outcomes in these relatively close races illustrated that this constituency would be critical for her to secure the nomination. Nevertheless, the overall Super Tuesday split results halted any ideas that either candidate would have a quick claim to the nomination.
Obama-mania took the country by storm in February when he racked up 10 consecutive statewide wins over a three-week period. Momentum, especially in the form of positive press coverage and millions of dollars in online contributions, was again on Obama's side, forcing substantial pressure for Clinton to win either Texas or Ohio in the upcoming March 4 primaries. Though four states would hold elections on this date, (Texas, Ohio, Rhode Island, and Vermont), eyes were upon Texas, and Texas Latino voters in particular. The Clinton campaign repeatedly told Latino audiences a win in the state and the nomination hinged on their votes. Obama's winning streak ended March 4 when Clinton won Ohio and the Texas popular vote. Though Obama would later emerge with more Texas delegates via the caucus portion of the election, Clinton declared victory in two states where she ran an aggressive Latino campaign. Without high Latino turnout and a 2–1 vote favoring Clinton, Obama would have won the state of Texas outright, and perhaps the nomination on March 4. Once again, her campaign experienced a resurgence of momentum on multiple fronts: influx of endorsements, increased campaign contributions, media narratives of her ability to make a comeback, and evidence of solid support from the nation's largest minority group.
Interestingly, Latino Decisions polls in Nevada, California, and Texas show gender was not a strong predictor of vote choice for most Latinos.Footnote 3 The individual level data show women in Nevada and California slightly favored Clinton by five to seven points, while in Texas there was no difference at all. In all cases both Latinos and Latinas favored Clinton by at least a 3–1 margin. These single digit differences are marginal compared to the 20- to 30-point gender gap that persisted among white primary voters.
On June 1, the day after the Democratic Party Rules and Bylaws Committee decision on the Florida and Michigan delegate allocation made it virtually impossible for Clinton to win the nomination, Puerto Rico held its primary. Though Puerto Ricans cannot vote in the general election, Clinton campaigned aggressively here as she had in the rest of Latino America. Islanders supported Clinton at a rate of 2–1, and delivered an additional 38 delegates. At this final crucial moment in the process, Latino voters provided Clinton a last bit of momentum and evidence necessary to maintain a public relations campaign to the superdelegates. In her victory speech, Clinton acknowledged Puerto Rico and Latino voters saying, “Never before have these beautiful islands had such an important voice in a presidential election. Now we are winning the popular vote, there can be no doubt. I want to say a special word of thanks to the Hispanic community, not just in Puerto Rico, but across the United States. I am so honored you have stood by me throughout this campaign. I am grateful for your love, your friendship, and your support.” From January to June, Latino voters kept the Democratic primary contest competitive.
Looking Forward
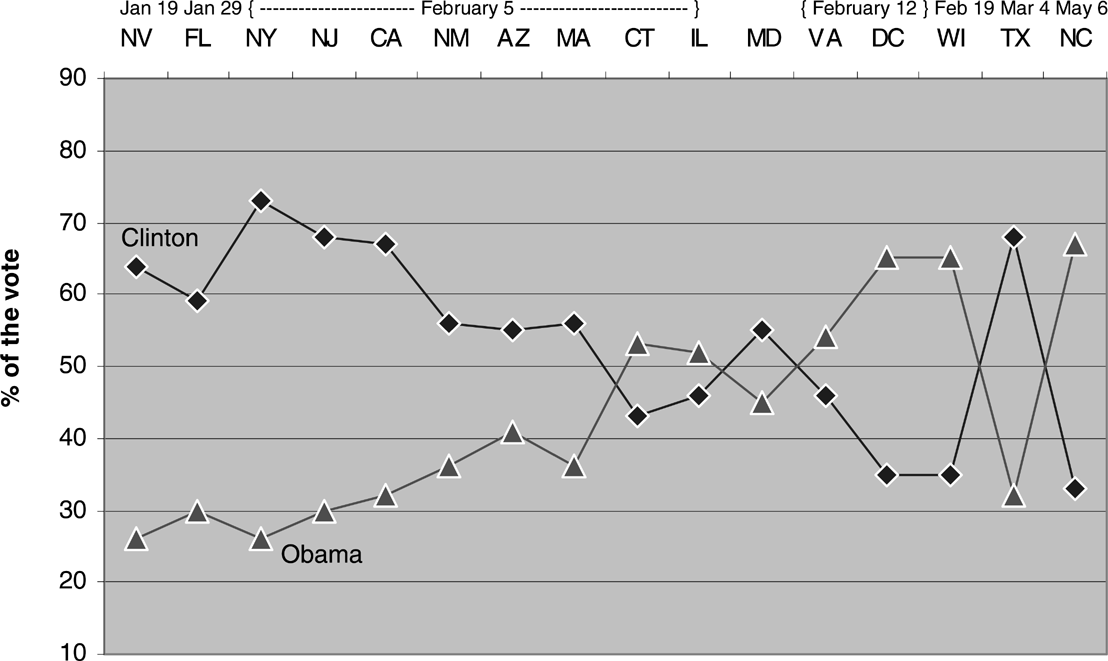
While we have described the Latino vote in 2008 as pro-Clinton, it would be a mistake to interpret it as anti-Obama. Despite repeated claims from Clinton consultants that Latinos will not vote for a Black candidate (e.g., Sergio Bendixen and Adelfa Callejo), this is most certainly not supported by empirical evidence. Indeed Obama himself has been very popular among Latino voters in Illinois during his tenure in the State Senate and U.S. Senate, and as Figure 1 demonstrates, he won a majority of the Latino vote in Illinois in the February 5 presidential primary. Outside of Illinois, Obama was relatively unknown to Latinos, however other African American candidates have fared well with Latino voters. In 1980 Tom Bradley won an estimated 80% of the Latino vote when he ran for governor of California. Further, prominent Black mayoral candidates have been successful in winning 70–80% of the Latino vote including David Dinkins (New York, 1990), Wellington Webb (Denver, 1984), Ron Kirk (Dallas, 1996), and Harold Washington (Chicago, 1984). In a special election in 2007 for the Thirty-seventh House District in California, African American candidate Laura Richardson won more than 70% of the Latino vote, even though she had received less than 20% of the Latino vote during a contentious primary.
Estimated Latino Vote in the 2008 Democratic Primary
Source: National Election Pool (NEP) exit polls for states that provide Latino crosstab data. For other states, candidate percentages are authors' estimates based on ecological inference using precinct level results and Latino voting age population.

Reflecting on the 2008 primaries, Figure 1 suggests that Obama increased his vote share among Latinos as the campaign season lengthened and Latino voters got to know him, with one exception, Texas. However, even in Texas, a Texas A&M University poll found that 71% of Latino Democrats had a favorable view of Obama. From a low point of only 26% in Nevada in January, Obama was able to increase his Latino vote share to over 60% in Washington, D.C., and later states such as Wisconsin and North Carolina. Indeed, a new national survey of Latino voters suggests that Obama is greatly preferred over McCain (Latino Decisions 2008). A June 2008 poll by Latino Decisions found that 60% of Latinos planned to vote for Obama, compared to just 23% for McCain, while 16% were undecided, a similar trend from the 2006 midterms when Latinos voted 69% Democrat and 30% Republican (Leal et al. Reference Leal, Nuño, Lee and de la Garza2008).
Latinos in the General Election
The peculiar closeness of the last several presidential elections—yes, including Bill Clinton's plurality wins in '92 and '96—have refocused presidential election analysis on a handful of swing or hotly contested states. Among the other coincidences of political circumstance that have raised the importance and profile of the Latino electorate is their disproportionate presence in several of these swing or closely divided states. While Latino voters are not a significant share of the Iowa, New Hampshire, or Ohio electorates, Florida and New Mexico are a different issue. New Mexico is the one state where Latinos will be a demographic majority and that switched columns between the last two elections, casting electoral votes for Al Gore in 2000 and George W. Bush in 2004, by extremely slim margins. Florida, of course, has a large and growing Latino electorate and attracted considerable attention in 2000 by putting George W. Bush into the White House, but cast its electoral votes for Bill Clinton in his two presidential elections.
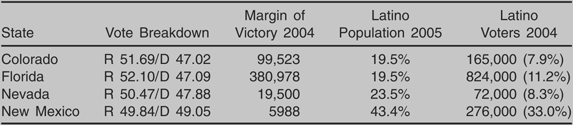
Besides New Mexico and Florida, considerable attention has been devoted recently to the intermountain west (Schaller Reference Schaller2006) as a potential growth area for Democrats. Democratic electoral success and changing populations—in part, including substantial Latino population growth—have made these once strongly Republican states more competitive. Latino populations in Florida and the Southwest, then, provide an opportunity for Hispanic voters to affect the national election to a degree they never have in the past. Table 3 illustrates the margin of victory in these states in the 2004 election and recent estimates of the share of the population and electorate that is Latino. We next examine each of these six states and weigh the prospect of Latino votes shifting their electoral votes to the Democratic column.
Latino Electorate and Closely Contested States

Latino Voter Source: Current Population Survey, Bureau of the Census
What's New in Colorado?
Are there signs in Colorado to suggest that its presidential preference might switch in this upcoming election? There are plenty. In 2004, Democrat and Latino Ken Salazar captured a formerly GOP-held Senate seat while his brother captured a seat in the House of Representatives, also previously held by the GOP. In the watershed 2006 midterm elections, Democrat Ed Perlmutter handily won the Seventh Congressional District seat 55–42%. This seat was also formerly held by the GOP and Perlmutter's success gave the Democrats a 4–3 majority in the state's House delegation. More recently, Democratic governor Bill Ritter won the governor's office in 2006 by a margin of 56–41%. Democrats now control both chambers of the state legislature.
More importantly, registration records all show signs of change. In the wake of the 2006 Congressional elections, the Denver Post (Aguilera Reference Aguilera2006) reported that, “The number of Colorado Latinos who registered to vote has increased 3.5% since the beginning of 2005—more than triple the rate of increase in non-Latino voters. The majority of those new Latino voters—at least 5,400—registered since July 1, when voter registration drives began seeking new Latino voters after spring rallies for immigrant rights.” Though we cannot say for sure how many additional Latinos registered since 2006, the Latino population is now almost 20% of the state, over 10% of the electorate, and may well help Democrats close the modest gap from 2004.
Viva! New Mexico
Since New Mexico was one of three states to switch sides by the tiniest of margins in 2004, this is a state that would naturally attract considerable attention. Moreover, the state has in Bill Richardson a Latino Democratic governor, re-elected in 2006 with 69% of the vote, and who himself sought the presidency. Democrats control both chambers of the state legislature. Every major leader in the state, including the governor, speaker of the house, president pro-tem of the Senate, and both majority leaders, are all Hispanic with the lone exception an African American woman. If ever conditions existed for Democrats to retake a red state—let alone for Latinos to play a key role in this process—New Mexico is the place. It is worth noting that Republican senator Pete Domenici is retiring, opening a Senate seat in 2008. Democratic congressman Tom Udall leads both GOP candidates by double digits in recent polls and is heavily favored to prevail in November. Conditions in New Mexico, we believe, are well situated for the state to switch columns once again, and for Latinos to be pivotal in that process.
Nevada in Transition
At first glance, Nevada is not so easily identified as a place where Latino voters could change Democratic fortunes, with its long history of generally GOP-dominated politics, a Republican governor, and a GOP-controlled State Senate. But the margin in the Senate is one seat, and though the GOP also controls two of three House seats in the state, their margins in the 2006 election were razor thin. The Republican incumbent in the third district won by one percentage point, and the Republicans held on to an open seat in the second district with only 51% of the vote. By contrast, the Democratic incumbent in the First Congressional District got 65% of the vote. When totaling Congressional votes cast across all three districts in 2006, Democratic candidates actually outpolled Republicans by 27,524 votes, and the Democrats also control the lower chamber of the state legislature by a sizable 27–15 margin. Both of these suggest that voters may well realign.
Latino population growth in Nevada has been remarkable and, as is usually the case, voter registration, though lagging, has grown significantly as well. Just last summer, the Las Vegas Review Journal (Ball Reference Ball2007) reported that, “Hispanic voter registration appears to be increasing rapidly in southern Nevada. According to the Clark County election department, as of November's election, there were 69,993 active registered voters with Hispanic last names. As of Thursday [August 2, 2007], there were 75,874, an increase of almost 6,000 in just nine months.”
A Changing Florida
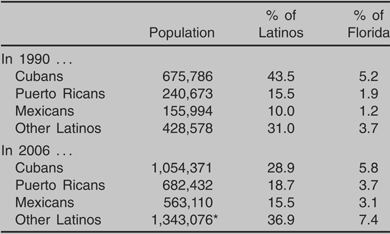
The importance of Latino voters in Florida has long since been established, as has the relative uniqueness of this Latino population, as primarily Cuban and Republican. However, Florida's Latino population is growing considerably—for example, there was a 70.4% increase between the 1990 census and 2000 census, and Latinos are now more than 20% of the state population. The change of importance, however, is that both the national origin composition and the political allegiance of the Florida Latino population appear to be evolving. Table 4 reports the distribution of Florida's Latino population by national origin. As is readily apparent, Cuban numerical dominance is a memory. And in May of this year, new figures on partisan registration suggest that Democratic registration among Latinos now slightly exceeds Republican registration, having grown by 18% in the last two years, compared to just a 2% growth in Latino Republicans (Reinhard Reference Reinhard2008), a remarkable change and challenge to established voting patterns and political coalitions.
Latino Population Characteristics in Florida

* Other Latinos include Dominicans, Central, and South Americans
Source: U.S. Census 1990 and American Community Survey
The McCain Factor
The nomination of John McCain as the Republican presidential candidate further highlights the emphasis that both Democrats and Republicans give to Latino voters. Because McCain already has some credibility and track record with Latinos, this presents opportunities for the McCain campaign and new challenges for the Obama campaign. The best case scenario for McCain is apparent: position himself as George W. Bush did in 2000 as the candidate who understands and respects Latinos to secure significant support from them, and use this credibility with Latinos as one of the ways to establish his further viability with sufficient numbers of moderate white Republican and independent voters in competitive states (Fraga and Leal Reference Fraga and Leal2004).
McCain has done well among Latino voters in his home state of Arizona. When he was last re-elected to the Senate in 2004 it was estimated that he received as much as two-thirds of the Latino vote. Latino voters who know McCain best have given him substantial support.
Perhaps even more importantly, McCain has been at the forefront of promoting comprehensive immigration reform for at least a decade. This is a position that clearly distinguished him from his Republican nomination opponents. It also distinguishes him from the values driving HR 4437, the Border Protection, Antiterrorism, and Illegal Immigration Control Act of 2005 passed by the House in 2005 behind the leadership of Representative James Sensenbrenner (R-WI). HR 4437 made being unauthorized in the U.S., or providing aid to an unauthorized immigrant, a federal felony. McCain worked closely with Senator Ted Kennedy (D-MA) in 2006 on S 2611, the Comprehensive Immigration Reform Act of 2006. This bill was ultimately introduced by then chairman of the Senate Judiciary Committee Arlen Specter (R-PA) with McCain as one of the co-sponsors. It did provide for border enforcement, but most importantly provided a path to legalization and citizenship for unauthorized immigrants who had been in the U.S. for at least five years, among other conditions. Although the House and Senate could not agree on a compromise between HR 4437 and S 2611, it did once again position McCain as one of the few Republican leaders in favor of comprehensive immigration reform, a position fully consistent with the overwhelming preferences of Latinos and Latino voters (Latino National Survey 2007).
The McCain campaign has clearly worked to establish itself as supportive of Latinos. On Cinco de Mayo the McCain campaign issued a statement paying tribute to the military victory of “a small group of Mexican troops who overcame overwhelming force to win the Battle of Puebla … and celebrat[ing] the many contributions Mexican-Americans have made to our society, culture, security and economy” (McCain Reference McCain2008). He also used this date to announce his Spanish-language web site, Estamos Unidos con McCain (We are united with John McCain), which was noted by several news sources (Union Tribune 2008; Navarrette Reference Navarrette2008; Reuters 2008).
Interestingly, however, nowhere on the McCain English-language campaign home page is there immediate access to the Spanish-language web site. Moreover, the “Issues” tab on the English-language web site does not include immigration. What is listed is “Border Security” as issue number 6 of 11.Footnote 4 When accessed, this tab is entitled “Border Security & Immigration Reform.”Footnote 5 Nowhere is there any mention of policies to address the unauthorized population currently living in the United States. For example, it makes no mention of legalization or a path to citizenship for the unauthorized.
This obfuscation well reflects the primary challenge that McCain faces in appealing to Latino voters on immigration. He must appeal to them with a degree of openness that harkens back to the Bush 2000 campaign, but not so much that he will risk alienating that core subset of Republican voters who might see such appeals as contrary to their desire for an exclusive focus on border security and related deportation. In 2000, Bush was able to integrate his appeal to Latinos as part of his campaign as a compassionate conservative that largely focused on the “symbolic mainstreaming” of Latinos (Fraga and Leal Reference Fraga and Leal2004). There is evidence that McCain may choose elements of this same path in 2008.
The only risk that McCain takes in making explicit appeals to Latino voters is that a core Republican constituency will not turn out on Election Day. There is no reason to expect that they will support Obama, however. If one assumes that these core Republican voters will “hold their noses” as they vote for McCain, it allows him to focus on securing a sufficient number of Latino votes to make him more competitive in states like New Mexico, Nevada, and Colorado where Latino voters can be critical to margins of victory. He can also reclaim a position as a Republican centrist, an appeal that is essential to his being able to secure enough swing white independent votes in states such as Missouri and Ohio that will be critical to his victory. It is this “ricochet effect” that served the Bush campaign extremely well in 2000 (Fraga and Leal Reference Fraga and Leal2004).
With Whom Will Latinos Dance in 2008?
It is an old Texas saying that the smart move is to “dance with the one who brung ya.” In Latino politics, this would suggest that the high levels of support for the better-known Hillary Clinton should not have been a surprise, especially after Richardson withdrew. Moreover, traditional Latino support favoring the Democrats, as occurred in 2006, should again be apparent in 2008 across the entire country, with the continuing exception of Florida. However, the growth in the Latino electorate in strategically important states places Latino voters in more advantaged positions to influence the outcome of this election than ever before, whether they choose to “dance with the one who brung 'em” or they “dance with the one who courts 'em.”
The role that Latinos played in Nevada, New Mexico, California, Texas, and Puerto Rico were critical to keeping the Clinton primary campaign viable. Both the Obama and McCain campaigns took note and each has pursued this segment of the electorate with creativity and vigor. It is likely to be the case that Latino voters, as either Democrats or Republicans, will be critical to both candidates in states like Colorado, Florida, Nevada, and New Mexico. For Obama, majority support from Latino voters in these states, in combination with other Democratic voters, is essential for him having any chance of winning the presidential election. For McCain, sizeable Latino support in these states, even at only 35–40%, can be critical in combination with other Republican voters for his margins of victory. Latinos may contribute to his credibility with moderate independent voters as well.
What is most apparent is that the presidential dance of today is not complete without full attention being paid to Latinos. To be president of the United States, whether you are a Democrat or a Republican, you had better learn to dance to the rhythms of salsa, rancheras, cumbias, tangos … or ballroom … or hip hop. Perhaps what is most important is that you be dancing with Latinos, for a considerable period of time, to music that they prefer.