1 Introduction
Pair plasmas consist of species with opposite charge but equal mass. This mass equality removes the separation of temporal and spatial plasma phenomena found in conventional electron–ion plasmas for the two species. Pair plasmas promise fundamental new plasma physics and have thus enjoyed great popularity since the 70s (Tsytovich & Wharton Reference Tsytovich and Wharton1978) especially in the theoretical and numerical domain. In 2012, concrete plans for the creation of a low-energy, low-density, magnetized electron-positron laboratory plasma in a stellarator were published (Pedersen et al. Reference Pedersen, Danielson, Hugenschmidt, Marx, Sarasola, Schauer, Schweikhard, Surko and Winkler2012). In the meantime, the magnetic dipole (Stoneking et al. Reference Stoneking2018) was identified as an equally convenient candidate for confining such plasmas, and efficient positron injection and confinement in the latter geometry demonstrated (Saitoh et al. Reference Saitoh, Stanja, Stenson, Hergenhahn, Niemann, Pedersen, Stoneking, Piochacz and Hugenschmidt2015; Hergenhahn et al. Reference Hergenhahn2018; Horn-Stanja et al. Reference Horn-Stanja2018; Stenson et al. Reference Stenson2018). With these recent advances from experiments, the theoretical interest in this particular state of matter has been renewed (Helander Reference Helander2014; Mishchenko, Plunk & Helander Reference Mishchenko, Plunk and Helander2018a ; Mishchenko et al. Reference Mishchenko, Zocco, Helander and Könies2018b ).
In general, micro-instabilities are present in non-uniform plasmas, tapping the free energy of temperature and density gradients. Due to the nonlinear interaction of these micro-instabilities turbulence forms and causes anomalous transport of heat and particles, with consequent degradation of the confinement time. Helander (Reference Helander2014) noted however that the slab branches of temperature gradient driven modes are stable in an equal-temperature pair plasma. A destabilization of these modes can be caused by introducing either a finite difference in the temperature of the two species (Barnes, Abiuso & Dorland Reference Barnes, Abiuso and Dorland2018), an ion contamination (Mishchenko et al.
Reference Mishchenko, Zocco, Helander and Könies2018b
) or a magnetic curvature (Helander Reference Helander2014). In the latter case, such unstable mode has actually been observed numerically by local gyrokinetic simulations of the cyclone base case with GS2 (Kotschenreuther, Rewoldt & Tang Reference Kotschenreuther, Rewoldt and Tang1995; Dorland et al.
Reference Dorland, Jenko, Kotschenreuther and Rogers2000) while varying the mass ratios from
 $1/1836$
to
 $1$
(Pedersen et al.
Reference Pedersen, Boozer, Dorland, Kremer and Schmitt2003). However, neither the linear spectrum nor the mode structure has been presented. The cyclone base case describes a toroidal ion-temperature-gradient (ITG) instability (Rudakov & Sagdeev Reference Rudakov and Sagdeev1962) for a collisionless electron–ion plasma in a tokamak geometry which is driven unstable by the curvature and gradient drift of the ions in the presence of a temperature gradient. ITGs are known to cause on the one hand turbulence and on the other hand a radial electric field leading to
 $\boldsymbol{E}\times \boldsymbol{B}$
poloidal flows (zonal flows; with electric field
 $\boldsymbol{E}$
and magnetic field
 $\boldsymbol{B}$
). Due to the curvature of the equilibrium toroidal magnetic field these flows start to oscillate and form geodesic acoustic modes (GAMs) (Winsor, Johnson & Dawson Reference Winsor, Johnson and Dawson1968; Zonca & Chen Reference Zonca and Chen2008). Although an extensive effort to verify and benchmark gyrokinetic codes on the physics of GAMs has been made for conventional deuterium–electron plasmas (see for example Biancalani et al.
Reference Biancalani2017), GAMs have never been studied in a pair plasma, to the best of our knowledge, and in general their effect on plasma turbulence and the zonal flows is an active field of research.
In this paper, a more detailed linear gyrokinetic study of pair plasmas will be given to extend the current understanding of basic properties of pair plasmas in magnetic geometries with finite shear and field lines covering the flux surfaces. In this work we have focused on the tokamak geometry, i.e. on a toroidal geometry with axisymmetry. With typical cyclone parameters the dominant instability is thus a toroidal ITG. Slab ITGs, which are driven unstable by the parallel ion dynamics, are subdominant in this case, but could be of relevance in other geometries, like, for example, stellarators. Note that only the stellarator (Pedersen et al.
Reference Pedersen, Danielson, Hugenschmidt, Marx, Sarasola, Schauer, Schweikhard, Surko and Winkler2012) and dipole geometries (Stoneking et al.
Reference Stoneking2018) are considered for a magnetized laboratory pair plasma. In the experiment, the thermal to magnetic pressure ratio
 $\unicode[STIX]{x1D6FD}$
should be tiny (as the target temperature is
 ${\sim}1~\text{eV}$
, and the density is
 ${\sim}10^{13}~\text{m}^{-3}$
), with the aim of getting a sustained steady state where annihilation is negligible (Pedersen et al.
Reference Pedersen, Danielson, Hugenschmidt, Marx, Sarasola, Schauer, Schweikhard, Surko and Winkler2012). With these parameters, the Debye length becomes relatively large (3 orders of magnitude larger than the gyroradius) and understanding its influence becomes crucial. The Debye shielding should be accessible in the tokamak, too – a geometry which is intensively studied in gyrokinetic simulations and provides a destabilization mechanism due to the magnetic curvature. A possible extension of the present work, which is left as a future step, is the inclusion of three-dimensional effects in the magnetic equilibrium, which are proper, for example, in stellarator geometries. For the simulations the global gyrokinetic particle-in-cell code ORB5 (Jolliet et al.
Reference Jolliet, Bottino, Angelino, Hatzky, Tran, McMillan, Sauter, Appert, Idomura and Villard2007; Bottino et al.
Reference Bottino, Vernay, Scott, Brunner, Hatzky, Jolliet, McMillan, Tran and Villard2011) has been used.
In order to enable pair plasma simulations with the ORB5 code, the underlying model (Tronko, Bottino & Sonnendrücker Reference Tronko, Bottino and Sonnendrücker2016) had to be modified to account for the Debye screening term relevant in pair plasmas. The details of the model are explained in § 2. The new model has been benchmarked against a standard electron–ion plasma scenario (Görler et al. Reference Görler, Tronko, Hornsby, Bottino, Kleiber, Norscini, Grandgirard, Jenko and Sonnendrücker2016) as well as the previous work on pair plasmas (Pedersen et al. Reference Pedersen, Boozer, Dorland, Kremer and Schmitt2003). The benchmark results are presented in § 3. The linear transition from a standard benchmark case in ORB5 towards a pair plasma is carried out in § 4. There we present the dependence on the mass ratio, the Debye length and the toroidal mode number and in addition give the mode structure for the strongest growing mode. Finally, we performed Rosenbluth–Hinton tests (Rosenbluth & Hinton Reference Rosenbluth and Hinton1998) for various mass ratios to get insight into GAMs in pair plasmas. These results are discussed in § 5. This work forms the basis for future turbulence studies in pair plasmas.
2 Model
We study drift micro-instabilities in pair plasmas confined in a tokamak geometry. These micro-instabilities are generated as drift waves due to the plasma non-uniformities, and in particular they become unstable due to the temperature gradients. The micro-instabilities we are interested in have characteristic frequencies much smaller than the gyro-frequency and small amplitudes. Therefore, the gyrokinetic ordering is satisfied and the gyrokinetic description (Brizard & Hahm Reference Brizard and Hahm2007) can be applied. The problems to be addressed numerically include effects of equal masses of the species on the drift instabilities and the role of the Debye length which is expected to be larger than the particle gyroradius in the pair plasma experiments (Pedersen et al. Reference Pedersen, Danielson, Hugenschmidt, Marx, Sarasola, Schauer, Schweikhard, Surko and Winkler2012). We employ the global gyrokinetic particle-in-cell code ORB5.
The gyrokinetic Poisson equation for the fluctuating electrostatic potential
 $\unicode[STIX]{x1D719}$
reads:
 $$\begin{eqnarray}-\unicode[STIX]{x1D716}_{0}\unicode[STIX]{x1D6FB}^{2}\unicode[STIX]{x1D719}-\unicode[STIX]{x1D735}\cdot \left(\mathop{\sum }_{s}\frac{q_{s}n_{0s}}{B\unicode[STIX]{x1D714}_{\text{c}s}}\unicode[STIX]{x1D735}_{\bot }\unicode[STIX]{x1D719}\right)=\mathop{\sum }_{s}q_{s}n_{s},\end{eqnarray}$$
with the index
 $s=e,i$
for the species,
 $q$
the charge,
 $\unicode[STIX]{x1D714}_{c}$
the gyrofrequency,
 $n_{0}$
the equilibrium density and
 $n$
the gyrocenter density fluctuations. Introducing the parameters
 $$\begin{eqnarray}\unicode[STIX]{x1D706}_{D}^{2}=\frac{\unicode[STIX]{x1D716}_{0}T_{\text{ref}}}{n_{\text{ref}}q_{\text{ref}}^{2}},\quad \hat{\unicode[STIX]{x1D706}}_{D}^{2}=\unicode[STIX]{x1D706}_{D}^{2}/r_{\text{ref}}^{2}=\frac{\unicode[STIX]{x1D716}_{0}B_{\text{ref}}^{2}}{m_{\text{ref}}n_{\text{ref}}},\end{eqnarray}$$
with
 $\unicode[STIX]{x1D706}_{D}$
the Debye length and
 $\hat{\unicode[STIX]{x1D706}}_{D}$
the Debye length normalized to the reference normalization length (essentially a gyroradius),
 $r_{\text{ref}}$
, we can rewrite the Poisson equation in a normalized form
 $$\begin{eqnarray}-\hat{\unicode[STIX]{x1D706}}_{D}^{2}\hat{\unicode[STIX]{x1D6FB}}_{\bot }^{2}\hat{\unicode[STIX]{x1D719}}-\hat{\unicode[STIX]{x1D735}}\cdot \left(\mathop{\sum }_{s}\frac{\hat{m}_{s}\hat{n}_{0s}}{\hat{B}^{2}}\hat{\unicode[STIX]{x1D735}}_{\bot }\hat{\unicode[STIX]{x1D719}}\right)=\mathop{\sum }_{s}\hat{q}_{s}\hat{n}_{s}.\end{eqnarray}$$
The normalized quantities are defined here as follows:
 $$\begin{eqnarray}\displaystyle & \displaystyle \hat{\unicode[STIX]{x1D719}}=\frac{q_{\text{ref}}\unicode[STIX]{x1D719}}{T_{\text{ref}}},\quad \hat{\unicode[STIX]{x1D735}}_{\bot }=r_{\text{ref}}\unicode[STIX]{x1D735}_{\bot },\quad \hat{n}_{s}=n_{s}/n_{\text{ref}},\quad \hat{n}_{0s}=n_{0s}/n_{\text{ref}} & \displaystyle\end{eqnarray}$$
 $$\begin{eqnarray}\displaystyle & \displaystyle \hat{B}=\frac{B}{B_{\text{ref}}},\quad \hat{m}_{s}=\frac{m_{s}}{m_{\text{ref}}},\quad r_{\text{ref}}^{2}=\frac{m_{\text{ref}}T_{\text{ref}}}{q_{\text{ref}}^{2}B_{\text{ref}}^{2}}, & \displaystyle\end{eqnarray}$$
with the normalization constants
 $q_{\text{ref}}$
,
 $m_{\text{ref}}$
,
 $T_{\text{ref}}$
,
 $n_{\text{ref}}$
and
 $B_{\text{ref}}$
properly chosen. The distribution function is found from the drift- or gyrokinetic equation
 $$\begin{eqnarray}\frac{\unicode[STIX]{x2202}f_{1s}}{\unicode[STIX]{x2202}t}+{\dot{Z}}^{(0)}\frac{\unicode[STIX]{x2202}f_{1s}}{\unicode[STIX]{x2202}Z}=-{\dot{Z}}^{(1)}\frac{\unicode[STIX]{x2202}F_{0s}}{\unicode[STIX]{x2202}Z},\end{eqnarray}$$
with
 $Z$
being the gyrocenter phase-space coordinates and
 ${\dot{Z}}$
the gyrocenter orbits (Brizard & Hahm Reference Brizard and Hahm2007). We distinguish between the perturbed
 $Z^{(1)}$
and unperturbed
 $Z^{(0)}$
orbits. The gyrokinetic distribution function is also split into the perturbed
 $f_{1s}$
and unperturbed
 $F_{0s}$
parts with
 $F_{0s}$
being a Maxwellian.
Note that the usual gyrokinetic model of ORB5 (Tronko et al. Reference Tronko, Bottino and Sonnendrücker2016) assumes the Debye length to be much smaller than the ion gyroradius and thus neglects the first term in (2.3). In this work, this assumption has been removed in order to enable pair plasma simulations. As a result, an additional term, proportional to the Debye length, appears in the polarization (Poisson) equation of the model. In addition to this, the electron polarization density, usually neglected in standard ORB5 simulations, has been included into the equations and in the finite element based field solver module of the code. Relativistic corrections are neglected here.
3 Benchmark studies for the modified code
3.1 Cyclone base case in collisionless deuterium plasmas
Recently a benchmark case based on the well-established cyclone base case (Dimits et al.
Reference Dimits2000) has been proposed for global codes such as ORB5 (Görler et al.
Reference Görler, Tronko, Hornsby, Bottino, Kleiber, Norscini, Grandgirard, Jenko and Sonnendrücker2016). It describes a collisionless deuterium plasma in the magnetic field of a tokamak with circular concentric flux surfaces. In agreement with the reference, a mass ratio of
 $m_{e}/m_{i}=5.446\times 10^{-4}$
was used (i.e. with electrons twice as heavy as in reality) in order to reduce the computational effort. The minor and major radius of the tokamak are
 $a=0.612~\text{m}$
and
 $R_{0}=1.7~\text{m}$
. The reference magnetic surface is
 $\unicode[STIX]{x1D70C}_{0}=r_{0}/a=0.5$
. The guide magnetic field is
 $B_{0}=2~\text{T}$
. The safety factor is
 $q_{0}=1.41$
and the magnetic shear is
 ${\hat{s}}=0.84$
. The profile of the safety factor is chosen parabolic
 $$\begin{eqnarray}q(r)=0.86-0.16\frac{r}{a}+2.52\frac{r^{2}}{a^{2}}.\end{eqnarray}$$
Via
 $\unicode[STIX]{x1D70C}^{\ast }=r_{\text{ref}}/a=1/180$
the electron temperature (which is the reference temperature) is fixed to
 $T_{e}=2.14\,$
keV. The ion temperature is chosen equal to the electron temperature. The reference density is set to
 $n_{0}=4.66\times 10^{19}~\text{m}^{-3}$
. However, this density is normalized in the code and only enters via
 $\hat{\unicode[STIX]{x1D706}}_{D}$
. For both species, the temperature gradient is defined by
 $\unicode[STIX]{x1D705}_{\unicode[STIX]{x1D70F}}=a/L_{T}=2.508$
, and the density gradient by
 $\unicode[STIX]{x1D705}_{n}=a/L_{n}=0.8028$
. Those quantities enter in the driving terms of the evolution equation for the weights, i.e. on the right-hand side of the Vlasov equation (2.6) via the radial derivative of
 $F_{0}$
.
We chose this scenario to verify that ORB5 with the pair plasma implementation described in § 2 still gives the same result for conventional plasma runs. The linear spectrum of the electrostatic case was simulated and compared to the one provided in Görler et al. (Reference Görler, Tronko, Hornsby, Bottino, Kleiber, Norscini, Grandgirard, Jenko and Sonnendrücker2016). First, we used gyrokinetic ions and adiabatic electrons. The time step was chosen as
 $\unicode[STIX]{x0394}t=20\unicode[STIX]{x1D6FA}^{-1}$
with
 $\unicode[STIX]{x1D6FA}$
the cyclotron frequency of the ion species. The number of markers was
 $1\times 10^{7}$
for
 $n\leqslant 20$
or
 $1\times 10^{8}$
for
 $n>20$
with
 $n\in [5,40]$
the toroidal mode number. The grid size is
 $(N_{s},N_{\unicode[STIX]{x1D712}},N_{\unicode[STIX]{x1D719}})=(128,128,128)$
(for radial, poloidal and toroidal direction, respectively) for smaller and
 $(128,256,128)$
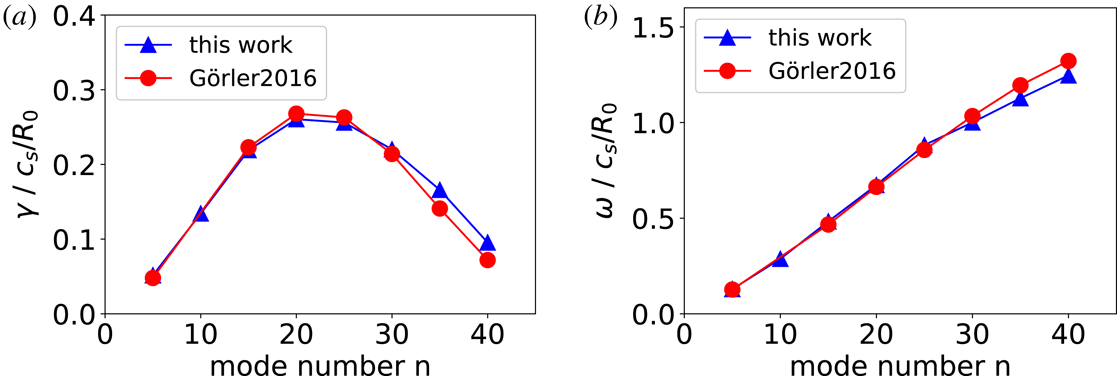
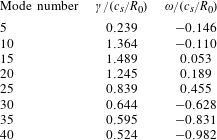
for higher toroidal mode numbers, respectively. The results for the growth rate and frequency in dependence on the toroidal mode number are in good agreement with the values provided in Görler et al. (Reference Görler, Tronko, Hornsby, Bottino, Kleiber, Norscini, Grandgirard, Jenko and Sonnendrücker2016) and are shown in figure 1. Second, we switched to fully kinetic electrons. With a time step of
 $\unicode[STIX]{x0394}t=0.4\unicode[STIX]{x1D6FA}^{-1}$
and
 $n\in [15,30]$
, we again found good agreement with Görler et al. (Reference Görler, Tronko, Hornsby, Bottino, Kleiber, Norscini, Grandgirard, Jenko and Sonnendrücker2016).
(a) Growth rate normalized to
 $c_{s}/R_{0}=\sqrt{eT_{e}/m_{i}}\sim 190~\text{kHz}$
for toroidal modes with
 $n\in [5,40]$
in the new code (blue triangles) for the test case described in the main text. (b) Corresponding frequencies (blue triangles) in the same normalization. The respective quantities from Görler et al. (Reference Görler, Tronko, Hornsby, Bottino, Kleiber, Norscini, Grandgirard, Jenko and Sonnendrücker2016) are also shown by red circles for comparison.

3.2 Comparison to pair plasma results with GS2
The aim of this section is to benchmark our pair plasma calculations with ORB5 against previous results for pair plasmas with other codes. In 2003, some results on linear gyrokinetic simulations for pair plasmas with the local code GS2 (Kotschenreuther et al.
Reference Kotschenreuther, Rewoldt and Tang1995; Dorland et al.
Reference Dorland, Jenko, Kotschenreuther and Rogers2000), including the mass and density dependence, were published (Pedersen et al.
Reference Pedersen, Boozer, Dorland, Kremer and Schmitt2003). Following the reference, we used: the reference magnetic surface at
 $\unicode[STIX]{x1D70C}_{0}=r_{0}/a=0.5$
, safety factor
 $q_{0}=1.4$
, magnetic shear
 ${\hat{s}}=0.8$
, magnetic field
 $B_{0}=1~\text{T}$
and gradient lengths
 $a/L_{n}=a/L_{T}=1.08$
. We assumed electrostatic runs with fully kinetic electrons with a reference temperature of
 $T_{e}=T_{i}=2.14~\text{keV}$
. We choose a density of
 $n_{0}=4.66\times 10^{19}~\text{m}^{-3}$
which gives a Debye length smaller than the reference gyroradius and thus Debye screening is unimportant. These parameters result in
 $\unicode[STIX]{x1D70C}^{\ast }=1/130$
. We aimed for the reproduction of one point of figure 4 from the reference and choose
 $m_{e}/m_{i}=0.1$
. The ion mass is now equal to the proton mass. We use the toroidal mode
 $n=20$
as this was so far our strongest growing mode. The time step is
 $\unicode[STIX]{x0394}t=0.2\unicode[STIX]{x1D6FA}^{-1}$
, the marker number is
 $N=10^{7}$
and the poloidal resolution
 $N_{\unicode[STIX]{x1D712}}=128$
.
Our calculations result in
 $\unicode[STIX]{x1D6FE}=0.00127\unicode[STIX]{x1D6FA}$
and
 $\unicode[STIX]{x1D714}=0.0021\unicode[STIX]{x1D6FA}$
. We need to convert these into the units used in the reference
 $$\begin{eqnarray}\unicode[STIX]{x1D6FA}=\left(\unicode[STIX]{x1D6FA}\frac{R}{v_{ti}}\right)\frac{v_{ti}}{R}=\left(\frac{R}{\unicode[STIX]{x1D70C}_{S}}\right)\frac{v_{ti}}{R}=\left(\frac{R}{a\unicode[STIX]{x1D70C}^{\ast }}\right)\frac{v_{ti}}{R}.\end{eqnarray}$$
With the parameters given above we have the conversion
 $\unicode[STIX]{x1D6FA}=361.11\,v_{ti}/R$
which leads to
 $\unicode[STIX]{x1D6FE}=0.459\,v_{ti}/R$
, in reasonable agreement with the maximized growth rate of
 $\unicode[STIX]{x1D6FE}_{GS2}=0.4\,v_{ti}/R$
for that mass ratio from the reference. For completeness, the frequency in this normalization is
 $\unicode[STIX]{x1D714}=0.758\,v_{ti}/R$
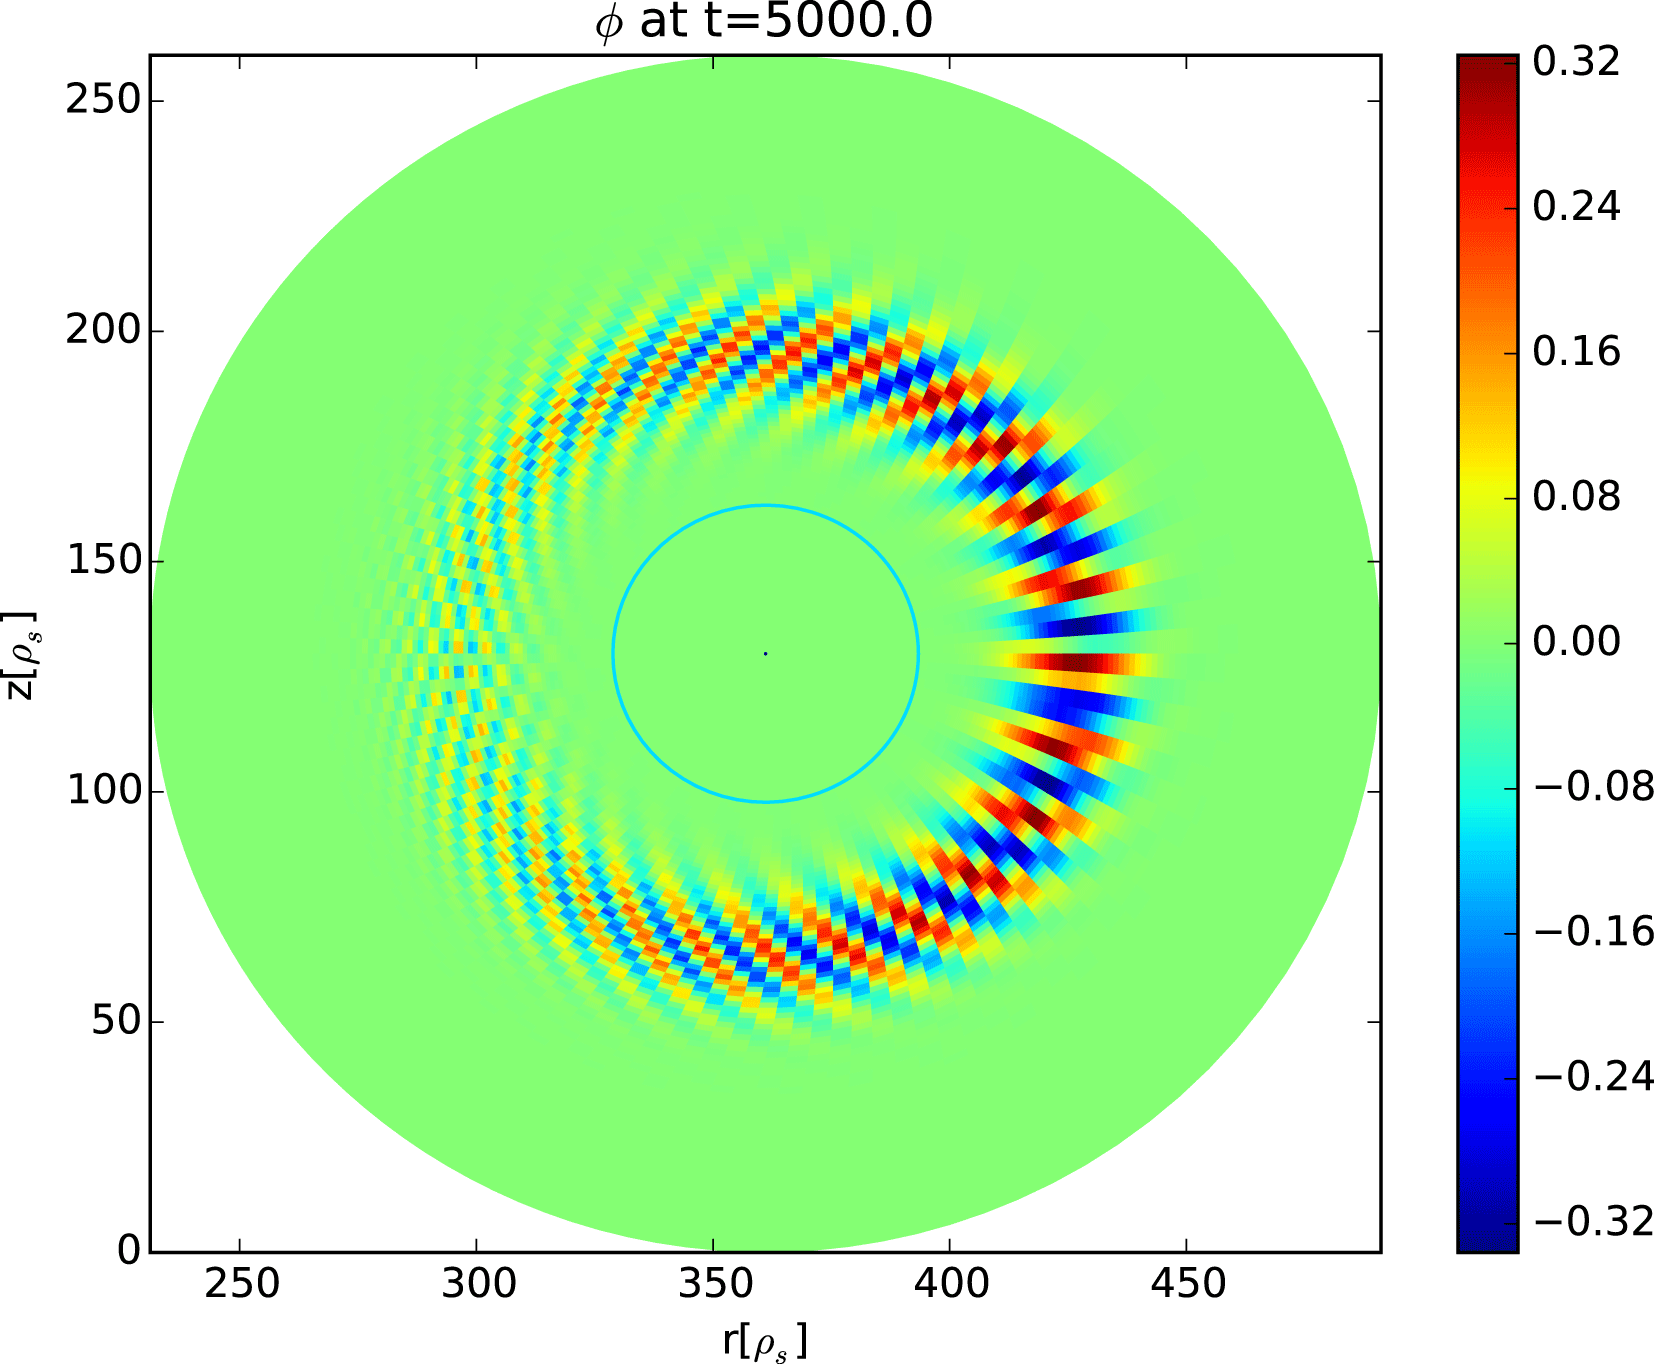
. The corresponding poloidal mode structure is shown in figure 2.
Poloidal mode structure of the
 $n=20$
mode for a plasma with
 $m_{e}/m_{i}=0.1$
at
 $t=5000\unicode[STIX]{x1D6FA}^{-1}$
. For more details see text.

Before proceeding further, it is worth discussing the value of the real part of the frequency measured with ORB5 in this simulation. The real part is not given in Pedersen et al. (Reference Pedersen, Boozer, Dorland, Kremer and Schmitt2003), and therefore no comparison can be shown here. Nevertheless, more general considerations can be done. In particular, note that the model equations, i.e. (2.3) and (2.6), have a well-defined symmetry (see also Helander & Connor Reference Helander and Connor2016; Barnes et al.
Reference Barnes, Abiuso and Dorland2018) with respect to the transformation exchanging the two species (and consequently the sign of the electric field), and the sign of time (and consequently of the velocity). This is due to the equal mass and opposite charges of the two species, and by the assumption of equal density and temperature profiles. As a consequence, by applying this transformation, what we will observe is still a possible solution of our model. Therefore, we can state that, if an oscillation with a frequency
 $z_{1}=\unicode[STIX]{x1D714}+\text{i}\unicode[STIX]{x1D6FE}$
exists, also the oscillation with opposite frequency, i.e.
 $z_{2}=-\unicode[STIX]{x1D714}-\text{i}\unicode[STIX]{x1D6FE}$
, should be visible. A more dedicated analytical resolution of the dispersion relation of temperature-gradient driven modes in pair plasmas is given in Kennedy et al. (Reference Kennedy, Mishchenko, Xanthopoulos and Helander2018), showing that, in the local limit, the real frequency of the temperature-gradient driven modes is null in pair plasmas. This is consistent with local (i.e. flux-tube) simulations of GENE (Jenko et al.
Reference Jenko, Dorland, Kotschenreuther and Rogers2000), shown in the same paper (Kennedy et al.
Reference Kennedy, Mishchenko, Xanthopoulos and Helander2018). Note that all simulations obtained with ORB5 are global, as no flux-tube version of ORB5 exists. Note also that ORB5 is an initial-value code. Therefore, if two modes with opposite frequency exist, the damped one will not be visible anymore after a sufficiently long time, and only one finite frequency will be observed. In summary, we conjecture that the finiteness of the measured frequency is due to global effects. This hypothesis is supported by repeating some of our simulations with the local and global versions of GENE, with the result that the local version gives zero frequency, and the global version gives a finite frequency consistent with ORB5. A more detailed study of the global effects in pair plasmas is outside the scope of this paper, and comprehensive numerical studies with ORB5 and GENE will be performed and discussed in a dedicated publication.
4 Cyclone base case for pair plasma
In a next step we study the transition towards a pair plasma. Main points of interest are the dependence of the growth rate and frequency on the mass ratio, the Debye length and the toroidal mode number. For simplicity, the equilibrium is fixed to the parameters of the benchmark case presented in § 3.1. The electrons are treated fully kinetically.
To realize this transition the mass ratio
 $m_{e}/m_{i}$
needs to be adjusted. Reducing the reference mass
 $m_{i}$
goes along with reducing
 $\unicode[STIX]{x1D70C}^{\ast }$
which is computationally too expensive. Instead we have chosen to increase
 $m_{e}$
and thus to investigate a heavy-mass pair plasma.
4.1 Mass scan for cyclone base case
To study the mass dependence, the mass of the electrons is increased from
 $5.446\times 10^{-4}\,m_{i}$
to
 $m_{i}$
(recall
 $m_{i}=2m_{p}$
with
 $m_{p}$
the proton mass).
The gyrokinetic theory should still hold for the following reason. It is known that in the benchmark case
 $\unicode[STIX]{x1D714}$
scales as
 $c_{s}/R\propto \sqrt{T/m_{i}}$
. Assuming this remains valid when changing the mass ratio and keeping
 $\unicode[STIX]{x1D70C}^{\ast }$
constant this is a
 $m_{e}/m_{i}$
scaling as for the cyclotron frequency. Thus, if the relation
 $\unicode[STIX]{x1D714}\ll \unicode[STIX]{x1D6FA}$
is valid for the normal mass ratio it is expected to remain valid for this study.
At initialization, the toroidal mode number
 $n=20$
was chosen since this was the strongest growing mode in the benchmark case with the conventional mass ratio. The time step was set to
 $\unicode[STIX]{x0394}t=0.2\unicode[STIX]{x1D6FA}^{-1}$
for mass ratios below or to
 $\unicode[STIX]{x0394}t=20\unicode[STIX]{x1D6FA}^{-1}$
for mass ratios above 0.03, respectively. For the first study the Debye length was fixed to
 $\hat{\unicode[STIX]{x1D706}}_{D}=0.01508$
and is thus smaller than the reference gyroradius.
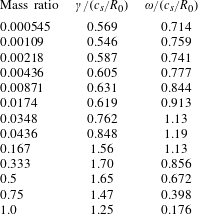
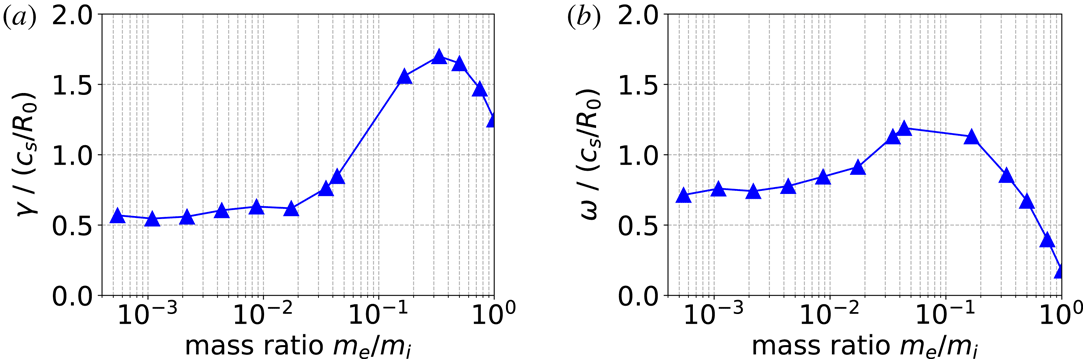
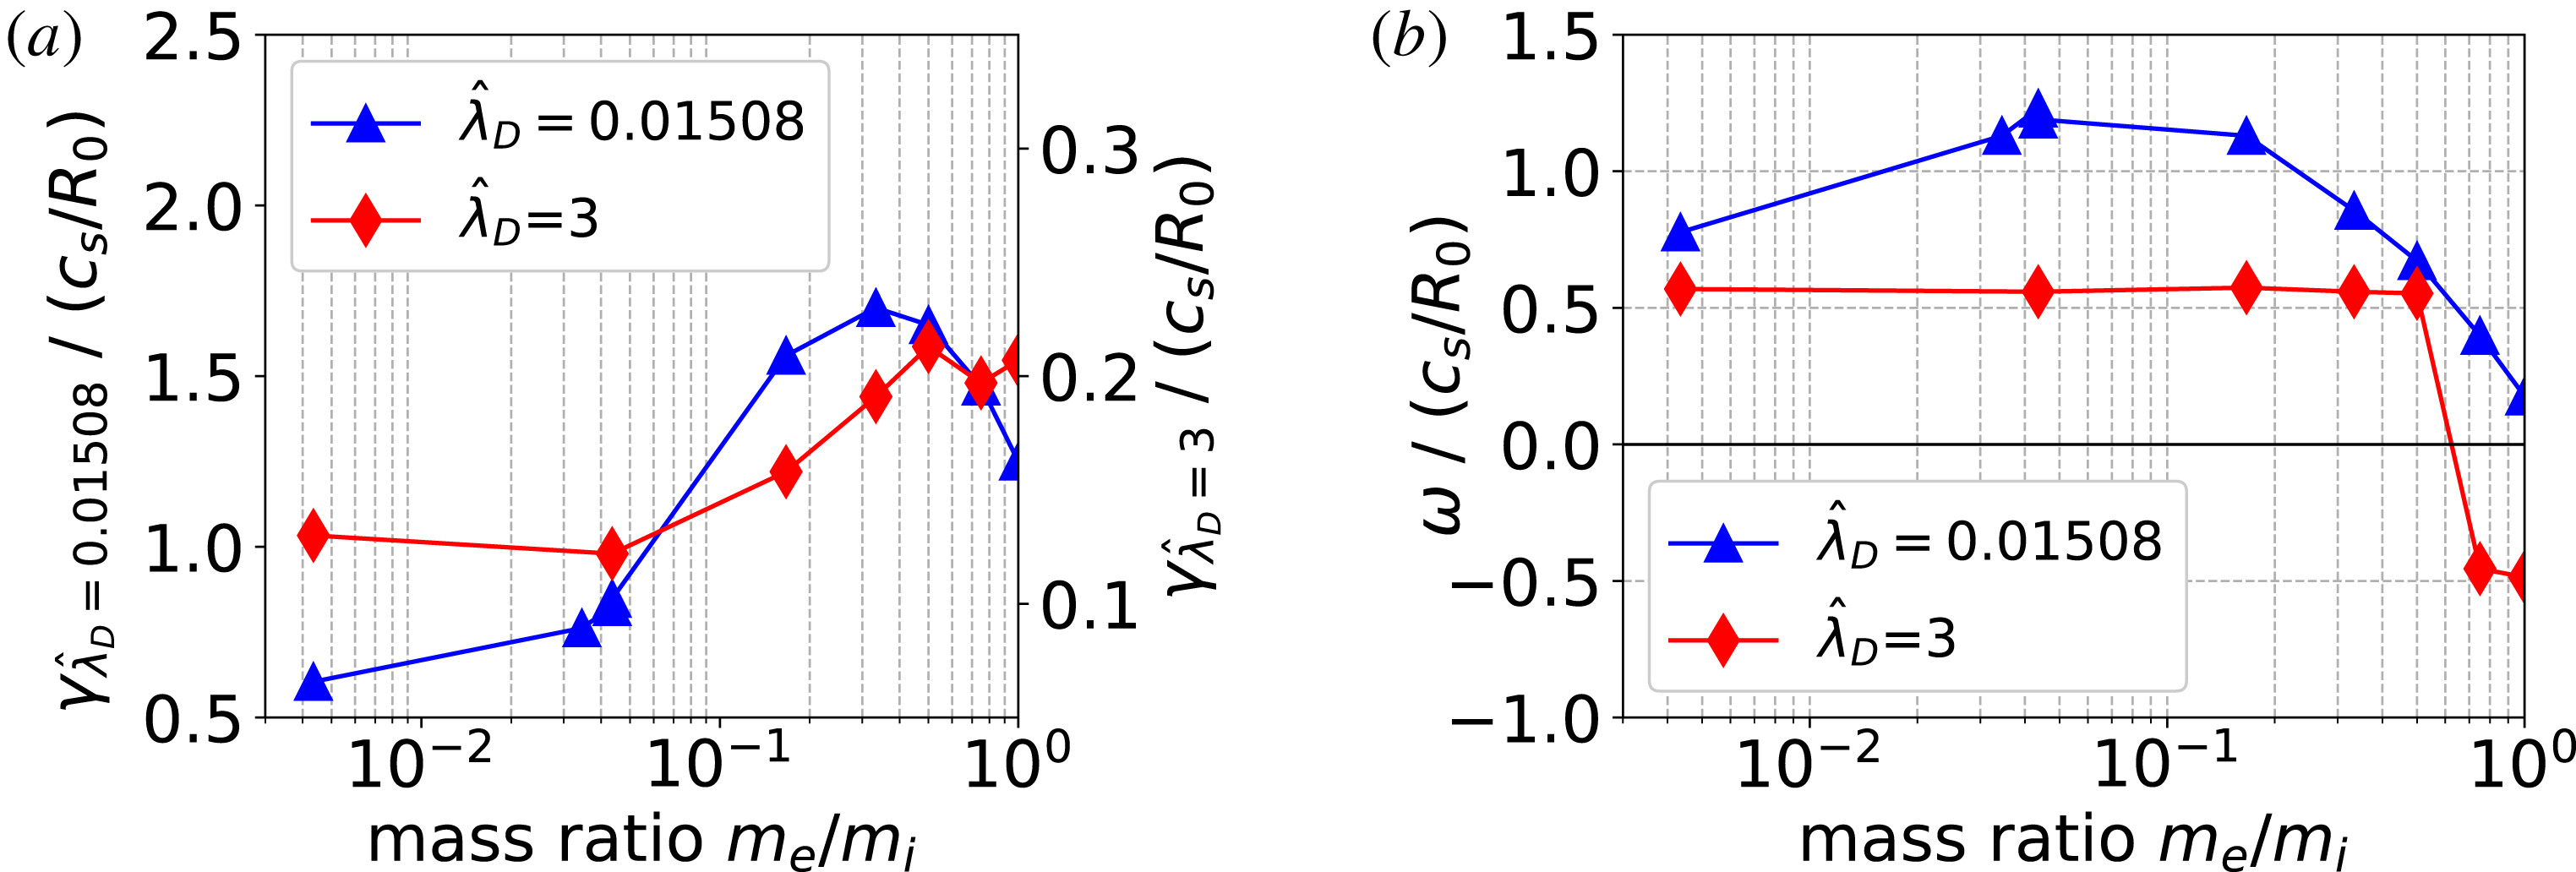
The numerical results of the mass scan are shown in table 1 and figure 3. For the growth rate, we find a qualitative agreement with the result presented in Pedersen et al. (Reference Pedersen, Boozer, Dorland, Kremer and Schmitt2003). For the frequencies, we use the sign convention that the positive frequencies correspond to the ion (positron) diamagnetic direction for the mode rotation (as in ITG instabilities). We observe that the mode rotation remains in the ion (positron) diamagnetic direction for all mass ratios, in the regime of ion (positron) temperature gradient exceeding the density gradient considered here. Note that, when the mass ratio tends to unity, the value of the frequency becomes small but remains finite in the simulations performed with ORB5, contrarily to simulations performed with the flux-tube version of GENE where the frequency goes to zero for
 $m_{i}/m_{e}\rightarrow 1$
(see Kennedy et al.
Reference Kennedy, Mishchenko, Xanthopoulos and Helander2018). As discussed in § 3.2, we consider this residual finite frequency in the mass scan as due to global effects.
Numerical results for the growth rate and frequency for different mass ratios with fully kinetic electrons and toroidal mode number
 $n=20$
. The results are normalized to
 $c_{s}/R_{0}$
. The Debye length is fixed to
 $\hat{\unicode[STIX]{x1D706}}_{D}=0.01508$
.

(a) Mass dependence of the growth rate, normalized to
 $c_{s}/R_{0}$
. (b) Corresponding frequencies in the same normalization. The Debye length is fixed to
 $\hat{\unicode[STIX]{x1D706}}_{D}=0.01508$
.

For mass ratios above 0.004, this scan was repeated for a Debye length exceeding the reference gyroradius, namely
 $\hat{\unicode[STIX]{x1D706}}_{D}=3$
corresponding to a density of
 $n_{0}\sim 1\times 10^{15}~\text{m}^{-3}$
. For this case, the Debye screening term becomes significant and reduced growth rates are observed. Furthermore, the frequency of the mode remains unaffected for a broad range of mass ratios unless it approaches unity where a sign flip is observed. Such flips in the sign of the frequency are known to exist in pair plasmas investigated kinetically (see, for example Kennedy et al.
Reference Kennedy, Mishchenko, Xanthopoulos and Helander2018), and explained as due to the dominance of one mode on the other in terms of growth rates (whereas the frequencies are very similar and the phase velocities are opposite). A comparison of the growth rates and frequencies for the two cases is shown in figure 4.
Comparison of the numerical results for two different
 $\hat{\unicode[STIX]{x1D706}}_{D}$
. (a) Mass dependence of the growth rate, normalized to
 $c_{s}/R_{0}$
(note the two scales). (b) Corresponding frequencies in the same normalization.

4.2 Debye length scan for pair plasma in cyclone base case
With
 $m_{e}=m_{i}$
, the Debye length was increased from
 $\hat{\unicode[STIX]{x1D706}}_{D}=0.0$
to
 $\hat{\unicode[STIX]{x1D706}}_{D}=5.0$
. Since in electrostatic runs
 $\hat{\unicode[STIX]{x1D706}}_{D}$
is the only parameter in ORB5 depending on the density, this effectively corresponds to a decrease in density. The number of markers was set to
 $N=4\times 10^{5}$
for the ‘ion species’ and to
 $N=4\times 10^{6}$
for the electrons, the time step was
 $\unicode[STIX]{x0394}t=10\unicode[STIX]{x1D6FA}^{-1}$
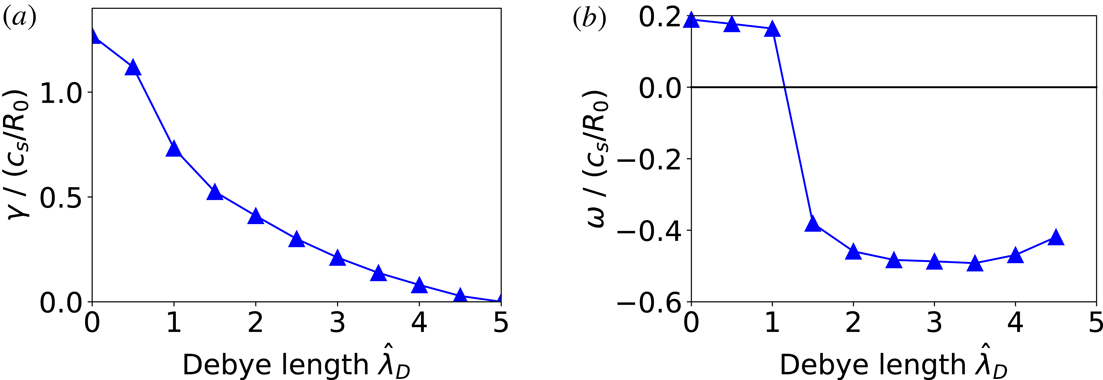
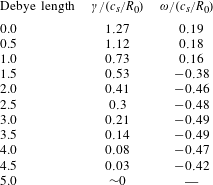
and all other parameters were chosen as before. The numerical results of the Debye length scan are shown in table 2 and figure 5. With a larger Debye length the unstable mode is weakened and eventually stabilized for
 $\hat{\unicode[STIX]{x1D706}}_{D}\gtrsim 4.5$
which again is in qualitative agreement with the result in Pedersen et al. (Reference Pedersen, Boozer, Dorland, Kremer and Schmitt2003). For the frequency, a sign flip is observed for
 $\hat{\unicode[STIX]{x1D706}}_{D}>1$
, i.e. as soon as the Debye length exceeds the reference gyroradius.
(a) Dependence of the growth rate, normalized to
 $c_{s}/R_{0}$
, on the Debye length. (b) Corresponding frequencies in the same normalization. The mass ratio is fixed to
 $m_{e}/m_{i}=1$
.

Numerical results for the growth rate and frequency for different Debye lengths with fully kinetic electrons and toroidal mode number
 $n=20$
. The results are normalized to
 $c_{s}/R_{0}$
. The mass ratio is fixed to
 $m_{e}/m_{i}=1$
.

4.3 Linear spectrum for pair plasma in cyclone base case
In the cyclone base case for an electron–ion plasma the maximum growth rate is observed for the
 $n=20$
mode. In order to investigate if this remains valid for a pair plasma with a mass ratio of 1 we initialized simulations with
 $n\in [5,40]$
and Debye lengths of
 $\hat{\unicode[STIX]{x1D706}}_{D}=\{0.01508,3\}$
, respectively. The poloidal resolution of the runs was adjusted in order to fulfil
 $N_{\unicode[STIX]{x1D712}}\geqslant nq_{\text{max}}\pm \unicode[STIX]{x0394}m$
with
 $q_{\text{max}}\sim 3$
and
 $\unicode[STIX]{x0394}m=5$
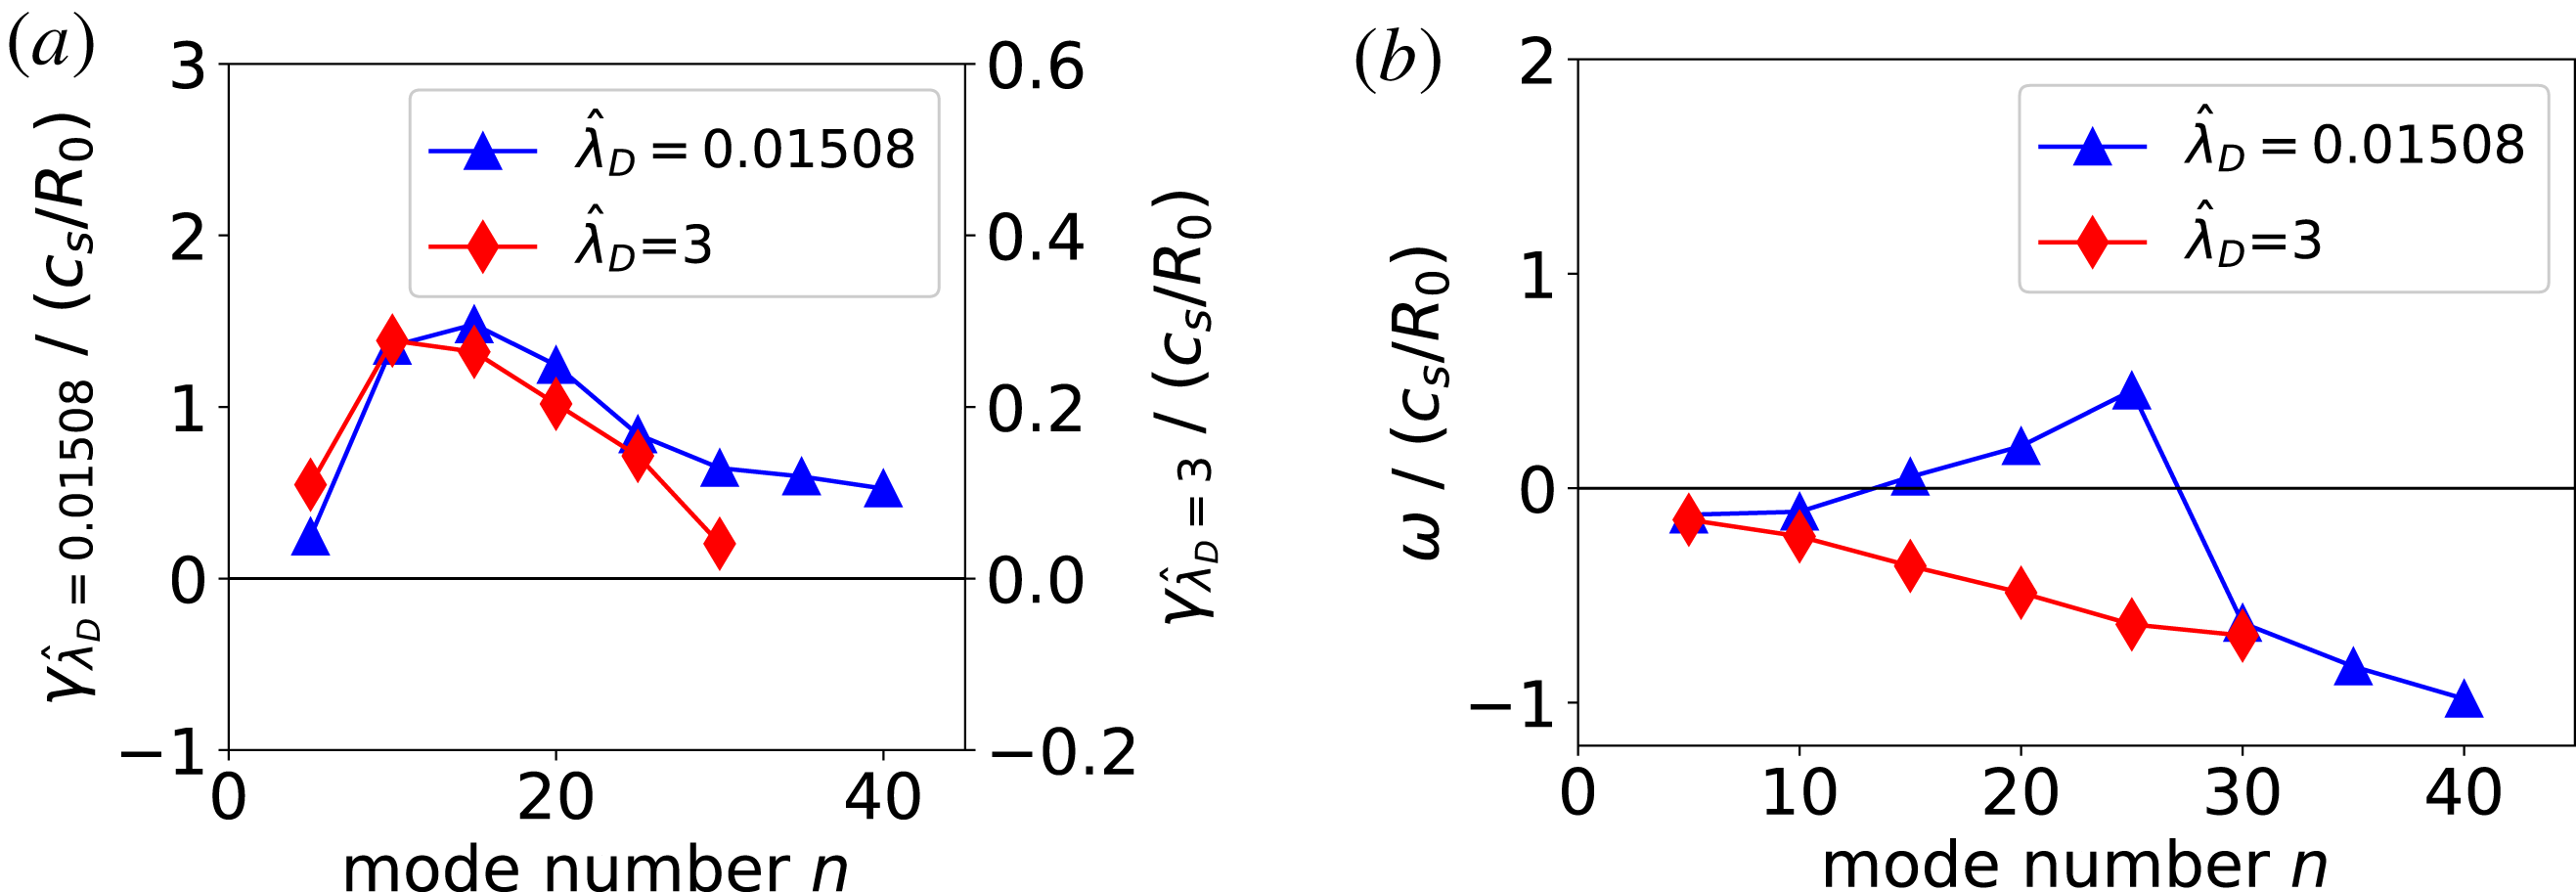
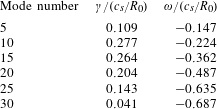
. The numerical results are summarized in tables 3, 4 and shown in figure 6.
Clearly the peak position of the growth-rate spectrum is shifted for a pair plasma with the exact peak position depending on the choice of the Debye length. For
 $\hat{\unicode[STIX]{x1D706}}_{D}=3$
, modes with
 $n>30$
are stabilized. While for
 $\hat{\unicode[STIX]{x1D706}}_{D}=0.01508$
two sign flips are observed for the frequency,
 $\hat{\unicode[STIX]{x1D706}}_{D}=3$
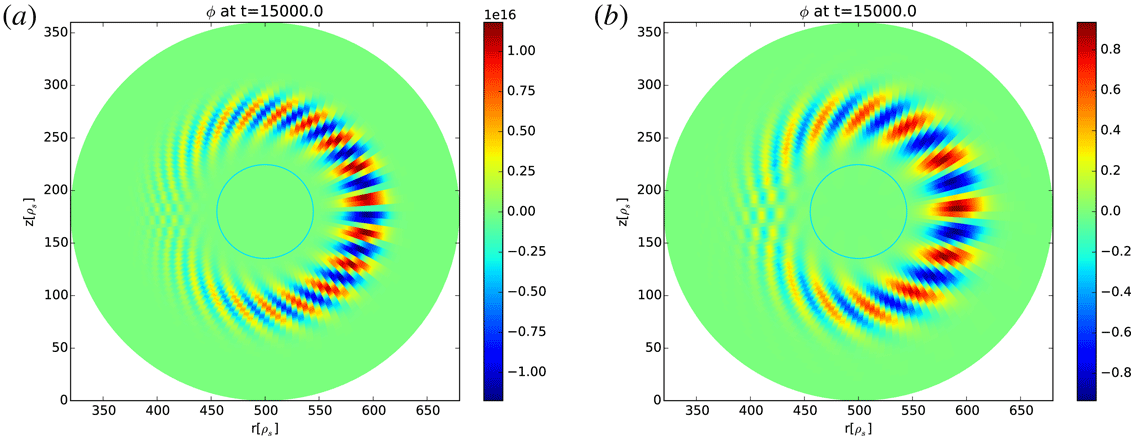
shows the same sign for the frequency for all investigated modes. Finally, we show in figure 7 the mode structure of the strongest growing mode for the two investigated Debye lengths which both still look comparable to the conventional ITG case.
(a) Growth rate and (b) frequency spectrum for a pair plasma with cyclone base case parameters for two different Debye lengths.

Numerical results for the growth rate and frequency for different mode numbers, the mass ratio is equal to 1 and
 $\hat{\unicode[STIX]{x1D706}}_{D}=0.01508$
.

Numerical results for the growth rate and frequency for different mode numbers, the mass ratio is equal to 1 and
 $\hat{\unicode[STIX]{x1D706}}_{D}=3$
.

Mode structure of the strongest growing mode in a pair plasma at
 $t=15\,000\unicode[STIX]{x1D6FA}^{-1}$
for
 $\hat{\unicode[STIX]{x1D706}}_{D}=0.01508$
(a) and
 $\hat{\unicode[STIX]{x1D706}}_{D}=3$
(b). Note the different scales.

5 GAMs for pair plasma
With a Rosenbluth–Hinton (RH) test, the acoustic response of a toroidal pair plasma can be studied (Rosenbluth & Hinton Reference Rosenbluth and Hinton1998). A RH test is a linear numerical simulation where a radial electric field is initialized at
 $t=0$
and the oscillations of the zonal (i.e. axisymmetric) perturbations in time are investigated. Here, collisionless electrostatic RH tests are performed with ORB5, with different mass ratios. The magnetic geometry is the same as in § 4, but we consider here flat
 $q$
,
 $T_{e}$
,
 $T_{i}$
and
 $n_{e}$
equilibrium profiles. The values of
 $q$
and
 $T_{e}$
are the ones measured at the reference magnetic surface of the cyclone base case (namely at
 $\unicode[STIX]{x1D70C}_{0}=r_{0}/a=0.5$
). The value of the density is imposed by the value of the Debye length, which is set to
 $\hat{\unicode[STIX]{x1D706}}_{D}=0.01508$
for the scans presented in this section. The value of
 $\hat{\unicode[STIX]{x1D706}}_{D}$
has also been scanned from
 $\hat{\unicode[STIX]{x1D706}}_{D}=0.01508$
to
 $\hat{\unicode[STIX]{x1D706}}_{D}=3$
, with no significant difference in the results.
A typical RH test with ORB5 with
 $m_{i}=m_{e}$
has a grid size of
 $(N_{s},N_{\unicode[STIX]{x1D712}},N_{\unicode[STIX]{x1D719}})=(64,64,4)$
and a time step of
 $\unicode[STIX]{x0394}t=5\unicode[STIX]{x1D6FA}^{-1}$
(whereas smaller time steps are needed for smaller values of
 $m_{e}/m_{i}$
). The initial perturbation of the zonal scalar potential is of the form
 $\bar{\unicode[STIX]{x1D719}}_{0}=\sin (\unicode[STIX]{x03C0}\unicode[STIX]{x1D70C})$
corresponding to
 $k_{r}\unicode[STIX]{x1D70C}_{i}=\sqrt{2}\unicode[STIX]{x1D70C}^{\ast }\unicode[STIX]{x03C0}\sim 0.025$
. Dirichlet boundary conditions are imposed at the inner and outer boundaries in the radial domain.
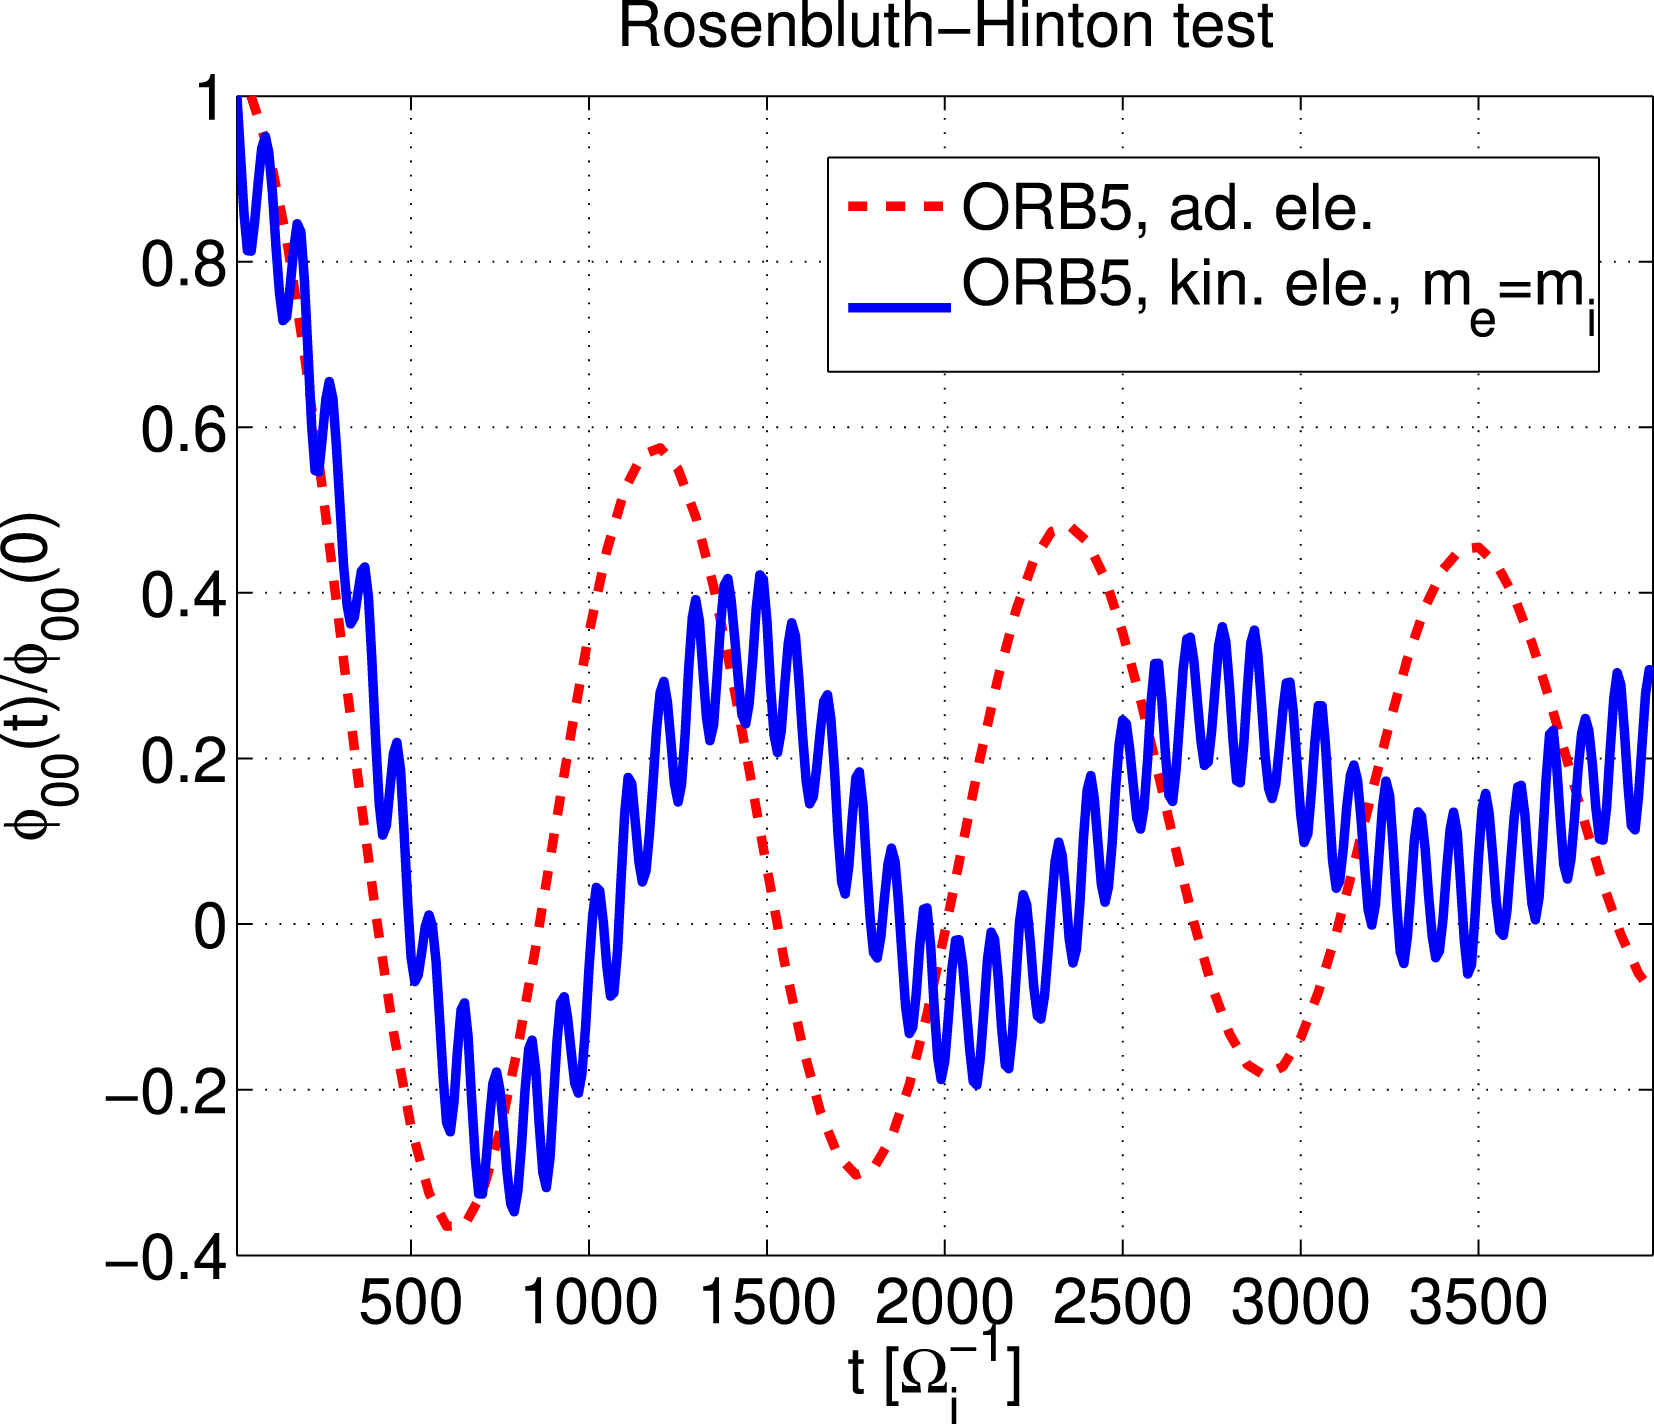
Oscillation of the zonal component of the scalar potential, for a simulation of a pair plasma, i.e. with kinetic electrons with
 $m_{e}=m_{i}$
(blue continuous line) and for a simulation of a deuterium plasma with adiabatic electrons (red dashed line).

The result of the RH test (see the blue line in figure 8, where the perturbed zonal component of the scalar potential measured at
 $\unicode[STIX]{x1D70C}_{0}=0.5$
is depicted) shows the same qualitative behaviour as in a deuterium–electron plasma. In particular, the time evolution has two types of oscillations: (i) oscillations of the order of the sound frequency, i.e. the GAMs, and (ii) high-frequency oscillations which correspond to the
 $\unicode[STIX]{x1D714}_{H}$
mode – the electrostatic version of the shear-Alfvén waves. In this paper, we focus on the GAMs (for a discussion of the latter see Lee Reference Lee1987; Biancalani et al.
Reference Biancalani, Bottino, Lauber and Zarzoso2014; Novikau et al.
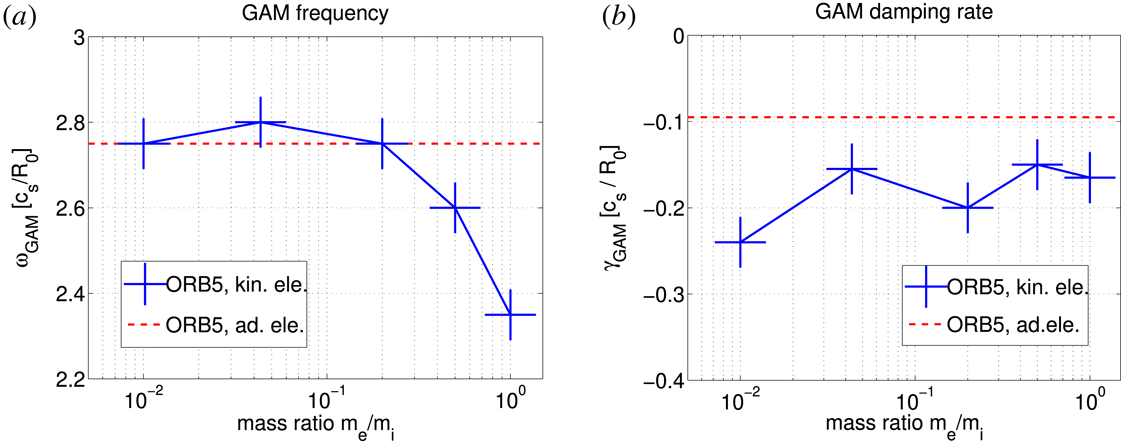
Reference Novikau, Biancalani, Bottino, Conway, Gürcan, Manz, Morel, Poli and Di Siena2017). For comparison, the result from a simulation of a deuterium plasma with adiabatic electrons is also shown in figure 8, as a red dashed line. Note that both the frequency and the damping rate are different for a pair plasma and a deuterium–electron plasma, but of the same order of magnitude.
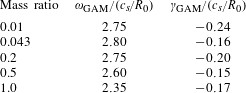
The dependence of the frequency and damping rate of the GAM on the mass ratio is also investigated. The results are given in table 5 and shown in figure 9. Different simulations (with different resolutions) have been performed for each case, and the average result is shown in figure 9, together with the dispersion around the average value, which is represented by the size of the crosses. Note also that, within the same simulation, the measurement of the frequency and damping rate can slightly change depending on the time window used for the measurement. This also contributes to the size of the error bar shown in figure 9. The frequency decreases with increasing electron mass only when the latter becomes comparable to the ion mass. This is due to the inertia of the plasma where both electrons and ions have the same weight.
For the damping rate, a higher value of the simulations with kinetic electrons is observed with respect to the simulations with adiabatic electrons, consistently with Biancalani et al. (Reference Biancalani, Bottino, Lauber and Zarzoso2014), Novikau et al. (Reference Novikau, Biancalani, Bottino, Conway, Gürcan, Manz, Morel, Poli and Di Siena2017), Zhang & Lin (Reference Zhang and Lin2010). No clear dependence on the electron mass is observed in this regime, where the variations with
 $m_{e}/m_{i}$
are within the error bar. For comparison, the frequency and damping rate in the simulation with adiabatic electrons are
 $\unicode[STIX]{x1D714}=2.75\,c_{s}/R_{0}$
and
 $\unicode[STIX]{x1D6FE}=0.095\,c_{s}/R_{0}$
. Compared to the values obtained with adiabatic electrons, the frequency of a pair plasma is smaller by a factor 0.85 and the damping rate is larger by a factor of 1.74.
Numerical result for the GAM frequency and damping rate for different mass ratios.

GAM frequency (a) and damping rate (b) versus mass ratio. The red dashed line gives the gyrokinetic prediction for a deuterium plasma with adiabatic electrons.

6 Summary
To summarize, we have introduced a new model in the global code ORB5 in order to enable pair plasma simulations. This code was benchmarked against the cyclone base case for conventional plasmas and previous pair plasma results in a local geometry and reasonable agreement was found. The mass dependence of the linear growth rate and frequency was studied for a Debye length smaller and greater than the reference gyroradius, respectively. While the results for the growth rate look qualitatively similar they differ by a factor
 ${\sim}10$
showing a weakening of the instability due to the Debye screening term. In a separate scan of the Debye length we found an almost complete stabilization of a pair plasma for a Debye length of
 $\hat{\unicode[STIX]{x1D706}}_{D}=5$
. In an investigation of the linear spectrum we found the peak location of the growth rate in a pair plasma shifted to a mode number of
 $n=10-15$
, somewhat smaller than for a conventional plasma. The corresponding mode structure is, however, still comparable to the ITG one.
We concluded the linear investigation of pair plasmas with a study on GAMs. While the oscillation of the initial perturbation is only affected by the mass ratio close to unity, the damping rate was for all studied mass ratios significantly stronger than in a conventional plasma.
As we have seen in these global simulations performed with ORB5, temperature-gradient driven modes are observed with small but finite frequency in pair plasmas, contrarily to the studies performed with flux-tube simulations of GENE (Kennedy et al. Reference Kennedy, Mishchenko, Xanthopoulos and Helander2018), where the real part of the frequency vanishes. It is conjectured here that this is due to global effects. The detailed analysis of the difference between global and local simulations is outside the scope of this paper, and will be investigated in a dedicated publication.
Based on these results we will investigate how the linear characteristics change by introducing a third species and if turbulence can be observed in a pair plasma.
Acknowledgements
The authors would like to acknowledge useful discussions with P. Helander and T. Sunn Pedersen as well as technical support with GENE by T. Görler. Numerical simulations were performed on the Marconi supercomputer within the framework of the ORB5APEX project. J.H.-S. acknowledges funding from the European Research Council (ERC) under the European Union’s Horizon 2020 research and innovation programme under grant agreement no 741322.