1. Introduction
Sedimentary archives constitute the first-choice evidence for building the geological history of the Earth's surface. Their absence greatly limits interpretations but raises the challenging question of whether a sedimentary cover was ever deposited or if it has been eroded. This is crucial for intracontinental basins and adjacent basement highs, which are commonly considered as stable areas because they appear to be relatively unaffected by plate tectonics, and are further from plates boundaries. Moreover, data are lacking to unravel the history of their vertical movements. Nevertheless, intracratonic basins may have experienced protracted subsidence interrupted by phases of uplift. The mechanisms responsible for such vertical movements are still largely debated for both subsidence and uplift (Armitage & Allen, Reference Armitage and Allen2010). For example, recent data acquired on the Phanerozoic Williston and Western Canada sedimentary basins and the adjacent Canadian Shield show that large regions of the North American continent were buried under sedimentary basins during Palaeozoic time, before significant Palaeozoic – Early Mesozoic unroofing removed these strata (Feinstein et al. Reference Feinstein, Kohn, Osadetz, Everitt and O'Sullivan2009; Flowers et al. Reference Flowers, Ault, Kelley, Zhang and Zhong2012). Authors have proposed either dynamic topography (Flowers et al. Reference Flowers, Ault, Kelley, Zhang and Zhong2012) or far-field effects of orogenic processes (Feinstein et al. Reference Feinstein, Kohn, Osadetz, Everitt and O'Sullivan2009) to account for these movements. Unravelling the vertical motions affecting intracontinental regions could contribute to a better understanding of the coupled evolution of uplifting and subsiding areas in a ‘source-to-sink’ context.
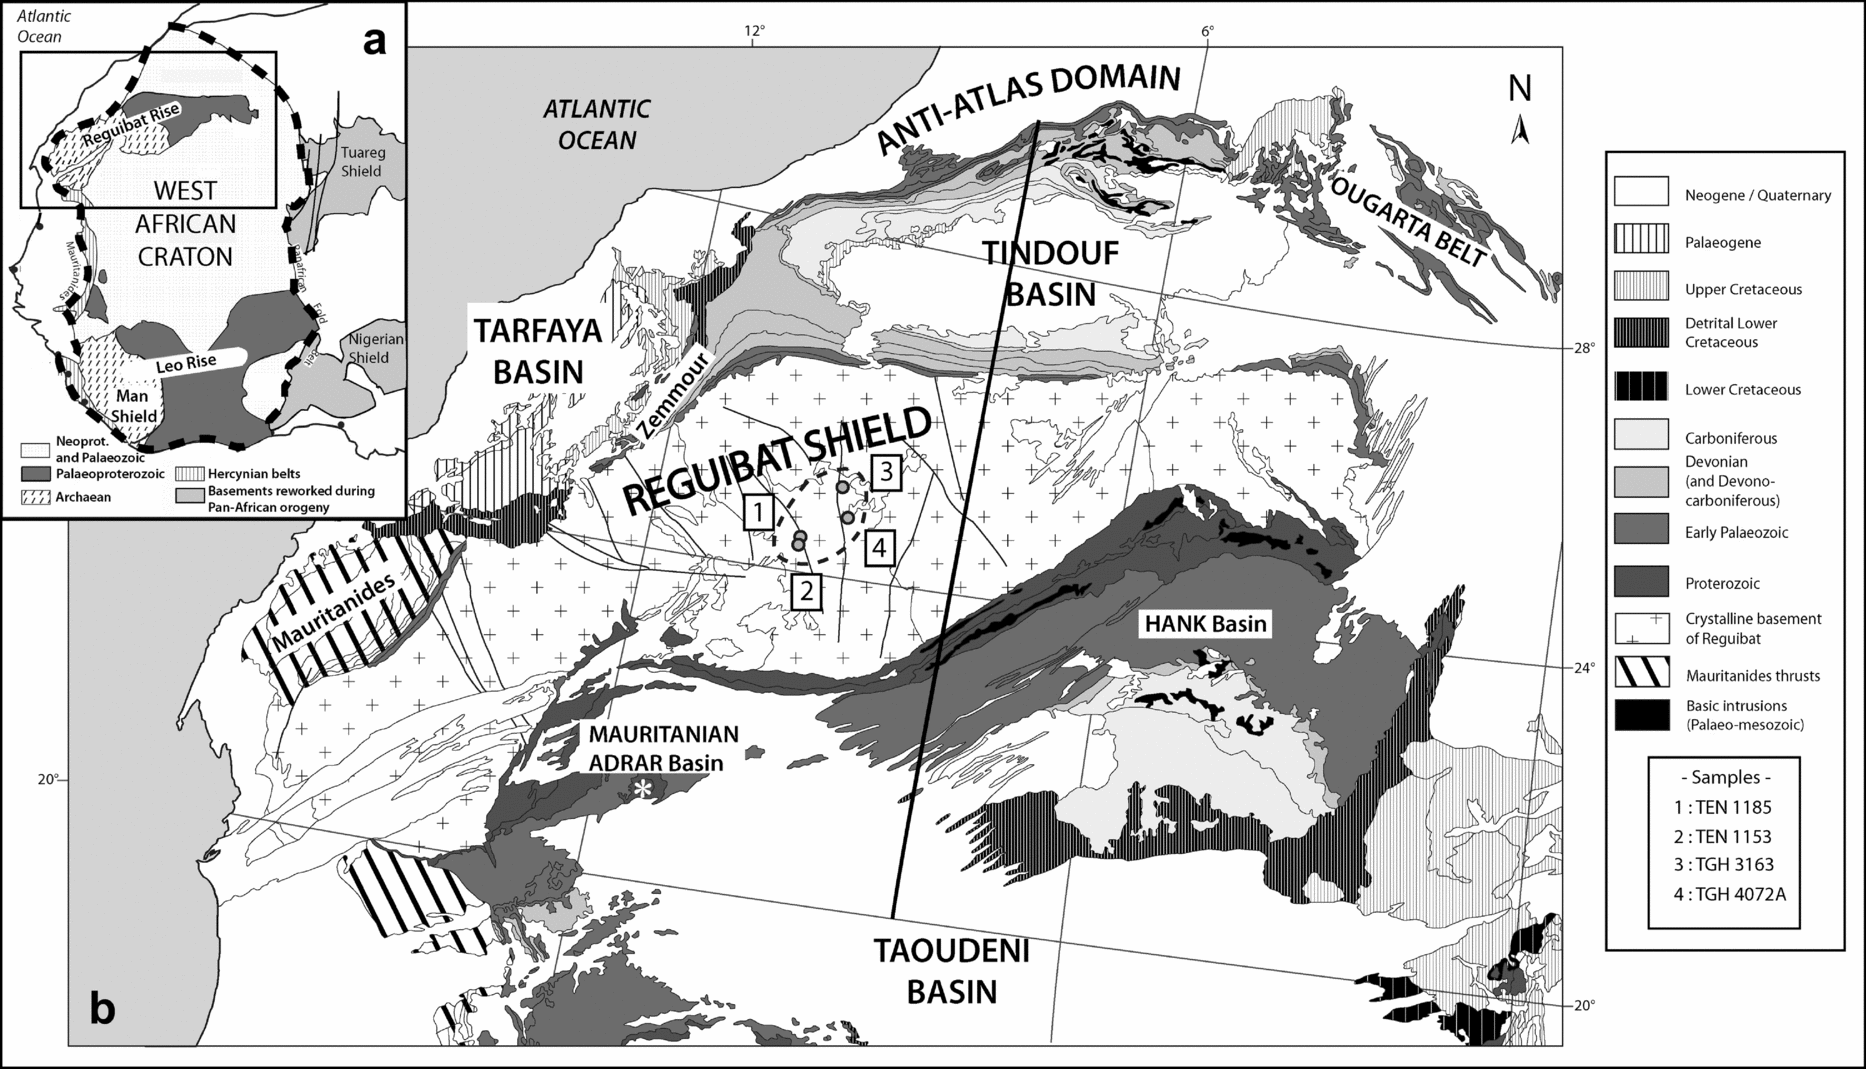
The Reguibat Rise (RR) in the northern part of the West African Craton (WAC) (Fig. 1a) is formed by Archaean and Lower Proterozoic rocks. Sedimentary rocks are not present except for some patches of poorly dated Cenozoic formations (Gevin, Reference Gevin1960; Fabre, Reference Fabre2005). The RR is bounded to the north by the Tindouf Basin and to the south by the Taoudeni Basin, both of which are filled by Proterozoic and/or Palaeozoic sediments (Fig. 1b). The original extent of any Proterozoic/Palaeozoic cover over the RR is unknown. Moreover, though poorly represented, Meso-Cenozoic sediments in these two basins and locally on the edge of the RR testify that vertical movements had occurred in the last 250 Ma: the syncline-shape of the Palaeozoic Tindouf Basin unconformably topped by horizontal Cretaceous strata is one example. This region is key to understanding the stability of the WAC during Meso-Cenozoic times as it is located at the intersection of several geological domains: it is bounded to the west by the Central Atlantic, which opened during the early Mesozoic (Labails et al. Reference Labails, Olivet, Aslanian and Roest2010), and to the north by the active Cenozoic Atlas System (Frizon de Lamotte et al. Reference Frizon de Lamotte, Saint Bézar, Bracène and Mercier2000). We have conducted the first low-temperature thermochronology study in this area, combined with the construction of an isopach map of the Upper Palaeozoic succession in the Tindouf Basin and a regional cross-section between the Taoudeni and Tindouf basins over the RR. Together with the available geological data, we are able to propose a new model for the vertical motion of this region of the WAC.
2. Geological setting
2.a. The Reguibat Rise (RR)
The RR (Fig. 1b) is a vast, ENE-trending basement arch along the northern part of the WAC (Fig. 1a). It is located south of the northern edge of the WAC, the latter extending to the Anti-Atlas Variscan Belt north of the Tindouf Basin (Gasquet et al. Reference Gasquet, Ennih, Liegeois, Soulaimani, Michard, Michard, Chalouan and Saddiqi2008). The topography of the RR is relatively flat, with elevations ranging from 200 to < 500 m and a slight asymmetry with decreasing elevations from north to south and from east to west towards the Atlantic margin. The RR basement is divided into two regions based on their respective ages (Dillon & Sougy, Reference Dillon, Sougy, Nairn and Stelhi1974; Bessoles, Reference Bessoles1977; Choubert & Faure-Muret, Reference Choubert and Faure-Muret1990): an Archaean western part, consisting in high-grade metamorphic rocks, migmatites or charnockites with ages ranging between 3.5 and 2.5 Ga, and an Eburnean eastern part (2.2–2.0 Ga), representing the highest elevated part of the arch. Along its western edge, the Reguibat basement is involved in the Variscan Mauritanides fold-and-thrust belt (Villeneuve et al. Reference Villeneuve, Bellon, El Archi, Sahabi, Rehault, Olivet and Aghzer2006). There is a thin and scattered Meso-Cenozoic cover that exists over parts of the RR, represented by the so-called ‘hamada’ formations (100 to < 200 m thick). These continental formations mainly occur in the eastern part of the rise (Gevin, Reference Gevin1960; Choubert & Faure-Muret, Reference Choubert and Faure-Muret1990). They are poorly dated (Fabre, Reference Fabre2005), although the uppermost parts are considered to be Late Cenozoic in age.
(a) Simplified map of West Africa (after Peucat et al. Reference Peucat, Capdevila, Drareni, Mahdjoub and Kahoui2005) showing the location of the West African Craton and the region of study. (b) Geological map of the Reguibat Shield and neighbouring basins. The reference cross-section is represented by the black bold line. The white star in the Mauritanian Adrar marks the location of the Richat structure.

2.b. Adjacent basins: Tindouf, Taoudeni and Tarfaya basins
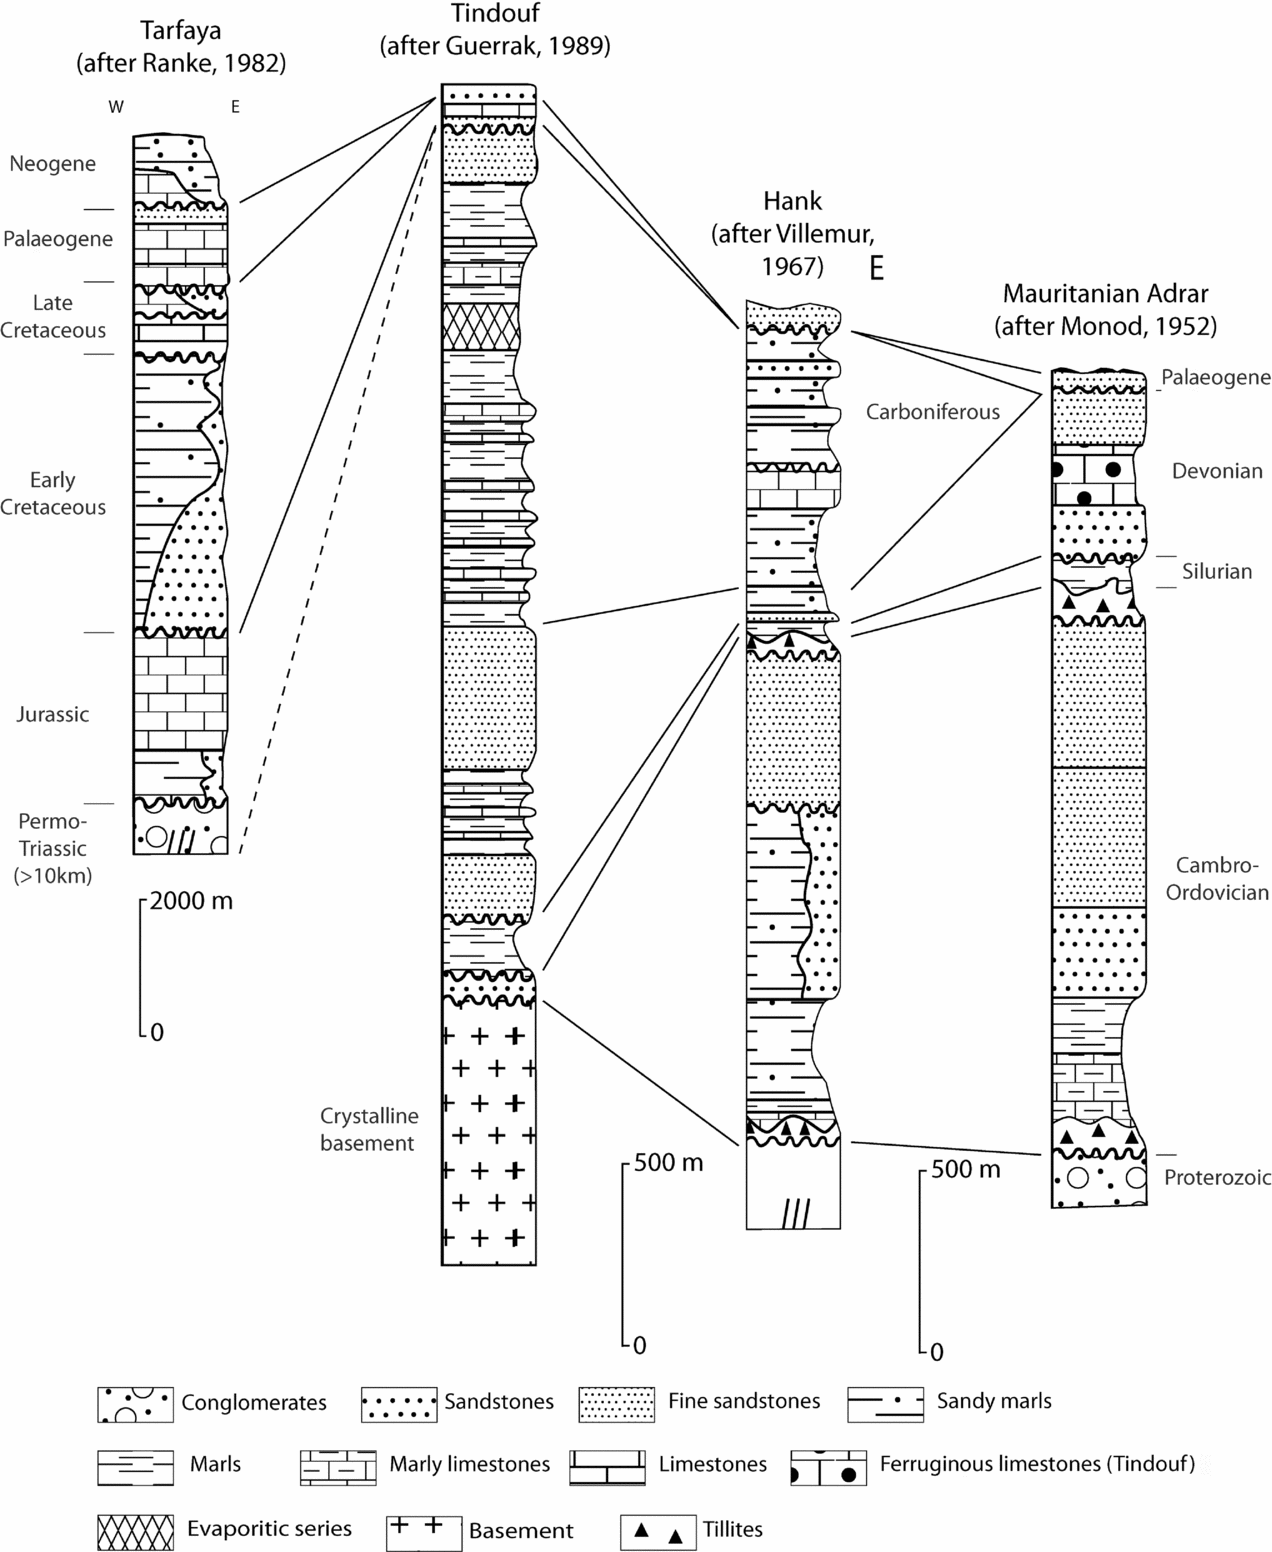
The Tindouf Basin is a large E–W-trending synclinorium flanking the RR to the north. The southern flank of the basin has a low (5–10°) dip whereas the northern flank is involved in the Variscan deformation of the Anti-Atlas Belt (Destombes, Hollard & Willefert, Reference Destombes, Hollard, Willefert and Hollard1985; Burkhard et al. Reference Burkhard, Caritg, Helg, Robert-Charrue and Soulaimani2006). The total thickness of the Palaeozoic sedimentary succession reaches 5–6 km at a maximum in the centre of the basin, but thins southward (Boote, Clark-Lowes & Traut, Reference Boote, Clark-Lowes, Traut, MacGregor, Moody and Clark-Lowes1998) (Fig. 2). Cambrian strata do not crop out, but have been identified (in drill data and seismic data) thinning southwards on the Reguibat basement between two erosion surfaces (Deynoux, Sougy & Trompette, Reference Deynoux, Sougy, Trompette and Hollard1985; Boote, Clark-Lowes & Traut, Reference Boote, Clark-Lowes, Traut, MacGregor, Moody and Clark-Lowes1998), and laterally in the Zemmour (Sougy, Reference Sougy1964). The Ordovician deposits correspond to the glacial Hirnantian interval and are overlain by thin marine Silurian deposits (20–70 m). The Devonian series, which unconformably overlies the latter, begins in the Lochkovian, before an Emsian–Eifelian transgression, followed by a generalized regression from the Fammenian until the beginning of the Carboniferous (Guerrak, Reference Guerrak, Young and Taylor1989; Wendt et al. Reference Wendt, Kaufmann, Belka and Korn2009). The Devonian series is about 1000 m thick on the southern flank of the Tindouf Basin. Carboniferous deposits (1.5–2 km thick) exhibit an alternation of transgressions and regressions until the Middle Namurian. Authors have agreed that communication existed between the Tindouf Basin and the Taoudeni Basin at least until the end of the Early Carboniferous transgression (Bertrand-Sarfati et al. Reference Bertrand-Sarfati, Moussine-Pouchkine, Affaton, Trompette, Bellion, Dallmeyer and Lécorché1991; Legrand-Blain & Perret-Mirouse, Reference Legrand-Blain and Perret-Mirouse2000). The Palaeozoic succession is unconformably overlain by the so-called hamada formations. Lower Cretaceous deposits are well represented in the western part of the Tindouf Basin (Sougy, Reference Sougy1959; Choubert, Faure-Muret & Hottinger, Reference Choubert, Faure-Muret and Hottinger1966; Fabre, Reference Fabre2005, p. 428), with thicknesses of a few hundred metres. Overlying these, Cenomano–Turonian deposits form a carbonate benchmark throughout the whole of northern Africa (Sahagian, Reference Sahagian1988). Paleocene sandstones rest unconformably on these carbonate formations (Fabre, Reference Fabre2005, p. 428), and the uppermost formations constitute the ‘Hamada’ sensu stricto, which are poorly dated, but thought to be Neogene in age (Gevin, Reference Gevin1960; Choubert & Faure-Muret, Reference Choubert and Faure-Muret1990; Zouhri et al. Reference Zouhri, Kchikach, Saddiqi, El Haïmer, Baidder, Michard, Michard, Chalouan and Saddiqi2008).
Stratigraphic logs of the basins. (a) Tarfaya basin (after Ranke, von Rad & Wissmann, Reference Ranke, von Rad, Wissmann and von Rad1982); (b) southern flank of the Tindouf Basin (after Guerrak, Reference Guerrak, Young and Taylor1989); (c) Hank Sub-basin (after Villemur, Reference Villemur1967); (d) Mauritanian Adrar (after Monod, Reference Monod1952).

The Taoudeni Basin, located to the south of the RR, is a large basin (2000000 km2) containing mainly Proterozoic and Palaeozoic sediments. Stratigraphic studies, conducted in both the Adrar (northwestern part) and the Hank (northeastern part) basins (Monod, Reference Monod1952; Villemur, Reference Villemur1967), show consistent sedimentary successions, with few lateral facies changes (Fig. 2). Above a significant thickness of Proterozoic series, an unconformable Palaeozoic succession begins with a Cambrian – Lower Ordovician sequence (< 1500 m), which is separated from Upper Ordovician glacial deposits by an erosion surface. After the Hirnantian glacial episode, the Silurian transgression (Silurian thickness of ~100 m) is recorded all over the WAC, suggesting a common history for the whole region. Finally, Devonian and Carboniferous strata rest unconformably on the Silurian. Transgression and regression phases similar to those observed in the Tindouf Basin have been recognized. From the end of the Devonian, continental influences are recorded (Fabre & Moussine-Pouchkine, Reference Fabre and Moussine-Pouchkine1971). The Carboniferous and Devonian succession is > 1 km thick in the Hank Sub-basin. There is a sedimentary hiatus between the Permian and the end of the Jurassic. The Lower Cretaceous is represented by the ‘Continental Intercalaire’ (Killian, Reference Killian1931; revised by Furon, Reference Furon1956). Strata of Late Cretaceous age are present only in the eastern part of the basin (Fabre et al. Reference Fabre, Arnaud-Vanneau, Belhadj, Monod, Bitam and Fabre1996; Luger, Reference Luger2003). The Taoudeni Basin is partially covered by Neogene deposits, which can reach 100 m in thickness (Fig. 1b).
The Tarfaya Basin occupies the western part of the region. It has been an area of subsidence since the end of Palaeozoic times and preserves a comprehensive record of the Late Mesozoic history of the area (Choubert, Faure-Muret & Hottinger, Reference Choubert, Faure-Muret and Hottinger1966; El Khatib, Reference El Khatib1995). Following the break-up of Pangaea, a c. 10 km thick succession of Triassic clastic sediments was deposited. This was followed by a transgressive Jurassic succession until an abrupt shift from carbonate platform to deltaic and continental environment occurred at the beginning of the Early Cretaceous. More than 2 km of Lower Cretaceous strata are present in the basin. Marine conditions resumed from Cenomano–Turonian to Eocene time. The palaeoenvironment then changed in response to the Atlas uplift (Frizon de Lamotte et al. Reference Frizon de Lamotte, Saint Bézar, Bracène and Mercier2000). Thin continental Neogene deposits cap the stratigraphic succession (Choubert, Faure-Muret & Hottinger, Reference Choubert, Faure-Muret and Hottinger1966; Martinis & Visintin, Reference Martinis, Visintin and Reyre1966).
3. Material and methods
3.a. Low-temperature thermochronology
Ten samples, provided by the BRGM (Bureau de Recherches Géologiques et Minières), have been collected from the central part of the RR in the Archaean basement (Fig. 1b; see Table 1 for exact locations). The samples were crushed and sieved, then apatites were isolated using the conventional procedure (heavy liquids, magnetic and hand-picking separations). Five samples where apatite crystal yield was sufficient were then mounted in epoxy resin and etched in 5M HNO3 for 20 seconds at 20±1°C to reveal spontaneous tracks.
Fission track analysis results

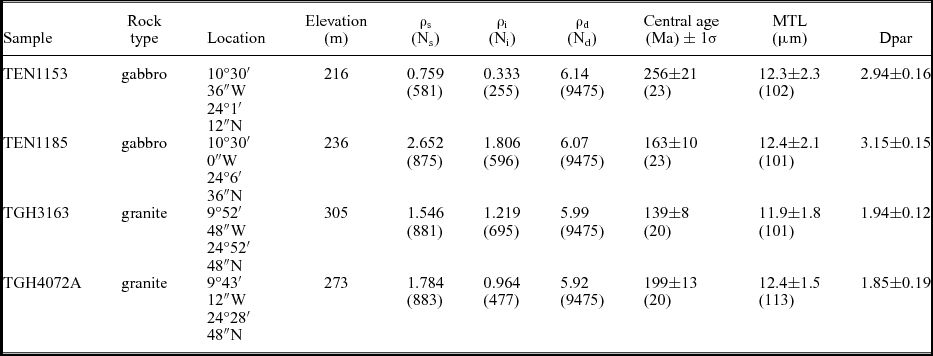
ρ – density of tracks, s, i – spontaneous and induced densities in apatites and the mica detector; d – tracks density of the neutron glass monitor (CN5). Densities are expressed in 105t/cm2. Ns, Ni and Nd are the number of counted spontaneous and induced tracks and in the glass monitor. MTL – mean track length. Values in bracket for central age and MTL are, respectively, the number of single-grain ages and the number of lengths measured. 1σ is the standard deviation. Dpar corresponds to a kinetic factor determined for each sample.
The external detector method was used for analysis (Gleadow & Duddy, Reference Gleadow and Duddy1981). Neutron irradiation was carried out in Garching (Germany); neutron fluence was monitored using the standard reference CN5. Counting was done on a Leica light microscope equipped with a gridded ocular at a total ×1000 magnification. The ‘central age’ method was followed (Galbraith & Laslett, Reference Galbraith and Laslett1993), using the zeta calibration method (Hurford & Green, Reference Hurford and Green1983), with a zeta factor determined by the first author of 368±10, determined with CN5 glass dosimeters and IUGS apatite age standards (Hurford, Reference Hurford1990). Confined track length measurements were carried out using the same microscope with a ×1000 magnification and a digitizing tablet linked via a drawing tube to the microscope.
(U–Th)/He analysis was carried out on the only sample where euhedral apatite crystals were observed. Crystals were dimensionally characterized along the three axes and placed into a platinum basket. Ejection factors and sphere equivalent radius were determined using the Monte Carlo simulation from Ketcham, Gautheron & Tassan-Got (Reference Ketcham, Gautheron and Tassan-Got2011) (see Table 2). Protocol for the measurement of He, U and Th content has been described in Douville et al. (Reference Douville, Sallé, Frank, Eisele, Pons-Branchu and Ayrault2010), using an inductively coupled plasma quadrupole mass spectrometer (ICP-QMS) series II CCT Thermo-Electron at LSCE (Laboratoire des Sciences du Climat et l'Environnement) (Gif-sur-Yvette; France). The analysis was calibrated using internal and external age standards, including Limberg Tuff. Mean AHe ages of 16.6±1.1 Ma and 31.8±0.5 Ma have been measured for the Limberg Tuff and Durango yellow apatite, which are in agreement with literature data (i.e. 16.8±1.1 Ma from Kraml et al. Reference Kraml, Pik, Rahn, Selbekk, Carignan and Keller2006 and 31.4±0.2 Ma from McDowell, McIntosh & Farley, Reference McDowell, McIntosh and Farley2005). Error on the AHe age at 1σ is estimated at 8% reflecting uncertainty in the ejection factor (FT) correction and standard dispersion. The final He, U–Th content and AHe age are reported in Table 2.
(U–Th)/He results for sample TEN1185

*(U–Th)/He age corrected from alpha-ejection, with analytical incertitude at one sigma. FT – ejection factor.
Thermal history modelling was conducted with the HeFTy software (Ketcham, Gautheron & Tassan-Got, Reference Ketcham, Gautheron and Tassan-Got2011, v.1.7.4), using the annealing model of Ketcham et al. (Reference Ketcham, Carter, Donelick, Barbarand and Hurford2007), and the Kolmogorov–Smirnov test as a statistical test for the goodness of fit. The parameter Dpar was used in the modelling, which is linked to the chemistry of the apatites and hence to the kinetics of track annealing (Burtner, Nigrini & Donelick, Reference Burtner, Nigrini and Donelick1994; Barbarand et al. Reference Barbarand, Carter, Wood and Hurford2003).
3.b. Reference layer mapping in the Tindouf Basin
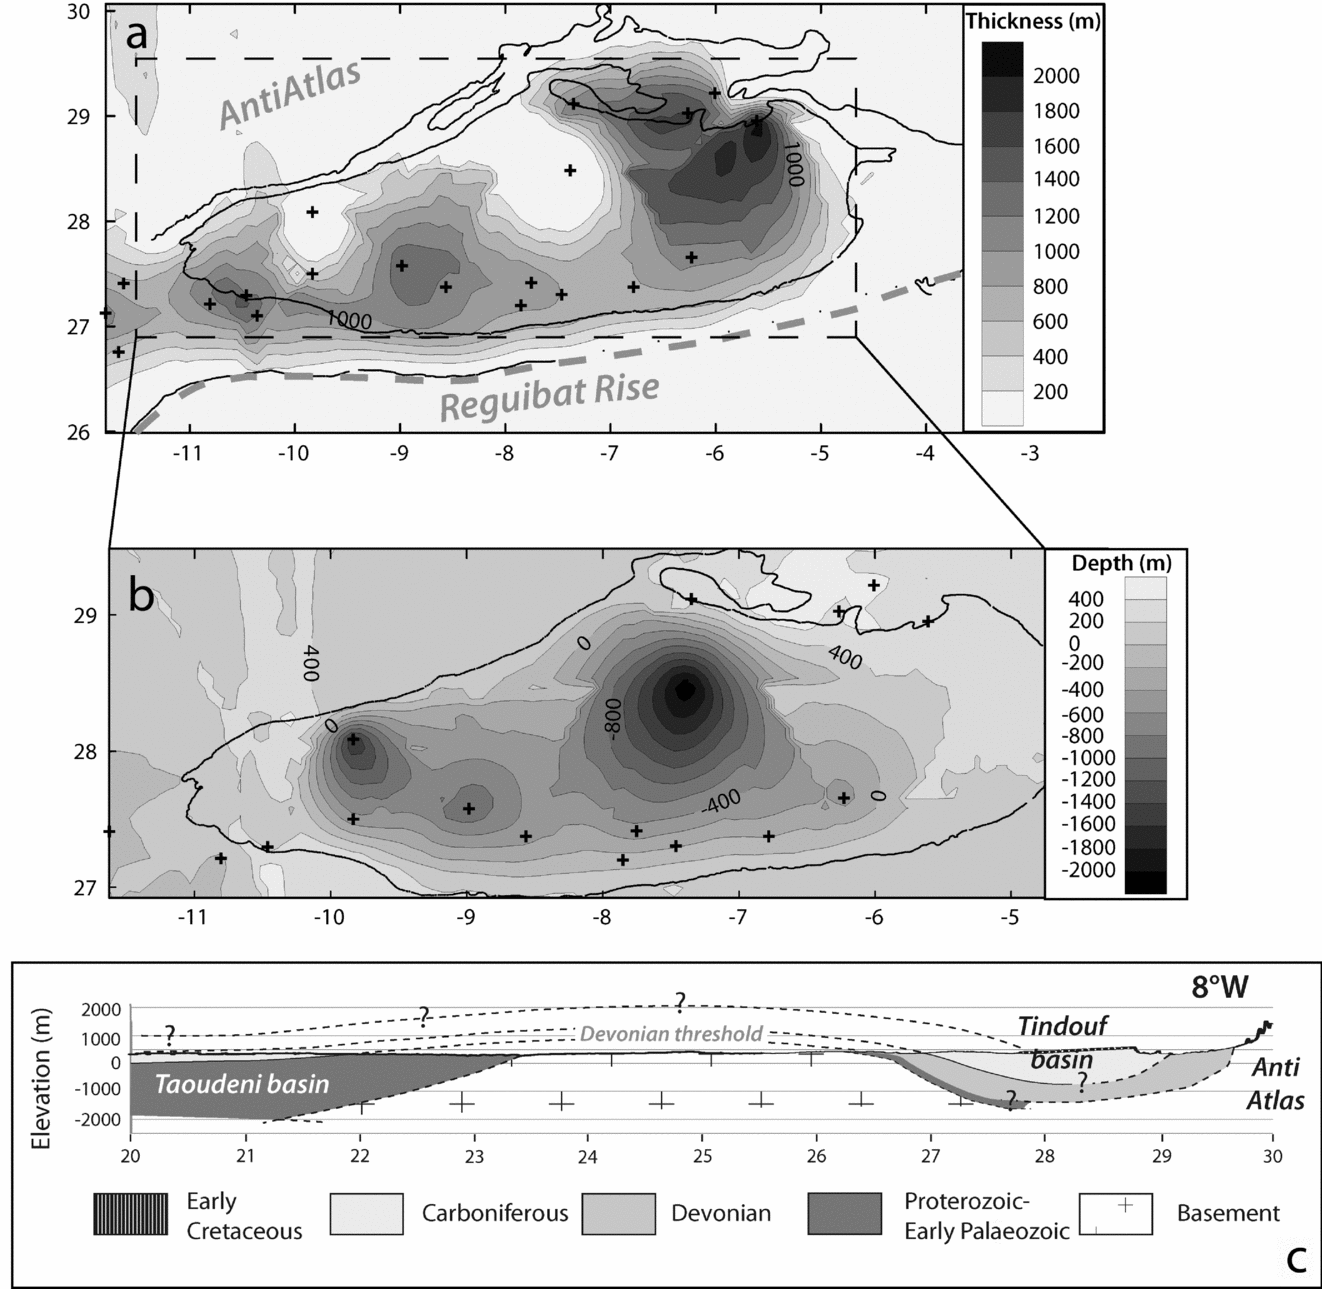
Seventeen wells, mainly located on the southern flank of the Tindouf Basin, out of a total of 23 wells extracted from a TOTAL database, were selected on the basis that the following information was available: (1) surface elevation of the well, (2) depth of the top of the Devonian succession and (3) depth of the top of the Silurian succession. Combined with present-day surface contours of top Devonian and top Silurian formations, these data were used to construct two surfaces using Surfer software (Golden Software Inc) by krigging gridding. Tops of the Silurian and Devonian levels were modelled and used to build an isopach map of the Devonian covering the Tindouf Basin (Fig. 3a). This map, associated with the top Devonian level, gives us insights about the variation in thickness of the Upper Palaeozoic succession across the basin. These data have also been used to draw a regional cross-section at basin-scale from the Tindouf Basin through the RR to the Taoudeni Basin (Fig. 3c). Published data were used to constrain the Taoudeni Basin part of the cross-section.
(a) Map of the isopachs of the Devonian. Limits of the top Devonian and the top Silurian are the black lines. Black crosses indicate the position of the wells used to build the surfaces. (b) Map of the isobaths of the Devonian. The limit of the top Devonian is indicated by a black line. Wells are located the same way as (a). Outside of the limits of the top Devonian surfaces are not reliable due to the gridding method, which extrapolates the data to fill the map at the boundaries. (c) Regional cross-section following 8°W meridian, based on the geometry of the Devonian in the Tindouf Basin from our maps. Geometries in the Taoudeni Basin are based on published literature; vertical exaggeration ×30.

4. Results
4.a. Low-temperature thermochronology results
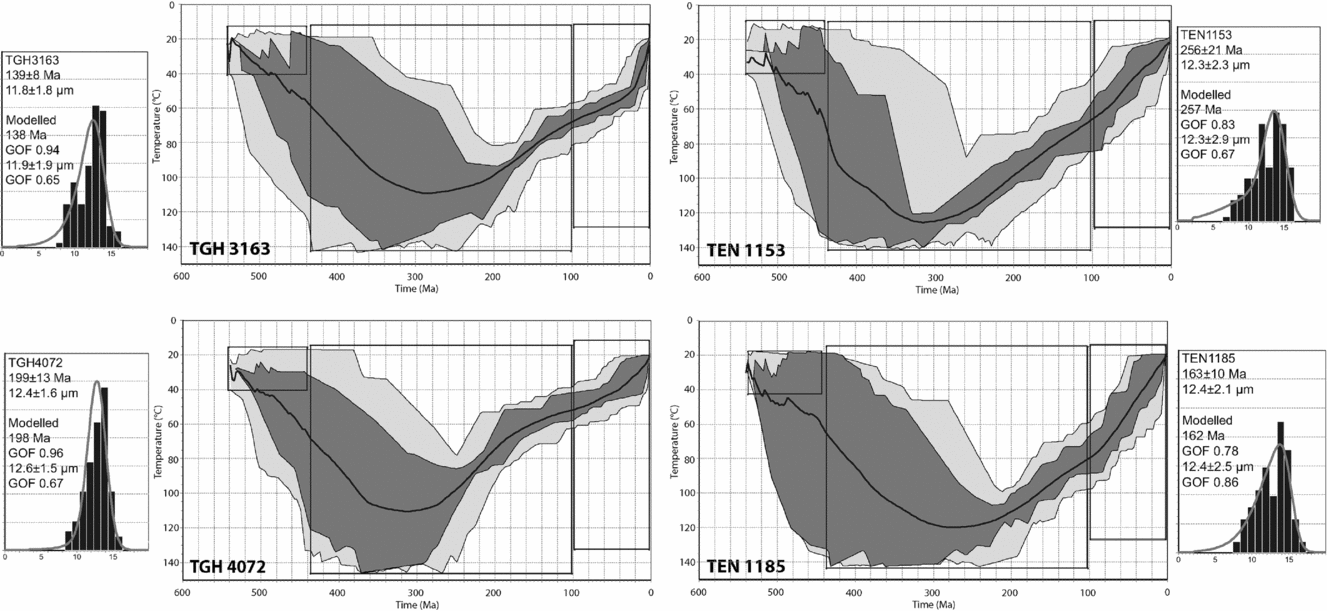
The fission track (FT) results are presented in Table 1, and track length histograms are presented in Figures 4 and 5. FT ages are 256±21 Ma (TEN1153), 199±13 Ma (TGH4072A), 163±10 Ma (TEN1185) and 139±8 Ma (TGH3163), respectively. Mean track lengths (MTL) are between 12.3 and 12.4 μm with a large standard deviation (2.3–2.4 μm) for three of the samples. (U–Th)/He dating on TEN1185 gave five replicates, 149±12 Ma, 110±9 Ma, 126±10 Ma, 120±10 Ma, 92±7 Ma, giving a mean age of 120±10 Ma (Table 2). Kinetic factors Dpar (Burtner, Nigrini & Donelick, Reference Burtner, Nigrini and Donelick1994; Barbarand et al. Reference Barbarand, Carter, Wood and Hurford2003) are quite constant for each sample, with low standard deviation (Table 1) Together with the FT ages, they indicate a homogeneous population in each sample.
Thermal modelling for the model 1. The light grey area represents the envelope for statistically good fitting time–temperature paths (GOF values > 0.50). The dark grey area represents the envelope for statistically acceptable time–temperature paths (GOF values > 0.05). The bold line is the best fit.

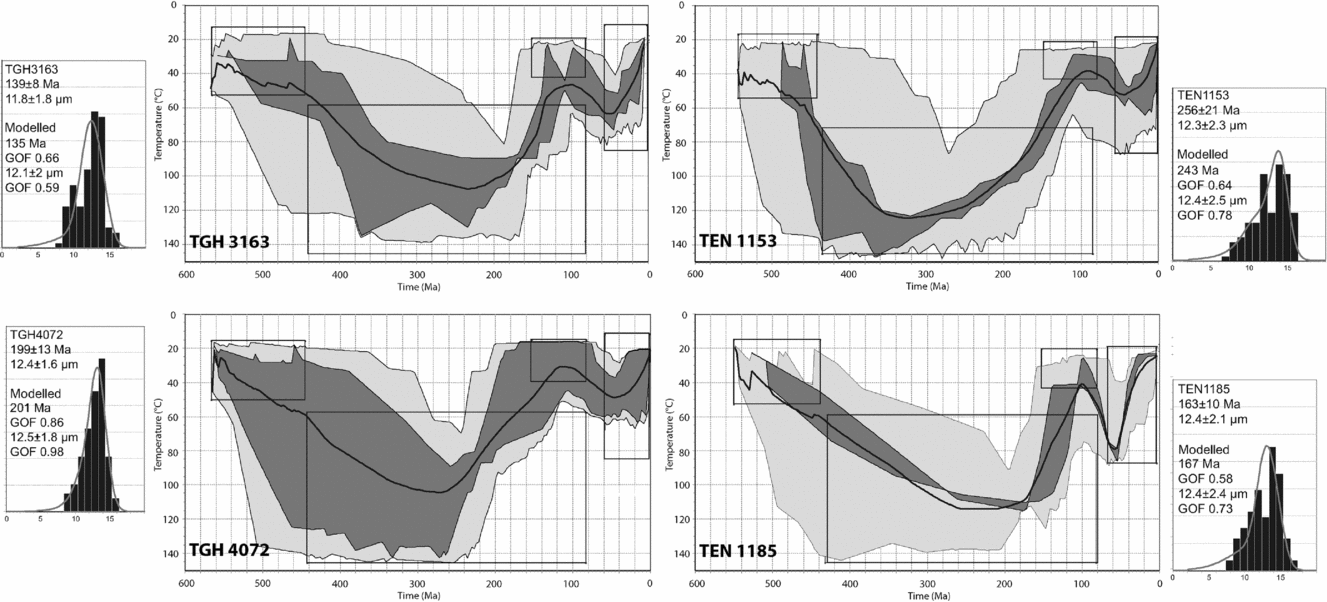
Thermal modelling for the model 2. Same legend as Figure 4.

4.b. Map of the Upper Palaeozoic layers of the Tindouf Basin
The isopach map of the Devonian is presented in Figure 3a, with positions of the wells and the present-day limits of outcrops of the top Silurian and the top Devonian. We clearly identify two large sub-basins, separated by a high at 7°W. The maximum thicknesses of the Devonian reaches at least 1300 m in the western basin and 1900 m in the eastern one. In the region of the high, the Devonian is 700–800 m thick.
The main observation is the general decrease in thickness from east to west. The limited well data and the extensive Variscan deformations (Burkhard et al. Reference Burkhard, Caritg, Helg, Robert-Charrue and Soulaimani2006) in the northern flank of the Tindouf Basin preclude precise estimation of the Devonian thickness. Thus, for the northern part of the map, the two regions with zero elevation are likely to result from both a lack of precision due to the low number of wells in the north of the basin and to perturbations related to the Variscan faults and folds.
Together with the depths of the top Devonian (base of the Carboniferous), we were able to evaluate the total thickness for the Upper Palaeozoic formations bounding the northern edge of the RR. In the case of the Tindouf Basin, the thickness ranges from 1.5 to 2 km for the southern flank of the basin, to a maximum of 3 km in the centre of the eastern sub-basin between 27°N and 28°30′N. This estimate is nevertheless a lower limit, as the Carboniferous is totally eroded.
4.c. Thermal history modelling
4.c.1. Geological constraints
Two models were tested, assuming different geological constraints. Both models consider that (1) samples were close to the surface during the Cambrian as attested by (i) the thinning of the Cambrian strata in the Tindouf Basin towards the RR basement between two erosion surfaces (Deynoux, Sougy & Trompette, Reference Deynoux, Sougy, Trompette and Hollard1985; Boote, Clark-Lowes & Traut, Reference Boote, Clark-Lowes, Traut, MacGregor, Moody and Clark-Lowes1998) and (ii) the existence of an unconformity between the Cambrian succession and the Precambrian basement in the Taoudeni Basin (Perrin, Elston & Moussine-Pouchkine, Reference Perrin, Elston and Moussine-Pouchkine1988); and (2) samples reached the surface during the Cenozoic in accordance with the presence of continental deposits in both the Tindouf and Taoudeni basins and on the RR. An additional constraint has been added for model 2: samples are considered to have been at the surface at the end of the Jurassic – beginning of the Cretaceous because continental Lower Cretaceous sandstones rest directly upon the RR basement southeast of the Tarfaya Basin (Fig. 1b).
4.c.2. Model 1
Modelling leads to a two-step thermal history (Fig. 4). All modelled FT age and track length distributions show acceptable fits with the real data, with goodness of fit (GOF) ranging from 0.78 to 0.96 for modelled ages, and from 0.65 to 0.86 for modelled MTL (a GOF > 0.5 is considered as acceptable). Large ‘constraint boxes’ have been chosen to cover all possibilities from surface conditions at the end of Cambrian until the end of the Cenozoic (boxes between 440–100 and 100–0 Ma and, respectively, 20–150°C and 20–130°C). Modelling suggests that the samples were subjected to temperatures higher than 100°C at the end of the Carboniferous. Cooling proceeds with a continuous and gentle slope of the time–temperature path until the samples reach the surface temperature during the Cenozoic, corresponding in our models to samples reaching temperatures from 60 to 20°C between 60 Ma and the present. This corresponds to a typical basement-cooling path, which may reflect a slow but continuous exhumation since the end of Palaeozoic times.
4.c.3. Model 2
The Early Cretaceous constraint (meaning a ‘constraint box’ between 150–80 Ma and 20–40°C, and keeping a wide box between 440–80 Ma and 60–150°C) produces a quite different thermal history (Fig. 5). Comparing real datasets with modelled ones gives a GOF ranging from 0.58 to 0.86 for modelled ages and from 0.59 to 0.98 for modelled MTL. The Palaeozoic thermal evolution is similar to that of model 1. The Meso-Cenozoic part contrasts with the previous basement-cooling history, with a faster cooling, the climax of which occurred during the Late Jurassic – Early Cretaceous. Following this cooling, weak heating occurred during the Late Cretaceous to Palaeogene period, followed by an episode of weak cooling during the Neogene. AHe data for sample TEN 1185 is in agreement with this model and confirm the accelerated phase of cooling during the Late Jurassic – Early Cretaceous, slightly older than the mean age (120±10 Ma). Pre-Cenozoic AHe data also show that the Upper Cretaceous/Palaeogene heating is not robustly constrained and will not be considered further.
5. Discussion
The two tested models appear statistically coherent with the data and either of them could represent the true thermal history. We nevertheless, prefer model 2 as it is more consistent with the geological evidence. The reasons for this preference are discussed below.
The isopach map of the Devonian strata and our estimates of the thickness of the Upper Palaeozoic succession suggest that the sedimentary realm during the Late Palaeozoic could have extended further south over the RR. In contrast, the Upper Palaeozoic succession is much thinner in the Taoudeni Basin (Hank and Adrar sub-basins) and Carboniferous strata are absent in the Mauritanian Adrar (Figs 1, 2). The Devonian succession is generally thinner in the Taoudeni Basin than in the Tindouf Basin although it can reach 500 m in thickness in the Adrar. The Taoudeni Basin suffered later erosion and the existence of Carboniferous strata in the western part is not constrained, whereas in the Hank Sub-basin, its top is eroded (Villemur, Reference Villemur1967). Palaeontological evidence (Legrand-Blain & Perret-Mirouse, Reference Legrand-Blain and Perret-Mirouse2000) suggests that the same fauna is present in the Carboniferous of the Hank Sub-basin and the Tindouf Basin. Finally, reviewing the stratigraphy of the WAC, Bertrand-Sarfati et al. (Reference Bertrand-Sarfati, Moussine-Pouchkine, Affaton, Trompette, Bellion, Dallmeyer and Lécorché1991) considered that the Taoudeni and the Tindouf basins have a common history until Namurian times.
We therefore propose as a working hypothesis, that the whole region was a site of deposition from Silurian to Carboniferous times (Fig. 3c). This is consistent with the FT ages which all post-date the Carboniferous, assuming a total resetting of the samples by a temperature above 110°C, which may correspond to a significant burial during the Late Palaeozoic. The present-day separation of the Tindouf and the Taoudeni basins could be the result of either Late Palaeozoic and/or Meso-Cenozoic events, or both. We will now discuss the age of this structuring.
5.a. Palaeozoic scenario
Cambro-Ordovician rocks record different histories in the different areas considered (Taoudeni, Reguibat and Tindouf) (Fig. 2). This period corresponds to an extensional episode in northern Gondwana (Alvaro et al. Reference Alvaro, Vennin, Villas, Destombes and Vizcaïno2007) during which the Taoudeni and Tindouf basins may have been separated by a threshold. The consistent Silurian record in each basin suggests that a sedimentary link between the two basins over the RR existed at that time (Fig. 2; Luning et al. Reference Luning, Loydell, Sutcliffe, Ait Salem, Zanella, Craig and Harper2000). The overlying Upper Palaeozoic formations are capped by an erosion surface which truncates either the Devonian or the Carboniferous sequence and is overlain by either Jurassic or Cretaceous strata. This unconformity has been extensively termed the Hercynian (or Variscan) unconformity (Boote, Clark-Lowes & Traut, Reference Boote, Clark-Lowes, Traut, MacGregor, Moody and Clark-Lowes1998 as an example). The time interval that it represents can encompass other erosion events (for a discussion about the Hercynian unconformity, see Frizon de Lamotte et al. Reference Frizon de Lamotte, Tavakoli-Shirazi, Leturmy, Averbuch, Mouchot, Raulin, Leparmentier, Blanpied and Ringenbach2013). Hence, a substantial part of the sedimentary record may be absent in the Devonian–Carboniferous formations.
A recent study (Frizon de Lamotte et al. Reference Frizon de Lamotte, Tavakoli-Shirazi, Leturmy, Averbuch, Mouchot, Raulin, Leparmentier, Blanpied and Ringenbach2013) reports a Late Devonian thermal event associated with regional extension which is recorded all over the northern margin of Gondwana (from northern Africa to Arabia). This Devonian event appears to have been synchronous with the formation of various basement arches separated by wide intracontinental basins throughout this large region. It is particularly marked in the Anti-Atlas (Wendt, Reference Wendt1988; Baidder et al. Reference Baidder, Raddi, Tahiri, Michard, Ennih and Liégeois2008) and Bechar Basin (Frizon de Lamotte et al. Reference Frizon de Lamotte, Tavakoli-Shirazi, Leturmy, Averbuch, Mouchot, Raulin, Leparmentier, Blanpied and Ringenbach2013). Subsurface data reveal the existence of unconformities between Upper Devonian, or earlier series, and Carboniferous or later series. The relatively consistent thickness of the Devonian succession across the RR (Fig. 3c) suggests that a sedimentary threshold may have existed, which could account for the variations in subsidence and could result from this Upper Devonian event. Subsurface data are, however, still lacking to enable firm conclusions to be drawn about such an early structuring of the RR.
During the Variscan orogeny (spanning the Late Devonian to Late Carboniferous, with the main tectonic phase occurring during Visean/Westphalian; Michard et al. Reference Michard, Hoepffner, Soulaimani, Baidder, Michard, Chalouan and Saddiqi2008), the RR was bounded by the Anti-Atlas to the north, the Ougarta Belt to the northeast and the Mauritanides Belt to the west (Fig. 1). The RR may have undergone flexural subsidence in front of these active orogenic systems that would imply the burial of the RR and heating. Such a scenario is in agreement with our FT data at the end of the Carboniferous, but challenges the ‘classical' scenario of a Late Carboniferous exhumation of the RR (Bertrand-Sarfati et al. Reference Bertrand-Sarfati, Moussine-Pouchkine, Affaton, Trompette, Bellion, Dallmeyer and Lécorché1991; Haddoum, Guiraud & Moussine-Pouchkine, Reference Haddoum, Guiraud and Moussine-Pouchkine2001; Guiraud et al. Reference Guiraud, Bosworth, Thierry and Delplanque2005), which mainly relies on the unconformity between the Carboniferous and Mesozoic–Cenozoic strata in the Tindouf Basin. The base of the Lower Cretaceous series in the Tindouf Basin, though poorly dated, confirms the existence of a huge hiatus between the Late Carboniferous and the Late Jurassic (i.e. from ~300 to ~150 Ma). Precise dating of the erosion events is then not possible. Moreover, a Variscan exhumation of the basement should have generated clastic sediments which do not exist or are not preserved in the neighbouring basins.
The existence of an ‘arch-and-basin’ structure already acquired at the end of Palaeozoic times is therefore uncertain, for the specific case of the RR. Cambrian–Ordovician and Upper Devonian configurations might have contributed to an early structuring of the RR, although the main episode could have occurred later.
5.b. Mesozoic scenario
The main result of model 2 (Fig. 5) is the indication of an Upper Jurassic/Lower Cretaceous cooling event. We will discuss the key arguments supporting this scenario, namely: (i) a dramatic facies transition from carbonate to clastic facies at the Jurassic–Cretaceous boundary on the Atlantic margin in the Tarfaya Basin, and (ii) the origin of these clastic deposits.
Lower Cretaceous sediments are represented by large amounts of ‘Continental Intercalaire’ (Killian, Reference Killian1931) on the Saharan Platform (Guiraud et al. Reference Guiraud, Bosworth, Thierry and Delplanque2005). These deposits are considered to be Late Jurassic to Early Cretaceous in age (Furon, Reference Furon1956), and are of detrital continental facies (red clays, sandstones and conglomerates). First defined in the northern Touareg Shield (Fig. 1a), they largely crop out in the Taoudeni Basin (Fig. 1b). Lateral equivalents occur in the Tindouf (Fabre, Reference Fabre2005, p. 428), and Tarfaya basins (Choubert, Faure-Muret & Hottinger, Reference Choubert, Faure-Muret and Hottinger1966). A large part of the offshore Lower Cretaceous sediments on the Atlantic margin in the Tarfaya Basin rests unconformably on the Upper Jurassic/Lower–Middle Berriasian limestones of the margin platform (P. LeRoy, unpub. Ph.D. thesis, Univ. Bretagne Occidentale, 1997). The Lower Cretaceous deposits in the Tarfaya Basin were deposited in a deltaic environment (Choubert, Faure-Muret & Hottinger, Reference Choubert, Faure-Muret and Hottinger1966; Martinis & Visintin, Reference Martinis, Visintin and Reyre1966; Einsele & von Rad, Reference Einsele, von Rad, von, Ryan, Arthur, Čepek, Cita, Cornford, Garifal, Hamilton, Lopatin, Lutze, McCoy, Mountain, Sarnthein, Weser, Whelan and Wind1979), and can reach at least 2 km in thickness. They cut into the Tithonian and the Lower Berriasian carbonate platform (Abou Ali, Chellaie & Nahim, Reference Abou Ali, Chellaie and Nahim2004). Moreover, stratigraphic correlations between wells (P. LeRoy, unpub. Ph.D. thesis, Univ. Bretagne Occidentale, 1997; Gouiza, Reference Gouiza2011) suggest a Late Berriasian/Early Valanginian to Barremian age for the base of the Lower Cretaceous succession. These stratigraphic ages are fundamental to characterizing the dynamics of the area, but data remain local and are difficult to extrapolate. Eastward in the onshore basin, the Lower Cretaceous deposits lie directly on the Reguibat basement (Fig. 1b). Moreover, in the southern part of the Zemmour (Fig. 1b), sedimentary studies on the Tan Tan Formation (Martinis & Visintin, Reference Martinis, Visintin and Reyre1966) identify an unconformity marked by a basal conglomerate followed by alternating clays, sandstones, gypseous and sandy marls, with few sandy limestone layers. The basal conglomerate and, indeed, the entire succession are poorly dated. In the Tan Tan area, the sequence is close to 1 km thick (Martinis & Visintin, Reference Martinis, Visintin and Reyre1966), but it thins towards the Reguibat Shield.
The basal conglomerate of the Tan Tan Formation contains pebbles of sedimentary rocks, typical of the Palaeozoic cover of the region (Martinis & Visintin, Reference Martinis, Visintin and Reyre1966), attesting that the Lower Cretaceous clastic rocks could be sourced from the erosion of the Palaeozoic cover that likely still existed over the RR during the Late Jurassic – Early Cretaceous. Our type cross-section (Fig. 3c) based on the thicknesses of the Upper Palaeozoic in the Taoudeni and Tindouf basins, suggests that a significant thickness of Palaeozoic cover probably still existed at that time on the RR. It provides a minimum thickness of 1.5–2 km for the Late Palaeozoic, which could be sufficient to explain the source of such huge deltaic systems on the Atlantic margin. Finally, the Leg 47 of the Ocean Drilling Project (well 397, 26°50.7′N; 15°10.8′W), offshore of the Moroccan margin, adds further constraints on the origin of the sediments. Some of the Lower Cretaceous levels drilled during this leg contain heavy minerals, such as garnet, which could have only been derived from a Precambrian basement source (Einsele & von Rad, Reference Einsele, von Rad, von, Ryan, Arthur, Čepek, Cita, Cornford, Garifal, Hamilton, Lopatin, Lutze, McCoy, Mountain, Sarnthein, Weser, Whelan and Wind1979), after the erosion of the Palaeozoic cover. Moreover, a recent provenance analysis for the Lower Cretaceous clastic rocks (Ali, Reference Ali2012), based on zircon ages, shows an Archaean signature, which could only come from the western Reguibat basement, since the oldest rocks in the Anti-Atlas belt are Proterozoic in age.
At a larger scale, the volume of detrital sediments deposited during the Mesozoic has been estimated on the West African margin by Helm (Reference Helm2009), who showed a significant increase during the initial stages of the Early Cretaceous followed by a decrease in the Late Cretaceous. Erosion of old basement could have occurred not only on the RR but also from Precambrian inliers in the Anti-Atlas (Gouiza, Reference Gouiza2011; Sehrt et al. Reference Sehrt, Glasmacher, Stockli, Kluth and Jabour2012). The RR is, however, likely to be the dominant source for these clastic rocks and might testify to a rapid uplift of the RR, quickly exhuming the basement after erosion of the Palaeozoic cover.
Overall, the unconformity associated with the sharp facies transition between the Jurassic carbonate platform and the widespread deltaic complex, coupled to the evidence of Palaeozoic cover erosion, the likely origin of the sediments and our new thermochronological data, indicates that a major exhumation event occurred during the Late Jurassic/Early Cretaceous.
5.c. Consequences
5.c.1. Timing
Modelling gives us a consistent panel of time–temperature paths to estimate the timing of this Late Jurassic – Early Cretaceous event. We consider a time interval of about 50 Ma during which the temperature dropped from 100–120°C to 20–40°C resulting from strong uplift and erosion of the RR. However, the timing of the huge amount of detrital sediments created by this erosion is still problematic. As we already noted, the sharp transition occurs regionally between Upper Jurassic carbonates and Lower Cretaceous sandstones, though small pulses of clastic sedimentation are locally recorded in the Late Jurassic (Abou Ali, Chellaie & Nahim, Reference Abou Ali, Chellaie and Nahim2004). We have to put together (1) the sharp transition from carbonate platform to deltaic environment and (2) the tremendous detrital input during the Early Cretaceous. These observations are not consistent with our modelling data, which suggest that continuous cooling starting at the end of the Jurassic and continued through the Early Cretaceous. How can we explain the delay of this detrital input? Given that samples were taken at similar elevations (Table 1), challenging the rate of exhumation with our thermochronological data is not possible (Braun, Reference Braun2002). We propose that the detrital flux was triggered when a sufficient relief was established. The fact that very few transitional facies are recorded can be attributed to a reworking of the earliest deposits. The continuous cooling during a few million years would lead us to expect important sediment accumulations, but the occurrence of basal conglomerates in the Lower Cretaceous level makes a slow and long-term uplift problematic. Indeed, the existence of these conglomerates suggests a quite dramatic beginning to the depositional phase.
Eustatic variations during Mesozoic times provide an alternative hypothesis: from the Late Jurassic to the Late Cretaceous, sea-level was mainly rising up, punctuated by occasional lowstand events in the Lower Cretaceous (Haq, Hardenbol & Vail, Reference Haq, Hardenbol and Vail1987; Miller et al. Reference Miller, Kominz, Browning, Wright, Mountain, Katz, Sugarman, Cramer, Christie-Blick and Pekar2005). The WAC Atlantic margin recorded this rise in sea-level during the Late Jurassic in the ongoing aggradation of the platform, whereas at the same time, exhumation of the RR is thought to have begun: the rising sea-level was partly counteracted by the exhumation. There was an abrupt fall in sea-level at the beginning of the Early Cretaceous (Haq, Hardenbol & Vail, Reference Haq, Hardenbol and Vail1987) while exhumation was continuing. The coupling of these two events could be responsible for triggering the massive detrital input in the earliest stages of the Early Cretaceous, which then progressively decreased until the Aptian (Helm, Reference Helm2009).
5.c.2. Correlations with Mesozoic geodynamic events
During the Late Jurassic and the Early Cretaceous, Africa was moving eastwards with respect to Europe, surrounded by ocean ridges (Guiraud et al. Reference Guiraud, Bosworth, Thierry and Delplanque2005). The Early Cretaceous is characterized by a period of generalized uplift in northwest Africa. The Anti-Atlas (Ruiz et al. Reference Ruiz, Sebti, Negro, Saddiqi, Frizon de Lamotte, Stockli, Foeken, Stuart, Barbarand and Schaer2011; Oukassou et al. Reference Oukassou, Saddiqi, Barbarand, Sebti, Baidder and Michard2013) as well as the Atlantic margin (Gouiza, Reference Gouiza2011; Sehrt et al. Reference Sehrt, Glasmacher, Stockli, Kluth and Jabour2012) and the Mesetas in central Morocco (Ghorbal et al. Reference Ghorbal, Bertotti, Foeken and Andriessen2008; Frizon de Lamotte et al. Reference Frizon de Lamotte, Leturmy, Missenard, Khomsi, Ruiz, Saddiqi, Guillocheau and Michard2009; Saddiqi et al. Reference Saddiqi, El Haimer, Michard, Barbarand, Ruiz, Mansour, Leturmy and Frizon de Lamotte2009; Bertotti & Gouiza, Reference Bertotti and Gouiza2012) all underwent important uplift with significant (kilometre-scale) exhumation, the origin of which is still debated.
The close location of the rift shoulder of the Central Atlantic could seemingly explain the uplift, although the rifting is much older than the Early Cretaceous for this segment of the Atlantic, i.e. Late Triassic to Early Jurassic in age (Sahabi, Aslanian & Olivet, Reference Sahabi, Aslanian and Olivet2004; Labails et al. Reference Labails, Olivet, Aslanian and Roest2010). Then, significant deformations affected the eastern boundary of the WAC at the end of the Early Cretaceous (110 Ma), known as the Austrian phase (Boudjema, Reference Boudjema1987). This phase corresponds to an E–W shortening and is expressed by folds with N–S axes in the Sahara basins but has not yet been recognized in the WAC. Contemporaneously with this tectonic activity, sporadic alkaline igneous activity occurred on peri-Atlantic continental margins such as the Richat structure close to the Reguibat Shield (Fig. 1b; Matton & Jébrak, Reference Matton and Jébrak2009). Finally, the convergence between Europe and Africa began later during the Santonian, and is recorded by frequent hiatuses or unconformities in the Atlas system (Frizon de Lamotte et al. Reference Frizon de Lamotte, Leturmy, Missenard, Khomsi, Ruiz, Saddiqi, Guillocheau and Michard2009) and compressional structures with inversion around the WAC, for example in Benue (Nigeria) (Guiraud & Bosworth, Reference Guiraud and Bosworth1997; Rosenbaum, Lister & Duboz, Reference Rosenbaum, Lister and Duboz2002; Guiraud et al. Reference Guiraud, Bosworth, Thierry and Delplanque2005).
The Lower Cretaceous event proposed in this study occurs during a ‘quiescent’ period, so a new mechanism is required to account for this regional uplift. Shallow-seated thermal mantle processes, such as edge-driven convection (Missenard & Cadoux, Reference Missenard and Cadoux2012), could be responsible for this kind of event, or deeper mantle processes, generating dynamic topography (Braun, Reference Braun2010; Flowers et al. Reference Flowers, Ault, Kelley, Zhang and Zhong2012).
6. Conclusions
The first low-temperature thermochronology data were produced on basement rocks of the central RR. We compare two possible scenarios for the uplift of the shield: (1) slow and regular cooling during the Meso-Cenozoic and (2) rapid cooling between the Late Jurassic – Early Cretaceous. Published geological constraints, a new geometry for the southern flank of the Tindouf Basin built from surfacing of Upper Palaeozoic layers and our FT results imply that a major event occurred during Meso-Cenozoic times, and specifically at the Jurassic/Cretaceous transition. In this scenario, we assume that Upper Carboniferous Variscan events cannot account for the present basin-and-arch architecture.
The pre-Variscan history is still poorly constrained. Indeed, an earlier structuring of the RR is also possible during the Cambrian–Ordovician as well as the Late Devonian. However, the Late Palaeozoic is characterized by temperatures above 110°C which are thought to result from the deposition of a thick sedimentary cover over the RR.
We identify a major denudation event of the basement during the Early Cretaceous, which is the visible effect of an uplift probably triggered a few million years earlier, the mechanism of which remains to be ascertained. This Early Cretaceous event fed a huge palaeodelta, mainly transporting the eroding cover of the basement of the Reguibat Shield towards the Central Atlantic.
The northern WAC could be thoroughly affected by this event, as it affects both the Atlantic Moroccan margin and the Anti-Atlas bounding the craton (Gouiza, Reference Gouiza2011; Oukassou et al. Reference Oukassou, Saddiqi, Barbarand, Sebti, Baidder and Michard2013).
Acknowledgements
We would like to thanks D. Lahondère, D. Thieblemont (BRGM) for providing us with the samples used in thermochronology analysis, and Rosella Pinna for the processing of (U–Th)/He samples.