
I. INTRODUCTION
In 1990s, the research community began to focus their attention on the research and development of ‘spin’ and ‘charge’ of the electrons. The control over these two degrees of freedom is essential for the realization of devices with exceptional functionalities known as ‘Spintronic’ devices. Spintronic, the combination of spin & electronics, is the technology where spin can be used to transform reading and writing information rather than electronic charge. Reference Ohno1,Reference Ohno2 Currently, the research is actively focusing on spintronic devices like spin transistors, spin light emitting diodes, spin valves etc. Reference Wolf, Awschalom, Buhrman, Daughton, von Molnar, Roukes, Chtchelkanova and Treger3 due to their potential advantages over charge-based electronics. For the realization of these devices, scientists investigated dilute magnetic semiconductors (DMSs) where they can easily manipulate the charge and spin of electrons. The initial studies on III–V semiconductors doped with Mn such as InMnAs Reference Ohno, Munekata, Penney, von Molnar and Chang4 and GaMnAs Reference Ohno1,Reference Ohno2 offered promising future for controlling spin and charge. But low Curie temperature (120 K) of these semiconductors, posed a hindrance in the scope of their applications. Theoretically, it was proposed that ZnO could be a strong contestant in the field of DMSs, if it can be doped by Mn dopants. Reference Dietl, Ohno, Matsukura, Cibert and Ferrand5 It is easy to dope for higher percentages in II–VI type semiconductors as compare to III–V semiconductors.
ZnO is a marvelous material, hugely used in various applications such as UV coatings, Reference Gao, Gereige, El Labban, Cha, Isimjan and Beaujuge6 gas sensors, Reference Menner, Dimmler, Mauch and Shock7 flat panel displays, Reference Z-Xian, Tai-Liang, Li-Qin, Liang, Jing-Jing, Chun-Jian, Yong-Ai and Ke-Lu8 and solar cells Reference Repins, Contreras, Egaas, DeHart, Scharf, Perkins, To and Noufi9 to name a few. ZnO is known to be an n-type semiconductor, Reference Zhang, Wei and Zunger10 but its co-doping makes it a p-type. Reference Joseph, Tababta and Kawai11 It will be possible to develop transparent functionally harmonized devices only by using ZnO based materials with ferromagnetic signature at room temperature. Reference Saeki, Tabata and Kawai12 ZnO, a wide band gap semiconductor, show a change in band gap when doped with transition metals and also exhibit ferromagnetic character due to exchange interactions between magnetic dopants and the ZnO lattice. Theoretical reports show a potential for vanadium doped ZnO as a dilute magnetic semiconductor Reference Sato and Yoshida13 but experimentally not much attention was paid to its research. Reference Maensiri, Masingboon, Promarak and Seraphin14
In the present work, vanadium doping is selected on the basis of theoretical predictions, where ZnO doped with 3d transition metals show ferromagnetism above room temperature. We conducted a detailed study of bulk vanadium doped ZnO system. Reference Karamat, Rawat, Lee, Tan, Ramanujan and Zhou15 Here, we study the growth of thin films using pulsed laser deposition (PLD) exhibiting ferromagnetic signature. From device fabrication point of view it is desirable that thin films should be highly crystalline. PLD is an adequate growth technique to grow highly crystalline ZnO thin films, Reference Lorenz, Kaidashev, von Wenckstern, Riede, Bundesmann, Spemann, Benndorf, Hochmuth, Rahm, Semmelhack and Grundmann16 and is also well known to reproduce the stoichiometric ratios of target material into thin films which is important in DMSs thin films. It is important to develop good understanding about different features of vanadium doped ZnO system such as different phase formation, ferromagnetic signature, and change in ZnO lattice due to vanadium dopants and variation in optical band gap.
II. EXPERIMENTS
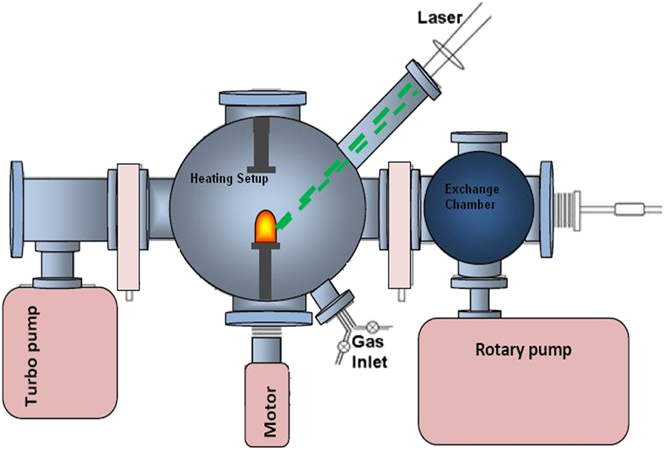
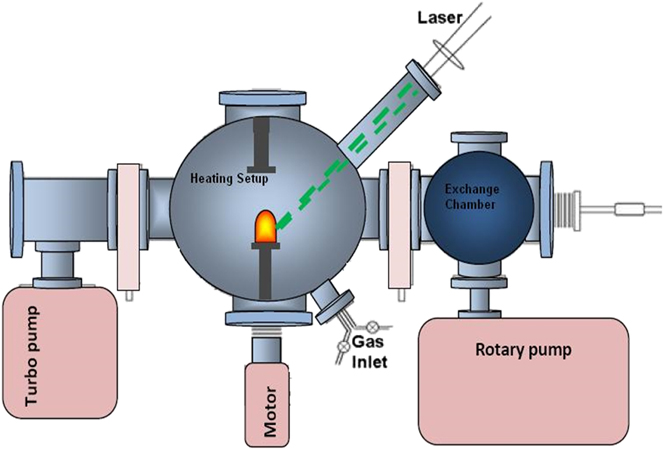
Vanadium doped ZnO bulk samples where vanadium percentage is 2, 3, and 5%, are used to grow thin films by PLD. Nd:YAG laser (λ = 532 nm) having 10 Hz repetition rate is used for a constant duration of 1 h to ablate vanadium doped ZnO targets. During growth, oxygen (99.999% purity) partial pressure is maintained at 2 × 10⁻² mbar inside the chamber, and thin films are grown at 750 °C substrate temperature. PLD system for thin film growth is represented in Fig. 1.
Schematic of the experimental set-up for thin film growth.
The structural information of thin films is carried out by using a SIEMENS D5005 X-ray diffractometer (Bruker Corporation, Billerica, Massachusetts) with Cu Kα radiation. The compositional percentage of Zn, O, and V, are estimated by x-ray photoelectron spectroscopy (XPS) with Kratos Axis-Ultra spectrometer (Kratos Analytical, Manchester, United Kingdom). Magnetic measurements are carried out by means of a Quantum Design Physical Properties Measuring System (PPMS), under applied magnetic field of 15,000 Oe at room temperature. PL spectroscopy of these films is conducted using 325 nm He–Cd laser line to improve our understanding about different emissions at low temperature.
III. RESULTS AND DISCUSSIONS
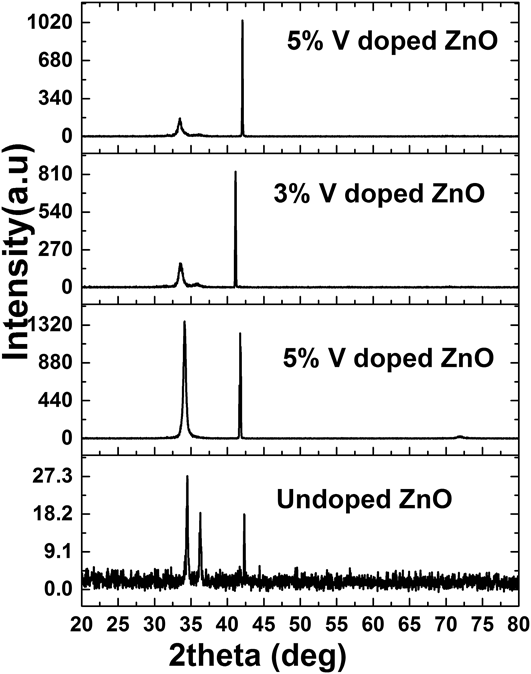
Figure 2 shows XRD patterns for vanadium doped ZnO films deposited at 750 °C, on sapphire substrates using Nd:YAG laser for 1 h (36,000 shots). The diffraction analysis confirms the existence of well crystallized wurtzite phase in all films. In case of 2% vanadium doped ZnO thin film, a strong peak of (002) diffraction plane of wurtzite ZnO is seen at 34.13° (Fig. 2) with its replica peak of (004) plane around 72.5°. For other cases, besides a strong (002) peak, an additional weak peak of (101) ZnO diffraction plane at 36.5° is also observed for 3 and 5% vanadium doped ZnO thin films which represents growth in other orientation due to increase in doping percentage and films are shifting from epitaxial growth toward polycrystalline. It is a well-established fact that different properties (optical & electrical) of ZnO thin films can be controlled by interplaying between their microstructures, epitaxy, and the strain level. Reference Choi, Tabata and Kawai17 Moreover, the initial stage of growth plays an important role in the orientation of the film on the substrate. Hayamizu et al. Reference Hayamizu, Tabata, Tanaka and Kawai18 reported that the ZnO films grown by PLD on amorphous substrates, change gradually with the thickness; (i) amorphous layer (5 nm), (ii) polycrystal layer (5–10 nm), and (iii) c-axis-oriented layer (>10 nm) but other study shows the absence of polycrystalline layer and observed a c-axis oriented layer on top of the amorphous layer. Reference Choi, Tabata and Kawai17 It is also observed that the (002) phase of ZnO grow directly to Si substrates without any amorphous and polycrystalline layer. Reference Hayamizu, Tabata, Tanaka and Kawai18 The reason for the (002) orientation of ZnO thin film during initial stage of growth on Si, glass, and Al2O3 substrates is due to energy minimization along a particular orientation. ZnO naturally has a strong ionic bonding like ionic compounds (NaCl) and c-axis oriented film is formed independently during energetically stable deposition. The (002) plane of wurtzite ZnO has lowest density of surface energy according to Fujimura calculations, and this minimization of surface energy facilitates the (002) texture in ZnO films during initial stages of growth. Reference Fujimura, Nishibara, Goto, Xu and Ito19
XRD spectra for thin films grown in oxygen ambient pressures at 750 °C.

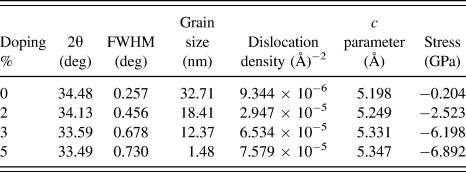
In our case, the diffraction peak of undoped ZnO thin film deposited under same conditions appears at 2θ = 34.48° along (002) plane. A careful analysis of this diffraction plane for vanadium doped ZnO thin films show a monotonic shift in the peak position toward the lower angles with increase in doping percentage, as shown in Table I. The variation in 2θ value, might be due to tensile stress caused by the bigger ionic radius of the doping atom.
Structural parameters for thin films grown in oxygen environment.

V2+ has ionic radius of 0.93 Å in tetrahedral coordination while Zn2+ ion has 74 Å, Reference Shannon20 ionic radius is not a constant quantity due to its dependence on the ion electric charge which varies in different coordination. For example, when an electron escaped from the electron cloud of its atom, the remaining electrons attracted more toward the nucleus which decreases the ionic radius. Similarly when an electron is added to the electron cloud of atom, the attraction of the electrons reduces from the nucleus which increases the atom radius. Ionic radius also varies for the different (high and low) spin states of the atom. If V2+ ion of greater ionic radius substitutes Zn2+ in ZnO structure as there is no charge mismatch and ionic radii are not very dissimilar then the XRD peaks will shift toward the lower angles. Ionic radii of bigger size upon substitution causes increase in d spacing of lattice site. Reference Karamat, Mahmood, Lin, Pan, Lee, Tan, Springham, Ramanujan and Rawat21,Reference Lovchinov, Angelov, Nichev, Mikli and Dimova-Malinovska22 For smaller ionic radii like V4+, settlement in interstices of ZnO is dominant instead of substitution of Zn2+. Ideally, when V4+ move into the interstitial sites, the surrounding atoms are impelled because their size is greater than interstitial sites. It stretches the lattice which results in an increase in the interplaner distance and again peak shift toward the lower angles due to increased d spacing. Reference Karamat, Mahmood, Lin, Pan, Lee, Tan, Springham, Ramanujan and Rawat21
Our previous work on the bulk targets of vanadium doped ZnO confirm the presence of V2+ and V4+ valence state of ions. The same bulk targets were utilized as a source material to grow thin films by PLD. It is worth to mention that PLD is well known to maintain the stoichiometry of the source material into the deposited material which support the presence of V2+ and V4+ valence state of ions in thin films. Further presence of +2 and +4 valence state was confirmed by XPS spectrum of thin films.
The full-width half-maximum value calculated from x-ray (002) peak shows an increase with the increasing doping percentage which suggests a decrease in crystalline quality of the thin films due to doping. For structural information, the grain/particle size (D) is calculated using Scherrer's formula, and the dislocation density (δ) for preferential orientations is calculated using the formulas given below Reference Repins, Contreras, Egaas, DeHart, Scharf, Perkins, To and Noufi9–Reference Saeki, Tabata and Kawai12 :
 $$D = {{0.9\lambda } \mathord{\left/ {\vphantom {{0.9\lambda } {\beta \,\cos \,\theta \;\;{\rm{and}}}}} \right. \kern-\nulldelimiterspace} {\beta \,\cos \,\theta \;\;{\rm{and}}}}$$
 $$\delta = {1 \mathord{\left/ {\vphantom {1 {{D^2}}}} \right. \kern-\nulldelimiterspace} {{D^2}}}\quad .$$
The higher values of dislocation density supports lower crystallinity levels in doped thin films; dislocation density represents the quantity of defects. Structural parameters such as (FWHM, B), grain size, dislocation density, and c lattice parameter values for (002) in all films are given in Table I.
The decrease of grain size, especially with the increase in vanadium incorporation in ZnO, highlights an increase in the grain boundaries and the decrease in crystallinity level of vanadium doped zinc oxide films compared to the ZnO thin film grown under same conditions, shown in Table I. Also with the increase in vanadium doping percentage, the dislocation density shows an increasing trend in its value which supports lower crystalline levels of thin films due to dislocation defects. The increase in lattice parameter c derived from the (002) diffraction peak and the broadening in FWHM value with the increase in vanadium doping suggests incorporation of vanadium ions in ZnO lattice which deteriorate the ZnO crystallinity. The decrease in the average crystallite size also indicates vanadium ion substitution of greater ionic radius in ZnO lattice with increased d spacing which affects the crystalline quality of the doped thin films.
The lattice constant c for vanadium doped ZnO thin films is calculated from the 2θ values, and compared to the undoped ZnO thin film and with the standard value of c parameter for the bulk ZnO which is, c = 5.2049 Å given in standard XRD PDF #01-070-8070. The c parameter value for ZnO thin film is 5.19815 Å. The c parameter for vanadium doped ZnO thin films show the difference of 0.0067, 0.049, 0.12, and 0.14 Å, from the standard value of c for 0, 2, 3, and 5% vanadium doped ZnO thin films, respectively. Further, by comparing with ZnO thin film lattice parameter (c = 5.19815 Å), the vanadium doped ZnO thin films show a difference of 0.05, 0.13, and 0.14 Å for 2, 3, and 5% doping, respectively. The residual stresses in deposited thin films are calculated from the lattice parameter of the film by using the following equation Reference Wang, Lau, Lee, Yu, Tay, Zhang, Tse and Hng23 :
 $$\sigma = {{2C_{13}^2 - {C_{33}}\left( {{C_{11}} + {C_{12}}} \right)} \over {2{C_{13}}}}{{d - {d_{\rm{o}}}} \over {{d_{\rm{o}}}}}\quad ,$$
where d is the crystallite plane spacing in thin films, and d o (2.6033 Å) is the standard plane spacing from XRD. Reference Wang, Meng, Teixeir, Song, Xu and Xu24 We use the elastic constant values of single crystalline ZnO; c 11 = 208.8 GPa, c 33 = 213.8 GPa, c 12 = 119.7 GPa, and c 13 = 104.2 GPa. Reference Wang, Meng, Teixeir, Song, Xu and Xu24 After substitution of elastic constants values in the above equation, it reduces to the following form:
 $$\sigma = - 233{{d - {d_{\rm{o}}}} \over {{d_{\rm{o}}}}}\quad .$$
The values of residual stresses shown in Table I, for thin films are negative which indicate the presence of compressive stress. The increasing trend in the values of residual stress with the increase in vanadium doping is due to the presence of interstitial defects and the vanadium ions substitution in ZnO lattice site, which causes stress in the doped thin films. Reference Wang, Meng, Teixeir, Song, Xu and Xu24
Another interesting information about the quality of the films is obtained from PL measurements.
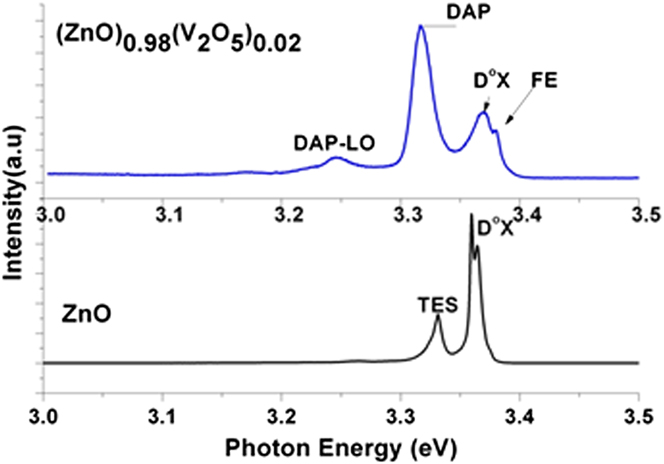
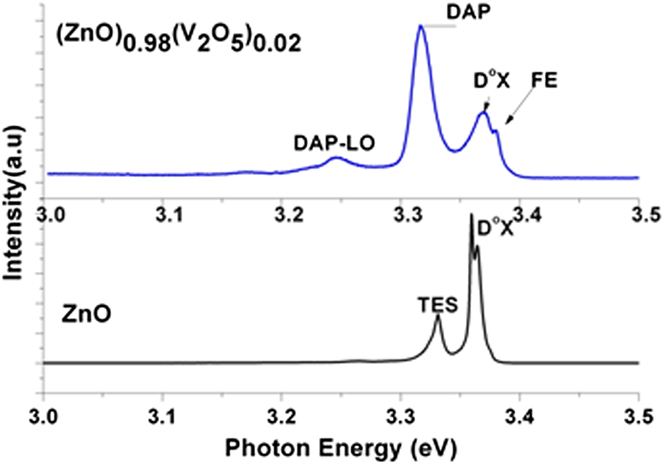
Figure 3 shows low-temperature PL spectra of ZnO and 2% vanadium doped ZnO thin films. For undoped ZnO film two peaks appear at 3.357 and 3.312 eV. The emission line appearing at 3.36 eV is the luminescence of a neutral donor bound exciton (DoX) complex, while the other peak appeared at 3.33 eV represents two-electron satellite (TES) recombination line of the DoX, the energy difference between them is about 30 meV already reported in literature. Reference Wang, Elamurugu, Sallet, Jomard, Lusson, Botelho do Rego, Barquinha, Goncalves, Martins and Fortunato25 Vanadium doped ZnO thin films show weak donor bound exciton (DoX) emissions around 3.36 eV followed by FE emissions at 3.37 eV toward higher energy side of spectrum. We clearly seen PL emission peak at 3.30 eV, which usually appear due to FA (acceptor-related transitions such as free electron to neutral acceptor) transitions and donor-acceptor-pair (DAP). Reference Park, Minegishi, Oh, Lee, Taishi, Park, Jung, Chang, Im, Ha, Hong, Yonenaga, Chikyow and Yao26 The emission at 3.30 eV is similar to emissions often observed in p-type doped ZnO. This support the magnetic behavior in vanadium doped ZnO thin films.
Comparison of the low temperature (10 K) PL spectra of the ZnVO and ZnO thin film samples grown at 2 × 10⁻² mbar ambient O2 gas pressure.
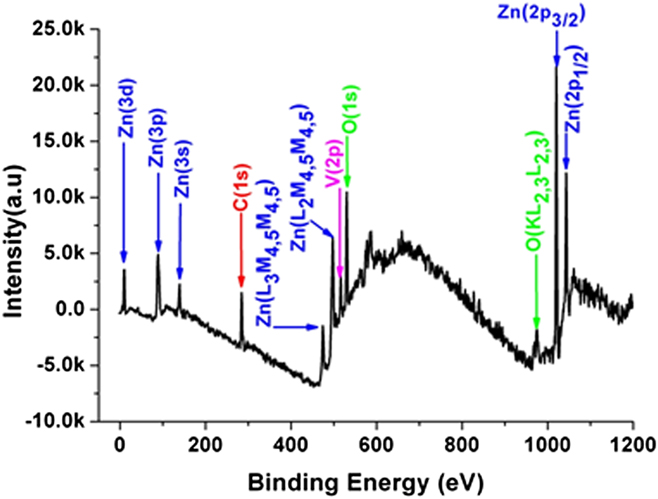
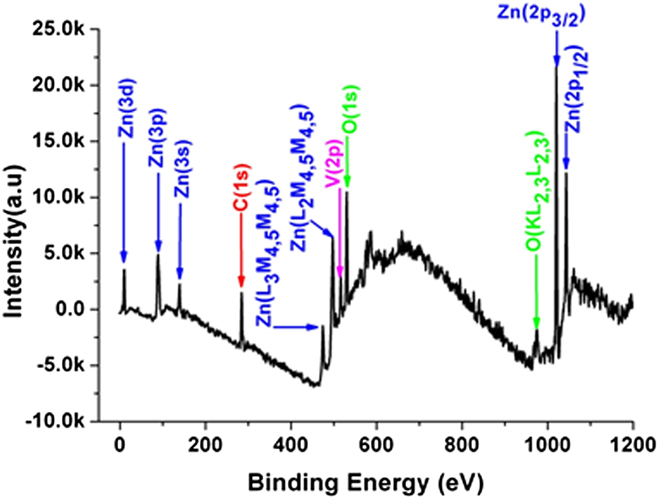
The elemental composition and the valence state of ions at the surface of vanadium doped ZnO thin film samples are characterized using core level spectra in XPS. The survey spectrum in Fig. 4, shows the necessary elements such as C 1s (284.6 eV), O 1s (531 eV), V 2p (515 eV), Zn 2p 3/2 (1021 eV), and Zn 2p 1/2 (1043 eV).
XPS survey scan for thin film sample.
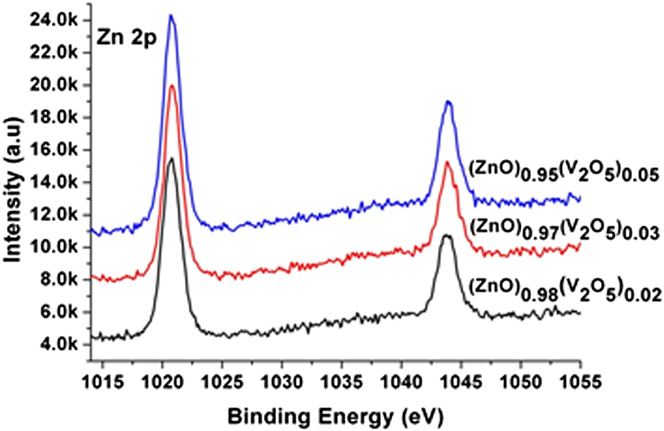
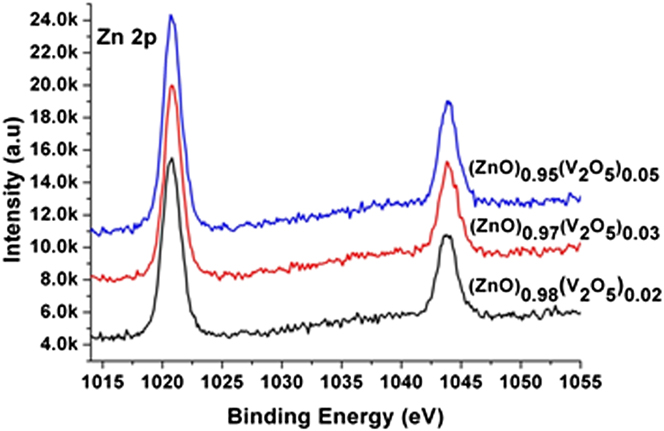
The spectra of Zn 2p core peaks for vanadium doped ZnO thin film samples show symmetrical trend in binding energy for all doping percentages, as shown in Fig. 5. Zn 2p 3/2 core peaks for all samples show binding energy value around 1020.80 eV. There is a difference of 0.6 eV between the binding energy of our samples and the reported value of ZnO (1021.4 eV).27 The slightest shift in the binding energy toward the lower energy side can be explained due to the possible complex bonding of vanadium ions with ZnO bonds.
Zn 2p core level spectra for vanadium doped ZnO thin films.
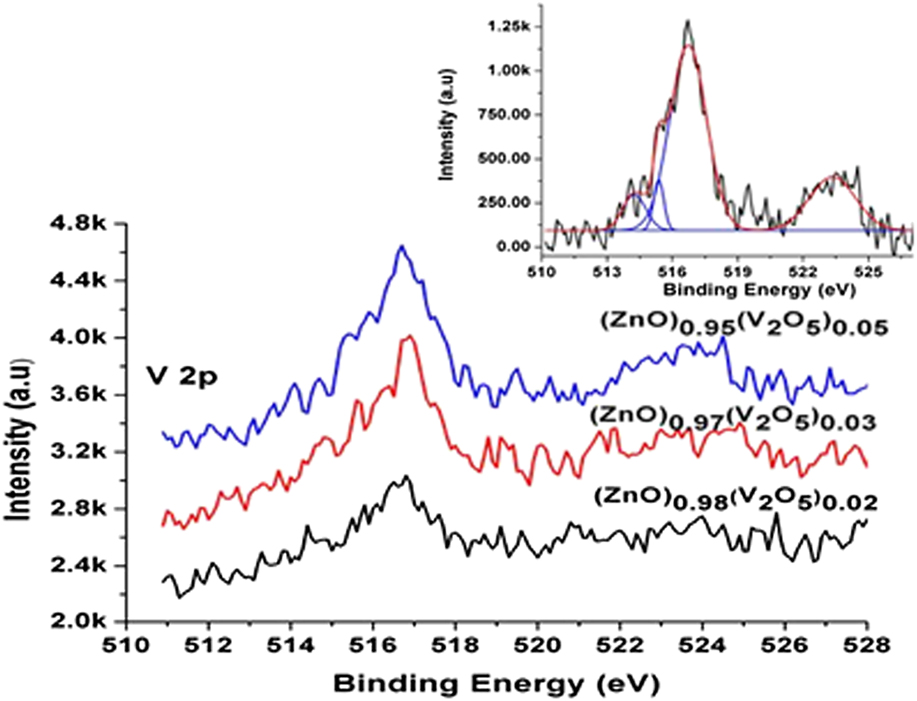
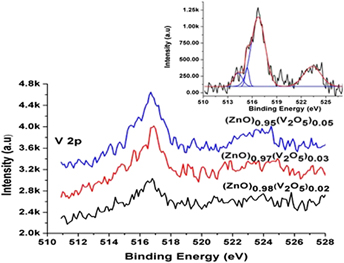
With the increase in doping concentrations, the intensity of V 2p core peaks increases, as shown in Fig. 6. Here, we use V 2p 3/2 core peak for data analysis after the background subtraction using Shirley function. A broader V 2p 3/2 binding energy peak appears around 516.6 ± 0.2 eV, for different vanadium dopings and show a slight symmetrical behavior. V 2p 3/2 peaks appearing around 516.7 eV are in good agreement with the reported binding energies of V4+ in our bulk samples. Reference Karamat, Rawat, Lee, Tan, Ramanujan and Zhou15 The shift in the values of binding energy indicate the presence of different oxidation states. The broader V 2p 3/2 peaks for 2, 3, and 5% vanadium doped ZnO samples indicate the existence of more than one oxidation states. To confirm the oxidation states, we deconvoluted all the vanadium peaks of doped samples as shown in the supporting information. The deconvoluted V 2p core peak of 5% doped thin film sample is shown in the inset of Fig. 6. Almost same peak fitting trend is observed for all other samples. The core peak spectrum is fitted using four Gaussian peaks at binding energies of 514.2, 515.3, 516.7, and 523.35 eV with the first three peaks corresponding to V 2p 3/2 and the last peak to V 2p 1/2. The peaks at 514.2 eV indicate the presence of V2+ ions (+2 oxidation state), whereas the peaks at higher BE side at 515.3 and 516.7 eV support the presence of V4+ valence state. Hence, from the XPS results, it is clear that in PLD deposited thin film samples have V2+ and V4+ oxidation states of vanadium.
Vanadium core peak spectra for thin films. Inset shows the deconvoluted V 2p core peak of 5% doped thin film sample.
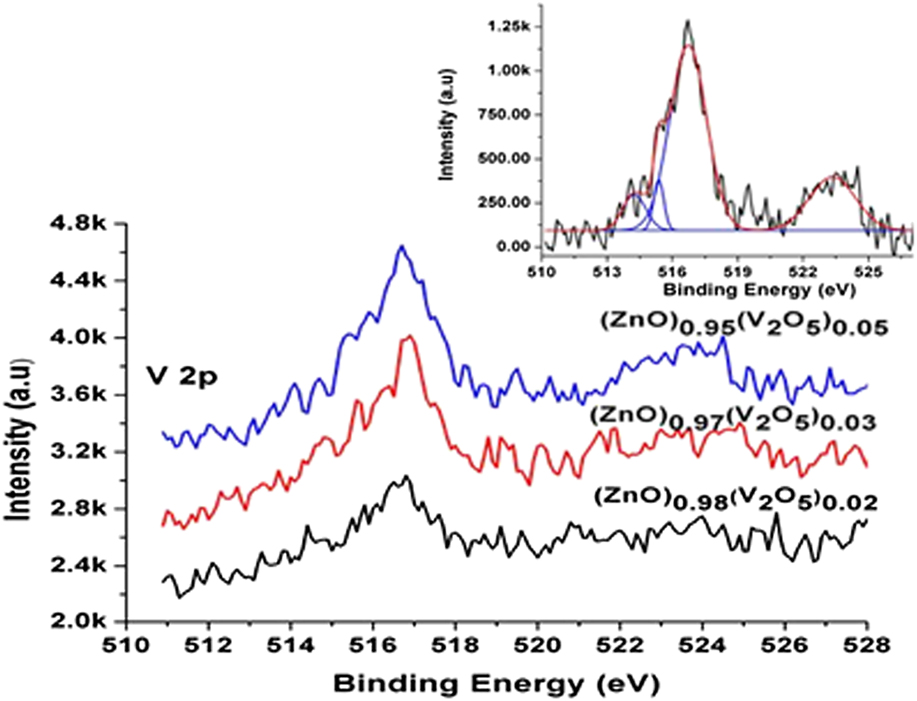
The presence of V2+ and V4+ valence state agree with the XRD and PL results and support the formation of vanadium doped ZnO phase, highly desirable in DMS is formed in thin film samples.
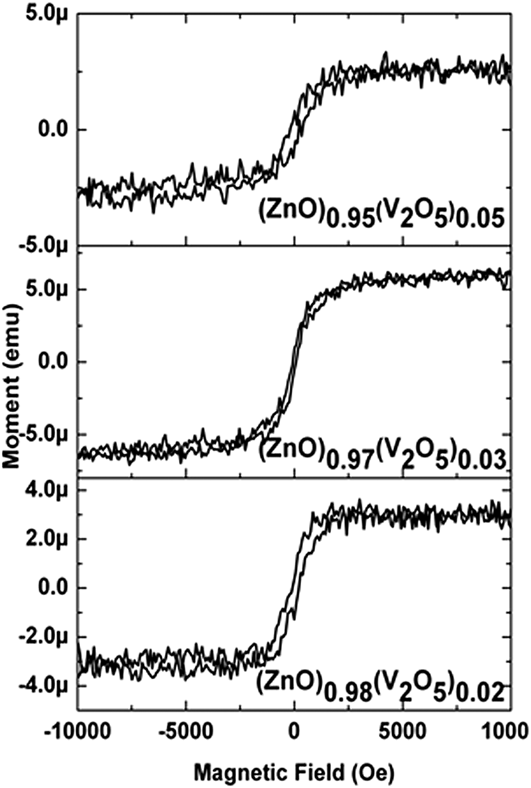
The magnetic characterization at room temperature shows a weakly expressed ferromagnetic ordering in thin films represented in Fig. 7. With the increase in doping percentage a slight increase in magnetic moment is observed. Most probably, the source of ferromagnetism in vanadium doped ZnO system, is the carrier induced ferromagnetism (RKKY or double exchange mechanism) that is often reported in III–V semiconductors. Reference Saeki, Tabata and Kawai12,Reference Karamat, Rawat, Lee, Tan, Ramanujan and Zhou15 The other possible sources of magnetism in vanadium doped ZnO system are vanadium clusters, vanadium oxide, or zinc vanadium oxide spinel phases. Few phases like VO2, V2O3, V6O13, and ZnV2O4 are anti-ferromagnetic. Reference Karamat, Rawat, Lee, Tan, Ramanujan and Zhou15 However, these phases cannot be the sources of magnetism in our samples as no extra/impurity vanadium phase, except vanadium doped ZnO, was observed in the XRD of the thin film samples. In addition, the lattice constant (c-axis) systematically increases with increase in vanadium content, shown in Table I, which suggests the incorporation of vanadium into ZnO lattice without changing the wurtzite structure. The XPS analysis showed the presence of V2+ ions in thin film samples which also suggests that the vanadium ions substituted the Zn as +2 ions without changing the wurtzite structure. Hence, the most likely reason for the ferromagnetism in vanadium doped ZnO thin film samples is the carrier induced ferromagnetism.
Hysteresis curves for (ZnO)1−x (V2O5) x ≤ 0.05 thin films.

IV. CONCLUSIONS
The present work reports about the growth of vanadium doped ZnO thin film samples on sapphire substrates in oxygen ambience. The preferred orientation appears along the (002) plane of ZnO in thin film samples. The lattice parameter c derived from the (002) diffraction peak increases with the increase in doping percentage of vanadium in ZnO, suggesting the vanadium ions substitution for Zn in ZnO lattice. The increasing trend in residual stress with the increase in vanadium doping is an indicative of interstitial defects and the vanadium ions substitution in ZnO lattice site. PL measurement at low temperature shows the acceptor-related transitions such as free electron to neutral acceptor (FA) and donor–acceptor-pair (DAP). XPS results are in agreement with the XRD and PL results and support vanadium doped ZnO phase formation. Furthermore, the hysteresis curves exhibiting the ferromagnetism for all thin films samples support the formation of doped phase in thin films samples.
ACKNOWLEDGMENTS
The authors are grateful to the National Institute of Education/Nanyang Technological University, Singapore, for providing the AcRF grant RI 17/03/RSR. One of the authors, S. Karamat, would like to thank NIE/NTU for providing the research scholarship.