





Introduction
Sustainability of agricultural production on a global scale largely depends on the effective and efficient management of water resources (Ding et al., Reference Ding, Ali, Elmahdy, Ragab, Seleiman and Kheir2021; Tutar, Reference Tutar2024). Agriculture accounts for the largest share of freshwater use globally, and in many regions these resources are declining at an alarming rate (Himanshu et al., Reference Himanshu, Ale, Bordovsky and Darapuneni2019; Saad et al., Reference Saad, Elhabbak, Abbas, Mohamed, AbdelRahman, Scopa and Bassouny2023). Increasing temperatures and decreasing rainfall due to climate change are reducing the availability of water, and this scarcity is seriously threatening agricultural production, especially in water-stressed regions (Kheir et al., Reference Kheir, Ding, Ali, Feike, Abdelaal and Elnashar2020; Shareef et al., Reference Shareef, Gui, Zeng, Waqas, Zhang and Iqbal2018). In this context, it is critical to reconsider current irrigation policies and implement sustainable water management approaches (Zou et al., Reference Zou, Saddique, Ali, Xu, Khan, Qing and Siddique2021). On the other hand, factors such as the rapidly growing world population, urbanization and shrinking agricultural land are increasing the pressure on global food security, which necessitates the development of innovative and sustainable solutions for the efficient use of water (Galindo et al., Reference Galindo, Collado-González, Griñán, Corell, Centeno, Martín-Palomo and Pérez-López2018; Yavuz et al., Reference Yavuz, Seymen, Süheri, Yavuz, Türkmen and Kurtar2020). In this context, environmental factors such as drought and water stress cause significant changes in the physiological, biochemical and morphological structures of plants. (Oguz et al., Reference Oguz, Aycan, Oguz, Poyraz and Yildiz2022; Wahab et al., Reference Wahab, Abdi, Saleem, Ali, Ullah, Shah and Marc2022). Water stress, in particular, causes a decrease in stomatal conductance, which directly affects the transpiration rate and gas exchange in the leaves, disrupting the plant’s water balance (Seleiman et al., Reference Seleiman, Al-Suhaibani, Ali, Akmal, Alotaibi, Refay and Battaglia2021). Therefore, efficient and sustainable use of water resources in arid and semi-arid regions is of critical importance. In this context, limited irrigation strategies are becoming increasingly important (Jabeen et al., Reference Jabeen, Ahmed and Ahmed2022; You et al., Reference You, Song, Yang, Zheng, Dong and Chen2022). Deficit irrigation is based on delivering less water than evaporation requires and helps to maintain optimum yields by increasing the water efficiency of crops under water-limited conditions (Ashine et al., Reference Ashine, Bedane, Chota and Admassu2024; Attia et al., Reference Attia, El-Hendawy, Al-Suhaibani, Alotaibi, Tahir and Kamal2021; Painagan and Ella, Reference Painagan and Ella2022; Yu et al., Reference Yu, Zhao, Gao and Siddique2020). Moreover, this irrigation method can affect not only water use efficiency and yield, but also quality parameters such as sugar and protein content (Çelik et al., Reference Çelik, Tutar, Gönülal and Er2024). It is also evident that plants are able to adapt to moderate water stress and experience only minimal losses in yield while increasing water efficiency under these conditions (Parkash et al., Reference Parkash, Singh, Deb, Ritchie and Wallace2021; Singh et al., Reference Singh, Singh, Parkash, Ritchie, Wallace and Deb2022; Tutar et al., Reference Tutar, Celik, Er and Gönülal2025).
The efficient use of water, especially in water-sensitive crops such as maize (Zea mays L.), requires proper irrigation management in order to reduce yield losses and prevent waste of resources (Admasu et al., Reference Admasu, Michael and Hordofa2019). Sweet corn is a product with high nutritional value, notable for its high energy and sugar content, as well as being rich in vitamin C, vitamin B6, potassium and dietary fibre (Farsiani et al., Reference Farsiani, Ghobadi and Jalali-Honarmand2011; Moteva et al., Reference Moteva, Gadjalska, Kancheva, Tashev, Georgieva, Koleva and Petrova-Brahicheva2016; Srinivasan et al., Reference Srinivasan, Sudheer and Menon2007). Especially in arid and semi-arid regions where water scarcity has become a major problem, sweet corn agriculture plays a strategic role in terms of both food security and sustainability of agricultural production (Öktem and Öktem, Reference Öktem and Öktem2009; Tas and Mutlu, Reference Tas and Mutlu2021). Increasing consumption behaviour on a global scale is driving demand for this product, and there has been a significant increase in the production and trade volume of sweet corn in Türkiye (Kuşçu et al., Reference Kuşçu, Seçme and Karakuş2025; Sezer et al., Reference Sezer, Kiremit, Öztürk, Subrata, Osman, Akay and Arslan2021). In recent years, the cultivation areas and economic value of sweet corn in Türkiye have increased remarkably in parallel with this increase in demand (Öztürk and Uzun, Reference Öztürk and Uzun2024; Stansluos et al., Reference Stansluos, Öztürk and Kodaz2020). Research shows that water stress varies significantly at different phenological stages of sweet corn growth, with some stages being more sensitive to water stress than others. In particular, deficient irrigation during the vegetative stage leads to a decrease in photosynthetic capacity and consequent yield reductions (Narayanan and Seid, Reference Narayanan and Seid2015). The timing and severity of water stress are determinants of yield, highlighting the importance of optimized irrigation strategies (Ertek and Kara, Reference Ertek and Kara2013). Several studies show that deficit irrigation can improve water use efficiency and in some cases provide yields close to full irrigation (Allakonon et al., Reference Allakonon, Zakari, Tovihoudji, Fatondji and Akponikpè2022; Djaman et al., Reference Djaman, Irmak, Rathje, Martin and Eisenhauer2013; Zou et al., Reference Zou, Saddique, Ali, Xu, Khan, Qing and Siddique2021). However, the effect of water stress on quality parameters is also noteworthy; for example, Shivakumar et al. (Reference Shivakumar, Ramachandrappa and Mudalagiriyappa2011) and Tarighaleslami et al. (Reference Tarighaleslami, Zarghami, Mashhadi and Oveysi2012) reported that the protein content in maize grain decreased with water stress. These findings call for a more detailed investigation of the potential impacts of deficit irrigation practices, especially in arid and semi-arid regions. In this context, sweet corn is an ideal model plant for the evaluation of water management strategies, as it is a species that shows significant physiological responses to water deficit. In addition, in nowadays, when water resources are increasingly limited due to increasing population and climate change, increasing water efficiency in agricultural production has become a priority target. In this direction, studies to understand the water-yield relationship of sweet corn under different climatic conditions, especially in semi-arid regions, are of great importance in terms of developing sustainable production systems and achieving long-term food security goals.
In general, many studies have examined the effects of different irrigation levels on water productivity of maize plants. However, studies on the changes in the chemical content of sweet corn, which has high nutritional value, under drought stress remain limited. This situation requires the evaluation of sweet corn not only in terms of yield but also in terms of quality parameters. In general, many researchers have conducted research on the water productivity of different irrigation levels in maize. However, there is not enough research on the evaluation of the chemical content of sweet corn, which has high nutritional value, under drought stress. The objectives of this study were; 1) to determine the effects of different irrigation levels on sweet corn yield, 2) to evaluate whether inadequate irrigation under drought stress conditions can minimize yield loss, 3) to examine yield and plant water consumption under semi-arid climate conditions by comparative analysis of field data and CROPWAT model simulations under different water management strategies, and 4) to determine the physiological and chemical contents of sweet corn grown in a semi-arid region.
Materials and methods
Experimental site
The two years (2022 and 2023) of field experiments were conducted in Konya, Türkiye (37° 51´ N, 32° 33´ East and the altitude of 1016 m) (Figure 1). The study area is located in a semi-arid climate with an average temperature of 11.8 °C. The average annual rainfall in the region is 327.6 mm. During the 2022 and 2023 production seasons, data on rainfall (mm) and daily maximum and minimum air temperatures (°C) were obtained from the nearest meteorological station to the study area (Figure 2). The chemical and physical properties of the experimental area are presented in Table 1. The experimental soil was pH (7.8), EC (0.67 dS/m), CaCO3 (33.40 %), organik madde (%1.50), P2O5 (131 kg/ha), K2O (870 kg/ha), field capacity (26.9 %), wilting point (16.3 %) at 30 cm surface layer.
Study country and experimental city and area.

Figure 1. Long description
The image consists of three elements: a world map, a regional map of Turkey, and an aerial photo of an agricultural field. The world map highlights a specific region in Turkey. The regional map of Turkey highlights the Konya region. The aerial photo shows an agricultural field with several plots of crops. The highlighted area in the world map corresponds to the location of the regional map, which in turn corresponds to the location of the agricultural field in the aerial photo. The purpose of combining these images is to provide a geographical context for the agricultural field in Konya, Turkey.
Long term and experimental year’s monthly climate data of study site.

Some physical and chemical properties of the experimental soil

Table 1. Long description
A table showing the chemical and physical properties of soil at three different depths: 0-30 cm, 30-60 cm, and 60-90 cm. The table has 9 columns and 3 rows. The columns are labeled as follows: Depth (cm), TC, FC (Pw percent), WP (Pw percent), BD (g per cm cubed), pH, EC (dS per m), CaCO3 (percent), OM (percent), P2O5 (kg per ha), and K2O (kg per ha). Row 1: Depth 0-30 cm, TC CL, FC 26.9, WP 16.3, BD 1.26, pH 7.8, EC 0.67, CaCO3 33.40, OM 1.50, P2O5 131, K2O 870. Row 2: Depth 30-60 cm, TC CL, FC 27.4, WP 17.2, BD 1.33, pH 7.9, EC 0.50, CaCO3 29.70, OM 1.30, P2O5 124, K2O 660. Row 3: Depth 60-90 cm, TC CL, FC 28.1, WP 17.3, BD 1.36, pH 8.1, EC 0.40, CaCO3 29.90, OM 1.20, P2O5 109, K2O 420.
TC: texture class, CL: clay loam, FC: field capacity, WP: wilting point, BD: bulk density, OM: Organic matter, EC: electrical conductivity, CaCO3: calcium carbonate, P2O5: phosphorus pentoxide, K2O: potassium oxide.
Experimental design
The Vega F1 sweet corn hybrid was used as the plant material in this study. The seeds were sown with a seeder on May 12 in 2022 and May 15 in 2023. According to the soil analysis results, nitrogen (ammonium sulphate) and P (triple superphosphate) fertilizers were applied to all plots at doses of 2000 N kg/ha and 800 P2O5 kg/ha, respectively. The study was carried out according to the randomized block design with three replications. The experimental plots were 7 m long and 2.80 m wide, and each plot was arranged to cover a total area of 19.60 m2. Four rows were created in each plot, with a distance between rows of 0.70 m and a distance between rows of 0.18 m. Irrigation applications were carried out with a drip irrigation system, and a lateral pipe was laid in every two rows. In the irrigation system, 16 mm diameter drippers with a 30 cm dripper spacing, a flow rate of 2 l/hour and pressure adjustment were used.
Irrigation water applied
Irrigation water was provided from a deep well in the research area. The quality of irrigation water was determined to be C2S1. In this study, two irrigation levels, FI (Full irrigation) and DI (50 % deficit irrigation), were evaluated based on the principle of replacing soil water depleted from field capacity. The gravimetric method was applied to determine the soil moisture content. Soil samples were taken in 30 cm layers from the 0 to 90 cm soil layer, which is the effective root depth of corn, and their fresh weights were determined by placing them in moisture containers and drying them in an oven at 105 °C for 24 h to calculate their moisture content. The irrigation quantity applied to the I100 plots was calculated by the following Equation (1) (Kanber, Reference Kanber2010).
 $$ I={\left[\left(FC-SWC\right)\, x\, \gamma _{t}\, x\, D\, x\, P\, \right] \over 10}$$
where I is the irrigation water depth, mm, FC is the soil moisture content retained at field capacity, w/w, SWC is the soil water content, w/w, γ t is the soil bulk density g/cm3, D the effective rooting depth, cm, P is the plant cover percentage. The P value was determined by dividing the plant cover width by the plant row spacing, it was taken minimum as 0.30 and maximum as 0.80. Irrigation was applied when the available soil moisture in the control plots was depleted to approximately 40 %. The approximate irrigation day was determined from the soil moisture tension monitored by calibrated manometer tensiometers placed in the middle of the 0–30 and 30–60 cm layers in all fully irrigated control plots. When the tensiometer manometer value corresponded to approximately 40 % of the total available water in the soil being consumed, the soil was gravimetrically sampled to determine the actual SWC for the irrigation rates to be applied. FI plots were irrigated with the irrigation rates calculated by Equation (1), while DI plots were irrigated with 50 % water. However, in both years, following planting, plants were irrigated with equal amounts of water for the first 2 weeks at all irrigation levels to ensure plant adaptation to the soil.
CROPWAT model
Daily weather data such as monthly maximum temperature (Tmax), minimum temperature (Tmin), mean temperature (Tmean), precipitation (P), solar radiation (SR) and wind speed were obtained from the General Directorate of State Meteorology, Konya Meteorology 8th Regional Directorate. CROPWAT 8.0 was used to estimate the water requirement under stress conditions and the corresponding yield reduction (Moseki et al., Reference Moseki, Murray-Hudson and Kashe2019; Smith, Reference Smith1992). Reference evapotranspiration (ETo) was calculated using the Penman-Monteith method and the yield reduction due to water stress was expressed as a percentage. Actual evapotranspiration (ETa) values obtained from field applications (FI and DI) were compared with the yield values estimated by the CROPWAT model. The CROPWAT model was parameterized for sweet corn using site-specific climatic data, including minimum and maximum air temperature, relative humidity, wind speed, sunshine duration, and precipitation, together with geographical coordinates, soil texture, field capacity, wilting point, planting and harvest dates.
Irrigation and seasonal water use efficiency
Irrigation water use efficiency (IWUE) was calculated by dividing grain yield by total irrigation applied during the growing season, as shown in Equation (3). Seasonal water use efficiency (WUE) was calculated as the ratio of grain yield to actual evapotranspiration, as shown in Equation (2) (Howell, Reference Howell2001; Zou et al., Reference Zou, Saddique, Ali, Xu, Khan, Qing and Siddique2021).
 ${\rm WUE}\, \left({\rm kg}/m^{3}\right)= {{\rm Y} \over {\rm ETa}}$
 ${\rm IWUE\ }\left({\rm kg}/m^{3}\right)= {{\rm Y} \over {\rm I}}$
where, Y is the total yield (kg/ha) while, ET and I are the total seasonal evapotranspiration and applied irrigation amounts, respectively. Actual evapotranspiration (ETa) was calculated according to the water budget equation proposed Equation (4) by Allen et al. (Reference Allen, Pereira, Raes and Smith1998).
 ${\rm ET}_{{\rm c}} = {\rm I} + {\rm P} + {\rm Cr} - {\rm Dp} - {\rm Rf} \pm \Delta{\rm S}$
where; ETc= Evapotranspiration (mm), I = Amount of irrigation water (mm), Cr = Capillary rise (mm), Dw = Deep percolation (mm), Rf = Amount of runoff (mm) and ∆S = Changes in water content (mm). The soil of the experimental area is deep and there is no problem with drainage and salinity in the area. Therefore, since there is no capillary rise from groundwater, the Cp value was not taken into account in the calculations. The ΔS value was obtained by measuring the soil moisture determined by the gravimetric method at depths of 0–30, 30–60 and 60–90 cm. Due to the correct planning and operation of the drip irrigation system, no losses due to surface runoff occurred and therefore the Rf value was removed from the calculations.
Yield and physiological trait measurements
Harvest dates were October 1 in 2022 and October 7 in 2023. Harvesting was done when the cob tassels of the plants turned brown. In the examination of agricultural characteristics, 20 plants were randomly taken from each plot and the ear length (cm) specified by the researchers was measured end to end using a ruler (Debebe, Reference Debebe2023; Subaedah et al., Reference Subaedah, Edy and Mariana2021). The number of grains per ear was counted after peeling and divided by the number of ears (Huang et al., Reference Huang, Gao, Qin, Liu, Zhao, Ning and Liu2022; de Oliveira et al., Reference de Oliveira, do Amaral Junior, Leite, Kamphorst, de Lima, Bispo and Campostrini2024). 1000 kernel weight (g), 100 corn kernels were randomly counted 4 times and weighed on a precision scale (Tüfekçi and Kuşçu, Reference Tüfekçi and Kuşçu2021). The weight of grain per ear (g), all grains were carefully separated from the cobs and weighed with a precision scale (Mandić et al., Reference Mandić, Đorđević, Brankov, Živković, Lazarević, Keškić and Krnjaja2024). Yield (t/ha) The cobs obtained from each plot were granulated, then the moisture content of the weighed grains was measured, the values were adjusted to 14 % moisture content and the grain yield per hectare was determined (Aydinsakir et al., Reference Aydinsakir, Erdal, Buyuktas, Bastug and Toker2013). Hectolitre (kg/hl) measured by filling a 250 ml cylinder with seeds, then calculating the hectolitre weight (Konuskan et al., Reference Konuskan, Ertekin and Can2024).
Chemical composition analyses of corn grains
The Nitrogen content (%) of maize grain samples of 20 randomly selected plants from each subplot was determined using the Kjeldahl method and 6.25 was used as the conversion factor for maize (Akçalı and Şahin, Reference Akçalı and Şahin2022; Buriro et al., Reference Buriro, Bhutto, Gandahi, Kumbhar and Shar2015). Oil ratio (%) was determined by automatic Soxhlet apparatus using n-Hexane as solvent (Maqsood et al., Reference Maqsood, Shehzad and Mohsin2012). Crude Ash Content (%) About 1g sample was ashed in an oven at 550 °C for 8h to determine crude ash contents (AOAC, 1990; Kaplan et al., Reference Kaplan, Tas, Ciftci, Varol and Akçura2023). Starch content (%) was determined using the method given by Buriro et al. (Reference Buriro, Bhutto, Gandahi, Kumbhar and Shar2015) and Koca and Canavar (Reference Koca and Canavar2014), while crude fibre (%) was determined using the method given by Rocateli et al. (Reference Rocateli, Raper, Balkcom, Arriaga and Bransby2012).
Statistical analysis
Statistical analysis was conducted using SPSS version 26, where one-way ANOVA was employed to evaluate the effects of treatments. Duncan’s multiple comparison test was subsequently used to distinguish significant differences among mean values at the 5 % significance level (Yildirim et al., Reference Yildirim, Ekinci, Sahin, Ors, Turan, Demir and Kotan2021).
Results
ET and yield predictions (field data vs. CROPWAT) and water productivity (WUE and IWUE)
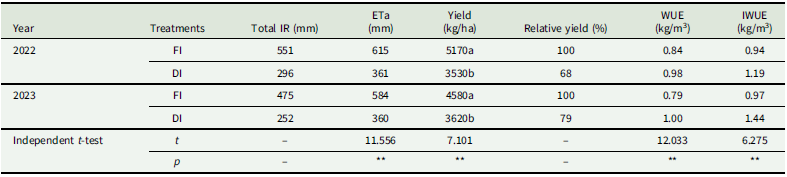
In this study, a total of ten irrigations were applied in the 2022 and 2023 growing seasons. In both years, the first irrigations of the plots were carried out using the same amount of water; subsequent irrigations were planned according to the previously determined irrigation levels. In the first year, 551 and 296 mm of water were applied in full (FI) and deficit (DI) irrigation treatments, respectively, and in the second year, 475 and 252 mm of water were applied. Sweet corn received a total rainfall of 51.5 mm in the 2022 season and 142.4 mm in the 2023 season. Irrigation amounts for each treatment were calculated for the period between planting and harvesting dates, taking into account rainfall data and changes in soil moisture. In 2022, evapotranspiration (ETa) measured in the field was determined as 615 and 361 mm for FI and DI treatments, respectively (Table 2). The CROPWAT estimates corresponding to these values were 645 and 348 mm. In 2023, the ETa values measured in the field were 584 and 360 mm for FI and DI, respectively (Table 2), while the model estimates were calculated as 592 and 353.5 mm (Figure 3a; Table 3). These findings reveal a strong agreement between the field data and CROPWAT simulations. In addition, it was observed that reductions in irrigation amount reduced ET values and different irrigation levels significantly affected plant water use. Due to the decrease in irrigation amounts in both years, evapotranspiration values decreased in all treatments and this situation was evaluated together with the irrigation water deficit. DI treatment produced 71 % lower ET values in 2022 and 61 % lower ET values in 2023 compared to FI treatment.
The crop evapotranspiration (ET) and yield reduction (%) values for different irrigation treatments in 2021 and 2022.

Seasonal crop water use, yield, plant growth parameters and water use efficiency

Table 2. Long description
The table presents data on irrigation treatments, evapotranspiration, yield, and water use efficiency for sweet corn over the years 2022 and 2023. It has 7 rows and 8 columns. The columns are labeled Year, Treatments, Total IR (mm), ETa (mm), Yield (kg/ha), Relative yield (%), WUE (kg/m3), and IWUE (kg/m3). The rows are labeled with the years 2022 and 2023, and include data for full irrigation (FI) and deficit irrigation (DI) treatments. The table also includes an Independent t-test row with t and p values. Row 1: 2022, FI, 551, 615, 5170a, 100, 0.84, 0.94. Row 2: 2022, DI, 296, 361, 3530b, 68, 0.98, 1.19. Row 3: 2023, FI, 475, 584, 4580a, 100, 0.79, 0.97. Row 4: 2023, DI, 252, 360, 3620b, 79, 1.00, 1.44. Row 5: Independent t-test, t, -, 11.556, 7.101, -, 12.033, 6.275. Row 6: Independent t-test, p, -, **, **, -, **, **. The table shows the impact of different irrigation levels on evapotranspiration, yield, and water use efficiency over two growing seasons.
t: Independent Samples Test, * p < 0.05; ** p < 0.01; ns: not significant. Means marked with the different letters in each parameter are significantly different from each other at p ≤ 0.05. IR: irrigation amount; FI: full irrigation; DI: 50 % deficit irrigation; ETa: actual evapotranspiration; WUE: water use efficiency; IWUE: irrigation water use efficiency.
Seasonal crop evapotranspiration (ETc) and yield estimations, and % errors relative to field-measured and CROPWAT-derived values for the 2022–2023 growing season

Table 3 Long description
The table presents data on crop evapotranspiration (ETc) and yield estimations for the years 2022 and 2023. It includes measured and CROPWAT-derived values, along with their deviations. The table has 4 rows and 8 columns. Column headers are Year, Treatment, Measured ETc, CROPWAT ETc, Deviation (percent), Measured Yield (kg/ha), CROPWAT Yield (kg/ha), and Deviation (percent). Row labels are 2022 FI, 2022 DI, 2023 FI, and 2023 DI. Notable trends include variations in deviations between measured and CROPWAT-derived values for both ETc and yield.
According to Table 2, drought stress significantly affected yield. Sweet corn yields in 2022 were 5170 and 3530 kg/ha for FI and DI treatments, respectively. In 2023, yields were 4580 kg/ha with FI treatment and 3620 kg/ha with DI treatment. The yield values estimated with CROPWAT were FI (4678 kg/ha) and DI (2572 kg/ha) in 2022 and FI (4204 kg/ha) and DI (2381 kg/ha) in 2023. It highlights a general agreement between the values measured in the field under water stress and those estimated by CROPWAT. However, discrepancies were particularly evident at lower irrigation levels, emphasizing the need to assess the impact of reduced irrigation on crop yield and to further evaluate the accuracy of CROPWAT (Table 3). Yield losses in 2022 and 2023 were analysed by comparing yield values measured in the field at different irrigation levels and estimated by CROPWAT. The measured yield reduction in both years was assumed to be zero. This indicates that the water needs of the plant were fully met in the full irrigation treatment and no yield loss occurred. However, the CROPWAT model also predicted a small yield reduction under full irrigation, which was calculated as 9.51 % for 2022 and 8 % for 2023. This may be due to differences in the model’s precision or assumptions. The measured yield reduction under deficit irrigation was 31 % in 2022 and 26 % in 2023. This shows that the deficit irrigation condition significantly reduces yields. The CROPWAT model, on the other hand, estimated yield losses higher than the actual values and calculated them as 45 % in 2022 and 43 % in 2023 (Figure 3b). In both years, the CROPWAT model predicted a higher yield reduction compared to the measured yield losses. This difference may be due to deviations in model parameters, site-specific climate data or crop coefficients from actual conditions.
Water use efficiency (WUE) and irrigation water use efficiency (IWUE) are important indicators to evaluate the effectiveness of different irrigation strategies, to save water and yet maintain yield. Table 2 presents the WUE and IWUE values calculated for different irrigation levels. Across treatments, WUE ranged between 0.79 and 1.00 kg/m3 and IWUE between 0.94 and 1.44 kg/m3. The highest WUE and IWUE values were obtained in the limited irrigation (DI) treatments. However, WUE and IWUE values of DI treatment were 16.66 % and 26.60 % lower in 2022 and 26.58 % and 48.45 % lower in 2023, respectively, compared to full irrigation (FI) treatment. Higher IWUE values compared to WUE indicate that irrigation water is the main source of water consumption.
Growth and quality parameters
The yield components of ear length (cm), the number of grains per ear, the weight of grain per ear (g), 1000 kernel weight (g) and hectolitre weight (g) of sweet corn grown under different irrigation levels are given in Figure 4, while the quality parameters of protein ratio (%), oil ratio (%), ash content (%), starch content (%) and crude fibre (%) are given in Figure 5.
Effect of irrigation water amounts on some morphological characteristics of sweet corn. FI: Full irrigation, DI: deficit irrigation, * p < 0.05; ** p < 0.01; ns: not significant. Means marked with the different letters in each parameter are significantly different from each other at p < 0.05.

Effect of different irrigation level treatments on chemical content of sweet corn. FI: Full irrigation, DI: deficit irrigation, * p < 0.05; ** p < 0.01; ns: not significant. Means marked with the different letters in each parameter are significantly different from each other at p < 0.05.

Figure 5. Long description
The image contains four bar graphs comparing the chemical content of sweet corn under different irrigation levels for the years 2022 and 2023. Each graph has two bars representing Full Irrigation (FI) and Deficit Irrigation (DI). The y-axis represents the percentage content, and the x-axis represents different chemical parameters: ash content, protein ratio, crude fiber, oil ratio, and starch content. Panel A for 2022 shows ash content, protein ratio, and crude fiber. Panel B for 2022 shows oil ratio and starch content. Panel C for 2023 shows ash content, protein ratio, and crude fiber. Panel D for 2023 shows oil ratio and starch content. The graphs indicate that the starch content is significantly different between FI and DI for both years, with FI showing higher starch content. Other parameters such as ash content, protein ratio, crude fiber, and oil ratio do not show significant differences between FI and DI for both years.
According to Figure 4, the effects of different irrigation levels on the weight of grain per ear (g), ear length (cm), the number of grains per ear, 1000 kernel weight (g) and hectolitre weight (g) were statistically significant at p < 0.05 level. The highest values for all morphological characteristics were obtained in full irrigation (FI) treatment. In both years, a significant decrease was observed in all growth parameters with increasing water stress. The rates of decrease caused by DI treatment compared to FI were remarkable in both 2022 and 2023 in the main yield and quality parameters of maize. According to 2022 data, ear length (cm), the number of grains per ear, the weight of grain per ear (g), 1000 kernel weight (g) and hectolitre weight (kg) decreased by 24.7, 30.6, 23.8, 20.6 and 17.0 %, respectively. In 2023, the rates of decrease in these parameters were calculated as 10.4, 12.8, 29.8, 14.8 and 24.1 %, respectively. According to Figure 5, the effect of different irrigation levels on starch content (%) was statistically significant (p < 0.05), whereas the effect on protein ratio (%), oil ratio (%), ash content (%) and crude fibre (%) was statistically insignificant. The quality parameters obtained within the scope of the research varied in the range of protein ratio (%): 8.7–9.0 %, Oil ratio (%): 10.7–12.6 %, ash content (%): 1.09–1.28 %, starch content (%): 33.7–39.2 % and crude fibre (%): 6.0–7.4 %. Especially the highest levels of starch content and crude fibre values were reached in full irrigation (FI) treatments. These findings indicate that full irrigation practice contributed positively to the starch and fibre content.
The correlation between growth, yield and quality characteristics
The correlation between growth, yield and quality traits of sweet corn under different irrigation treatments is given in Figure 6. The correlation test showed that there were very strong positive correlations between some morphological and biochemical traits and yield under deficit irrigation conditions. According to the correlation analysis between plant growth components, the strongest positive relationship was found between 1000 kernel weight and hectolitre weight. On the other hand, the weakest correlation was found between yield and the weight of grain per ear. In terms of quality components, the highest correlation was observed between ash content and crude fibre, while the lowest correlation was found between starch content and ash content. Irrigation levels caused significant changes in this correlation structure. Under full irrigation (FI) conditions, strong positive relationships were found between yield and ear length and starch content. On the other hand, under limited irrigation (DI) conditions, high positive correlations were observed between yield and grain weight per spike and ash content. This suggests that different irrigation strategies reshaped the interactions between both morphological and biochemical traits.
Matrix of correlation coefficients between variables analysed at different irrigation levels. a) full irrigation (FI) and b) deficit irrigation (DI). 1K weights; 1000 kernel weight (g), EL; ear length (cm), WGE; the weight of grain per ear (g), NGE; the number of grain per ear, HW; hectolitre weight (g), PR; protein ratio (%), ASH; ash content (%), CF; crude fibre (%), OIL; oil ratio (%), SC; starch content (%).

Discussion
ET and yield predictions (Field data vs. CROPWAT) and Water productivity (WUE and IWUE)
The results of this study demonstrate that evapotranspiration values in sweet corn are highly influenced by irrigation levels and seasonal climatic variability. In both experimental years, ETc was higher under full irrigation (FI) and significantly reduced under deficit irrigation (DI), highlighting the plant’s sensitivity to water availability during the growing season. These results are consistent with previous studies, which have reported a wide range of ETc values for sweet corn depending on agro-ecological conditions and management practices. For example, ETc values reported in previous studies for sweet corn plants vary in a wide range. For example, values between 700 and 1071 mm were reported by Öktem (Reference Öktem2008), 572–614 mm by Singh et al. (Reference Singh, Singh, Parkash, Ritchie, Wallace and Deb2022), 281–421 mm by Singh et al. (Reference Singh, Singh, Deb and Ritchie2023) and 315–423 mm by Szalókiné Zima (Reference Szalókiné Zima2023). These differences are thought to be due to climatic conditions, soil characteristics, irrigation management and cultivation techniques specific to the study areas. In the literature, it is frequently emphasized that water stress treatments lead to a decrease in ETc values (Hao et al., Reference Hao, Xue, Marek, Jessup, Becker, Hou and Howell2019; Rasool et al., Reference Rasool, Guo, Wang, Ullah and Chen2020; Zou et al., Reference Zou, Saddique, Ali, Xu, Khan, Qing and Siddique2021). In parallel with ETa findings, the yield results further confirmed the significant impact of water availability on sweet corn productivity. Yield was consistently higher under full irrigation, while significant reductions were observed under deficit treatments. These results clearly demonstrate the effect of water application levels on yield. Previous studies have similarly reported that water deficit greatly affects yield, especially (Leite et al., Reference Leite, Amaral Junior, Kamphorst, Lima, Santos Junior, Schmitt and Rodrigues2021; Paredes et al., Reference Paredes, de Melo-Abreu, Alves and Pereira2014; Wang et al., Reference Wang, Meng, Xie, Wang, Ming, Hou and Li2023; Yusuf et al., Reference Yusuf, Tokosi and Mubaraq2022). The magnitude of yield reduction observed in this study aligns with findings in the literature. For instance, Singh et al. (Reference Singh, Singh, Parkash, Ritchie, Wallace and Deb2022) reported yield reductions of 6, 22 and 37 % with irrigation reductions of 10, 20 and 30 % respectively compared to full irrigation. Ertek and Kara (Reference Ertek and Kara2013), stated that yield losses occur when irrigation is deficit, emphasizing the need for adequate moisture during critical growth stages to maintain optimum production levels. Piscitelli et al. (Reference Piscitelli, Colovic, Aly, Hamze, Todorovic, Cantore and Albrizio2021), found that the highest sweet corn yield was obtained in the full irrigation (FI) treatment in both growth periods. In the deficit irrigation (DI) treatment, the yield remained below 50 % compared to the FI treatment. The relatively low yield difference between the two years in the FI treatment can be attributed to seasonal climate variability and its effects on soil moisture content (Garcia et al., Reference Garcia, Guerra and Hoogenboom2009). The high yield difference between DI and FI is sufficiently consistent with the high water requirements of sweet corn (Stepanovic et al., Reference Stepanovic, Rudnick and Kruger2021). Yield results under deficit irrigation show that sweet corn can maintain reasonable yield levels with regulated deficit irrigation, especially when applied during less sensitive growth periods (Mubeen et al., Reference Mubeen, Ahmad, Wajid, Khaliq, Hammad, Sultana and Nasim2016; Sweeney et al., Reference Sweeney, Kirkham and Marr2016). Studies on deficit irrigation support this approach by showing that strategic irrigation can help stabilize yield quality and quantity even under sub-optimal conditions (Das et al., Reference Das, Garnayak, Patra, Paikaray, Rath, Jena and Sahoo2022).
Water productivity is a key metric in evaluating irrigation strategies, especially under limited water availability. In our study, WUE and IWUE values were found to be higher in DI treatments compared to FI when calculated on an irrigation-input basis. This suggests that, while yield was reduced, the plants under deficit irrigation utilized water more efficiently per unit of water applied. These findings are supported by numerous studies showing that reducing irrigation levels under deficit irrigation conditions generally increases water use efficiency (WUE) and irrigation water use efficiency (IWUE) values (Datta et al., Reference Datta, Chandra, Nath, Kar, Ghosh, Chaturvedi and Singh2022; Roja et al., Reference Roja, Kumar, Ramulu and Deepthi2021; Tüfekçi and Kuşçu, Reference Tüfekçi and Kuşçu2021). Singh et al. (Reference Singh, Saini, Singh and Sharma2019), reported that irrigation at 70 and 40 % ETc provided significant increases in both crop productivity (WPyield) and biomass productivity (WPbiomass) compared to full irrigation (100 % ETc). However, in 2020, it was reported that these positive impacts were either limited or changed negatively due to the impact of environmental conditions. Ertek and Kara (Reference Ertek and Kara2013) reported that irrigation at 70 % ETc in sweet corn production can be an effective water-saving strategy with minimal loss in yield. Similarly, Trout and DeJonge (Reference Trout and DeJonge2017) found that water productivity of maize peaks at 75 % ETc irrigation level; however, below this level, water productivity decreases due to a sharp drop in yield. Hao et al. (Reference Hao, Xue, Marek, Jessup, Hou, Xu, Bynum and Bean2015), in their study in the Texas High Plains, observed a 3 % increase in WUE at 75 % ETc level, while at 50 % ETc level this translated into a significant decrease of 28 %. These findings emphasize the importance of optimizing irrigation strategies taking into account local environmental conditions and plant responses.
Growth and quality parameters
These results further reinforce the conclusion that water availability plays a crucial role not only in yield formation but also in determining key morphological and quality characteristics of sweet corn. The results of the present study were largely in line with the findings in the literature (Al-Naggar et al., Reference Al-Naggar, Atta, Ahmed and Younis2016; Aydinsakir et al., Reference Aydinsakir, Erdal, Buyuktas, Bastug and Toker2013; Debebe, Reference Debebe2023; Halli et al., Reference Halli, Angadi, Kumar, Govindasamy, Madar, Baskar and Abdelmohsen2021). Greaves and Wang (Reference Greaves and Wang2017) reported that grain number per ear, 1000-grain weight, ear number per plant, and grain number per row showed a significant correlation with water stress. The strongest correlation was observed between grain yield and grain number per ear. Similarly, Ahmed and Hassan (Reference Ahmed and Hassan2021) and Ertek and Kara (Reference Ertek and Kara2013) reported that 1000 kernel weight and the number of grains per ear were affected by drought conditions. Rasool et al. (Reference Rasool, Guo, Wang, Ullah and Chen2020) reported that ear length, rows per ear, grains per row and grains per ear values increased with decreasing levels of deficit irrigation water and there was a significant difference between these parameters. Zhang et al. (Reference Zhang, Wei, Li, Zhang, Cai, Ren, Han and Jia2019) reported similar findings and emphasized that maize yield was due to the effects of water deficit. These findings suggest that drought stress has significant effects on both yield and growth parameters. While water stress can increase fibre content by increasing cell wall components (Ali et al., Reference Ali, Ashraf and Anwar2010), it can cause a decrease in protein, oil and starch contents (Varol et al., Reference Varol, Kardes, Irik, Kirnak and Kaplan2020). It also increases the accumulation of carbohydrates and proteins in leaves by causing stomatal closure, which reduces the final product quality by preventing the transport of these components to the grains (Queiroz et al., Reference Queiroz, da Silva, de Menezes, Schaffert, Guimarães, Guimarães and Tardin2015). Li et al. (Reference Li, Li, Zhang, Liang, Kang, Jia and Liao2015) reported that starch content was highly affected by water deficit. Similarly, Kaplan et al. (Reference Kaplan, Tas, Ciftci, Varol and Akçura2023) reported that increasing irrigation levels increased crude ash (%), crude protein (%) and total starch (%) contents, but had no significant effect on crude oil (%). However, some studies in the literature revealed different results. For example, Barutçular et al. (Reference Barutçular, Dizlek, El-Sabagh, Sahin, Elsabagh and Islam2016) reported that water stress had no significant effect on starch, protein, oil and ash content. Ali et al. (Reference Ali, Ashraf and Anwar2010), in a study on two different maize varieties, found that protein and oil contents were affected by water stress, while ash content was not affected. Al-Naggar et al. (Reference Al-Naggar, Atta, Ahmed and Younis2016) reported that drought stress did not cause significant changes in these components in six maize cultivars. Similarly, Akçalı and Şahin (Reference Akçalı and Şahin2022); Datta et al. (Reference Datta, Chandra, Nath, Kar, Ghosh, Chaturvedi and Singh2022) and Maqsood et al. (Reference Maqsood, Shehzad and Mohsin2012) reported that water stress had no significant effect on crude protein, crude oil and crude ash contents. Kresović et al. (Reference Kresović, Gajić, Tapanarova and Dugalic2018) stated that full irrigation increased oil and ash contents, while limited irrigation caused a decrease in these values. Ayas (Reference Ayas2023) emphasized that different irrigation levels were effective on all quality parameters. The findings of this study are largely in agreement with many studies in the literature. However, discrepancies observed in some studies may be due to plant genotype, climatic differences, soil structure and environmental factors. In particular, the fact that grain composition is highly sensitive to environmental conditions and irrigation regimes is a determining factor in obtaining different results. Overall, irrigation practices play a critical role in optimizing grain development and quality contents. However, in order to achieve this effect in the most efficient way, the amount and timing of water application should be carefully planned and a balanced irrigation strategy should be adopted.
The correlation patterns observed in this study suggest that water availability not only influences the magnitude of individual traits but also alters the interrelationships among morphological and quality components of sweet corn. Similarly, there is evidence in the literature that irrigation practices affect the correlation structure. Malala (Reference Malala2010) reported a significant and positive relationship between grain yield and plant height in irrigated sorghum. Maluk (Reference Maluk2015) reported that panicle weight was positively correlated with both grain yield and harvest index. Allamine et al. (Reference Allamine, Buyuktas, Karaca, Aydinsakir and Erdurmus2023) revealed that irrigation levels produced different correlation patterns on plant growth and quality parameters. In line with these findings, it can be said that irrigation strategies change the overall structure of agricultural production systems by affecting not only individual yield or quality parameters, but also the relationships between these parameters.
Although this study provides valuable field-based information on the yield, water use efficiency, quality response, and CROPWAT-based evapotranspiration estimates of sweet corn under semi-arid conditions, the interpretation of the findings should consider the experimental scope. The experiment was conducted at a single location over two growing seasons, which provides a useful representation of the local semi-arid conditions but may require further validation under different soil, climate, and management conditions. In addition, the study focused on two irrigation regimes, full irrigation and 50 % deficit irrigation, allowing a clear comparison between well-watered and water-stressed conditions. Future studies including additional deficit irrigation levels or growth-stage-specific irrigation strategies could provide a more detailed understanding of sweet corn responses to water limitation. Furthermore, the use of one sweet corn genotype enabled consistent evaluation of irrigation effects, although genotype-dependent responses may be explored in future research. Finally, while the CROPWAT model estimates were generally consistent with field-measured evapotranspiration values, the differences observed under deficit irrigation suggest that further site-specific calibration could improve model performance under water-limited conditions. These considerations may support the broader application and refinement of the findings in different semi-arid production systems.
Conclusion
This study demonstrated that full irrigation provided the highest evapotranspiration and sweet corn yield, whereas deficit irrigation improved both water use efficiency and irrigation water use efficiency under semi-arid conditions. Although deficit irrigation reduced yield, the decline was proportionally lower than the amount of water saved, indicating that a considerable level of production can be maintained with substantially less irrigation water. CROPWAT estimates were generally consistent with field measurements, but model performance was weaker under deficit irrigation, suggesting that predictions should be interpreted cautiously under water-limited conditions. Overall, deficit irrigation appears to be a practical and sustainable strategy for balancing water conservation, acceptable yield, and the preservation of major quality traits in sweet corn production.
Author contributions
HE solely conceived, designed, conducted the research, analysed the data, and wrote the manuscript.
Funding statement
No external funding was received for this study.
Competing interests
The author declare that they have no known competing financial interests or personal relationships that could have appeared to influence the work reported in this paper.
Ethical standards
Not applicable.







 Open access

