Introduction
Accurate pre-harvest yield forecasting and yield mapping of tree crops, such as avocado (Persea americana Mill.) and macadamia (Macadamia integrifolia), offer great benefits to the respective tree industries. For individual orchards, an understanding of yield variability allows poor performing regions to be identified, targeted for site specific soil and tissue sampling and then remediated through variable rate technology. Additionally, this information can assist growers with logistical decisions including harvest scheduling, number of pickers and bins required, storage, handling and forward selling (Kohne, Reference Kohne1985; Papageorgiou et al., Reference Papageorgiou, Aggelopoulou, Gemtos and Nanos2013; Wang et al., Reference Wang, Nuske, Bergerman and Singh2013). Currently, yield estimation in avocado (Persea americana) orchards is provided by visual count of a small number of trees. However, this method is labour intensive, provides a limited sample size and the accuracy is often poor. For macadamia, yield prediction models have been developed (Mayer and Stephenson, Reference Mayer and Stephenson2015), but these are more specific to growing regions rather than for individual blocks. Remote sensing has been demonstrated as an accurate tool for yield forecasting and mapping in many agricultural systems. However, research and development in tree crops has been limited.
The objective of this study was to identify if avocado and macadamia yield could be determined by the spectral characteristics of individual tree canopies and to develop a surrogate yield map, from the extrapolation of the relationship, across the entire block.
Materials and methods
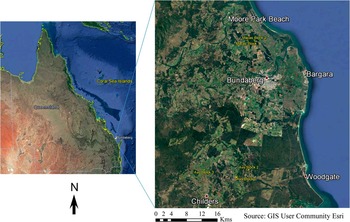
The study was conducted during the 2016 harvest season on two commercial macadamia (Macadamia integrifolia) (cv. 741) and three avocado (Persea americana) (cv. Haas) blocks located near the township of Bundaberg, Queensland, Australia (Figure 1). The area is located between longitudes 152.12°E and 152.38°E, and latitudes 25.11°S and 25.23°S.
Location of the 5 field sites, Bundaberg, Queensland, Australia.

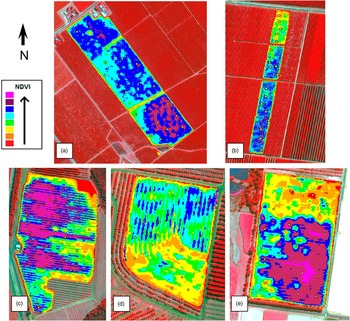
Worldview-2 (WV2) imagery (8 spectral bands; 2 m resolution) was captured over the selected macadamia and avocado field sites on the September 2, 2015 (Processing Level: Ortho Ready Standard Level 2 A, Scan Direction: reverse), under cloud-free conditions with the pixel digital numbers converted to ‘at-sensor’ reflectance following the equation given in Kuester (Reference Kuester2016). Further details about the WV2 and WV3 sensor can be found on the website of the provider (http://worldview3.digitalglobe.com). A Normalised Difference Vegetation Index (NDVI) was applied to the imagery followed by an unsupervised classification to identify ‘zonal’ variability in tree vigour across each block, (Figure 2). Individual trees representing high, medium and low NDVI zones (6 replicates of each - a total of 18 trees), were selected from the 5 blocks and later ground truthed.
Classified NDVI images derived from WV-2 image captured 2 September 2015 of two Macadamia blocks: 19.4 ha (a) and 5.5 ha (b) and the three Avocado blocks: 14.4 ha (c), 6.8 ha (d) and 11.3 ha (e). The yellow markers indicate the locations of the individual trees sampled for yield parameters.

Field sampling of all blocks coincided with their respective commercial harvest. For the two macadamia blocks this occurred between the period of April 11 till 17, 2016, whilst for the avocado blocks this was during the last week of May, 2016. All harvesting was undertaken manually, with all fruit/nuts from each tree counted and weighed on site. For avocado, this provided a direct measure of total yield and fruit number per tree. For macadamia, harvest samples from each tree were de-husked and weighed, with a 100 nut sample retained for drying and then re-weighing to calculate moisture content, then yield and nut number per tree. The geographical position of each tree centre was recorded using a hand-held Trimble DGPS (Trimble, Sunnyvale, CA, USA).
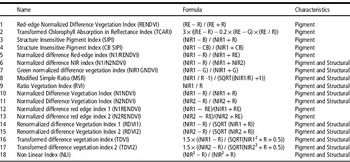
To determine if the yield parameters measured in the field could be related to the spectral characteristics of the corresponding tree canopies, WV-3 image was acquired on April 7, 2016 (1.2 m resolution). The image acquisition was timed after final fruit set in late January and before harvesting in late April/May. To extract the canopy spectra of each sampled tree, the differential GPS locations were overlayed onto the WV-3 image using ArcGIS 10.2 (Environmental Systems Research Institute. Redlands, CA). Following the methodology developed by Robson et al. (Reference Robson, Petty, Joyce, Marques and Hofman2014), a 2 m radius buffer area was applied around each GPS reference point creating a 12.6 m2 area of interest (AOI). This AOI was applied over each individual sampled tree to extract the 8 band WV-3 spectral information for each canopy using the open source software Starspan GUI (Rueda et al., Reference Rueda, Greenberg and Ustin2005). Eighteen structural and pigment based vegetation indices, some detailed by Apan et al. (Reference Apan, Held, Phinn and Markley2003), were derived from the extracted spectral information and regressed against total fruit weight (Kg/tree) and fruit number for each block (Table 1). For each block, the VI with the highest coefficient of determination to the measured parameter was identified.
Vegetation indices used in this study

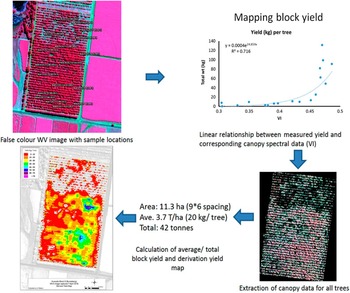
In order to derive a yield map, the canopy specific reflectance data for each block was displayed as a 2-D histogram scatter of red versus near infrared reflectance pixel values. Pixels that corresponded only to the canopy features where identified, creating a mask that was then used to sub-sett the imagery of each block. The algorithm derived from the relationship between the optimal VI and total nut/ fruit weight and nut/ fruit number per tree was then applied to the sub-setted images to convert the reflectance value of each pixel into the measured parameter. A density slice or colour ramp was then applied to each parameter specific map. An example of this process, applied to Avocado Block 3 is provided in Figure 3.
The analysis process used for the prediction of total fruit yield and for the derivation of a yield map from a WV-3 image and targeted ground sampling.

Results and discussion
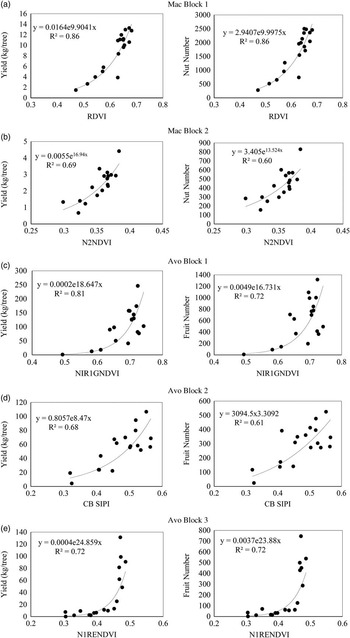
The strong relationships identified between the varying VI’s and measured yield parameters in Figure 4, are hypothesised to be the result of the relationship between tree vigour (health and size) and fruit filling/retention (avocado), and macadamia nut retention capacity. For macadamia Block 1 RDVI1 produced the highest coefficient of determination to both total nut weight (Kg/tree), and total nut number per tree (R2=0.86 with RMSE=1.67 kg/tree and 340 nut/tree respectively), whist for macadamia block 2 N2RENDVI was optimal (R2=0.69 with RMSE=1.28 kg/tree and R2=0.6 with RMSE=196 fruit/tree) respectively. For avocado block 1, N1GNDVI produced the strongest coefficient of determination for total fruit number (Kg/tree) and number of fruit per tree (R2=0.81 with RMSE=45.5 kg/tree and R2=0.72 with RMSE=304 fruit/tree). CB SIPI was optimal for avocado block 2 (R2=0.68 with RMSE=111.3 kg/tree and R2=0.61 with RMSE=612 fruit/tree) and N1RENDVI for block 3 (R2=0.72 with RMSE= 25.97 kg/tree and 145 fruit/tree respectively).
Scatter plots derived between the measured yield parameters (yield and fruit/ nut number) and the highest correlating vegetation index derived from canopy reflectance for 2 macadamia and 3 avocado orchards.

Whilst the results do indicate a strong relationship between the spectral characteristics of the tree canopies and the measured yield parameters for each block, the identification of differing optimal VI’s does indicate a locational or abiotic/biotic influence. For example macadamia block 2 suffered severe nut losses during a hail storm that occurred during September 2015. Whilst this is not ideal for regional forecasting, more appropriate to have one ‘generic’ algorithm for each tree species, it does indicate that through the targeted sampling of a small number of trees an accurate yield map for individual blocks can be derived.
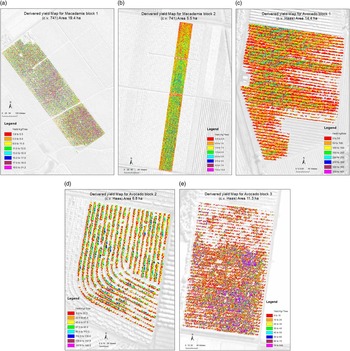
By applying the algorithms identified in Figure 4 to each pixel, yield maps (kg/tree) were derived for each block (Figure 5). These classified maps offer a number of commercial benefits including early detection of tree stress, assisting in management decisions within an orchard block and harvest segregation by indicating the high and low growing regions.
Classified yield maps derived from the best fit model of the relationship between VIs and total fruit weight (kg/tree) for the two Macadamia a. and b. and three Avocado blocks c.d. and e.

Conclusions
The results provided in this study indicate that high resolution satellite imagery, calibrated with the targeted field sampling of a small number of selected trees, can be used to derive a surrogate yield map for avocado and macadamia orchards. In the absence of a commercial yield monitor, the results of this preliminary study are extremely encouraging although additional research is required to evaluate repeatability over more seasons and growing locations.
Acknowledgements
The authors of this paper would like to acknowledge the Rural Research and Development For Profit Scheme, Horticulture Innovation Australia Ltd, Australian Macadamia Society and Avocado Australia Ltd and for providing funding and support to undertake this research. Also Simpson Farms, Clayton Mattiazzi, Ray Norris, Andrew Wallis, Tom Redfern and David Depaoli for allowing the field work to occur on their properties. Lastly Sushil Pandey, Brooke McAlister and Oliver Robson for their assistance with field sampling.