I. INTRODUCTION
In recent years, nickel-based superalloys are considered as an exceptional class of structural materials for high-temperature applications, particularly in the challenging environment of the turbine sections of aircraft engines. These alloys have exceptional combination of static and dynamic mechanical properties, coupled with resistance to degradation in the extreme environments.Reference Kumar, Raghu, Bhattacharjee, Rao and Borah1,Reference Zhang, Zhang, Lu, Zhao and Yang2 However, unfavorable microstructures such as coarse grains and non-uniform distribution of grain size, originating from the hot deforming process, are unfavorable to the mechanical properties of such alloys. To obtain favorable microstructures, the precise control of hot working behavior of superalloys is rather important, which is strongly dependent on the processing parameters, i.e., strain, strain rate, and deformation temperature.Reference Lin, Wu, Chen, Chen, Wen, Zhang and Li3,Reference Zhang, Zhang, Zhou, Lu, Zhao and Yang4 Hence, a clear understanding of microstructure evolution during hot deformation under different processing parameters is crucially important to obtain the propitious microstructures for nickel-based superalloys.
On the other hand, the hot working behavior of superalloys is characterized by complex microstructure evolution due to the synergistic effects of work hardening, dynamic recovery (DRV), and dynamic recrystallization (DRX).Reference Sakai, Belyakov, Kaibyshev, Miura and Jonas5,Reference Wen, Lin, Chen, Chen, Zhang, Liang and Li6 In addition, the occurrence of work hardening is associated with generation of dislocation density, which can be neutralized by DRV through rearrangement or realignment of generated dislocations during the initial stage of hot working.Reference Kumar, Raghu, Bhattacharjee, Rao and Borah7 However, the work hardening can’t be balanced only by DRV, due to the slow DRV kinetics. As a result, the dislocation density increases gradually until the critical strain is attained for triggering DRX. It has been recognized that DRX is the primary microstructure restoration mechanism during hot working, which can reduce deformation resistance and lead to finer microstructure from coarse grained starting structure.Reference Zhang, Zhang, Zhou, Lu, Zhao and Yang4,Reference Cao, Di, Zhang, Zhang, Ma and Misra8 It is believed that during the hot working of nickel-based superalloys, work hardening and dynamic softening mechanisms compete with each other, and the dominance is dependent on the processing parameters. In addition, the twin boundaries can play an important role in DRX process, after the initiation of which twin boundaries can be formed. Meanwhile, a high number of twin boundaries can enhance the mechanical properties and corrosion resistance of nickel-based superalloys.Reference Buckingham, Argyrakis, Hardy and Birosca9,Reference Zhang, Zhou, Qin, Liu and Xu10 Furthermore, the occurrences of DRX and twining have a significant effect on the textures evolution of nickel-based superalloys,Reference Konkova, Rahimi, Mironov and Baker11 which should also be considered.
On the other hand, it is well known that the properties of polycrystalline materials are fundamentally related to the grain boundaries, which can provide preferential information for the hot deformation of nickel-based superalloys.Reference Zhang, Zhou, Qin, Liu and Xu10 According to the coincident site lattice (CSL) model, the CSL misorientation angle of low angle grain boundaries (LAGBs) is between 2° and 15°, while the high angle grain boundaries (HAGBs) are defined when θ > 15°, which contain low-Σ CLS boundaries (3 ≤ Σ ≤ 29) and general boundaries (Σ > 29).Reference He, Tan, Liu, Huang, Huang and Jiang12,Reference Zhang, Zhang, Jiang, Zhou, Zhao and Yang13 Meanwhile, the primary twins are a subset of Σ3 boundaries, which include coherent and incoherent Σ3 boundaries. It is well known that the coherent Σ3 boundaries have low energy and low mobility, which are virtually immune to intergranular attack.Reference Hu, Xia, Li, Liu, Zhou, Chen and Wang14 Moreover, the higher order twins are accompanied with Σ9 and Σ27 boundaries, and these Σ3n (n = 1, 2, 3) boundaries are considered as special boundaries, the evolution of which is also closely related to the processing parameters.Reference He, Lin, Huang and Tang15 However, limited knowledge is available about formation and evolution of grain boundaries during hot deformation at present.
Among the processing parameters like deformation temperature, strain rate, and strain, the dependence of microstructure evolution on strain needs greater attention. In recent years, the electron backscattered diffraction (EBSD) technique has been used to study the effect of strain on the microstructure evolution of nickel-based superalloys during hot deformation by some researchers. Konkova et al.Reference Konkova, Rahimi, Mironov and Baker11 studied the effect of strain on the microstructure evolution of AD730 nickel-based superalloy during hot deformation, and they concluded that lower strain levels were insufficient to provide enough driving force for complete DRX. Buckingham et al.Reference Wen, Lin, Chen, Chen, Zhang, Liang and Li6 studied the effect of strain distribution on microstructure developments during forging in a newly developed nickel-based superalloy. They found that DRV was dominant at the surface where strain was low, and DRX was dominant where levels of effective strain were highest. He et al.Reference Zhang, Zhang, Zhou, Lu, Zhao and Yang4 investigated the strain amount dependent grain size during hot compression of a nickel-based superalloy. They proposed that the average grain size decreased dramatically at the initial deformation period and kept at a stable value by balancing the process of DRX and grain growth. Coryell et al.Reference Coryell, Findley, Mataya and Brown16 studied the effect of strains on textures evolution of a Ni–Fe–Cr superalloy during hot compression. They found that the recrystallized texture was weak until a strain of 0.8, and the compression axis rotated toward the  $[11\bar{1}]$ pole until it reached the [100]–[101] boundary as strain progresses. Although there have been some reports on the strain dependent microstructure evolution of nickel-based superalloys during hot deformation, further investigations on evolutions of DRX behavior, grain boundaries, twining, and texture evolution should be carried out. Hence, a systematic investigation on the effect of strain on microstructure evolution is still very limited for nickel-based superalloys during hot deformation.
This work is aimed to study the strain dependence of microstructure evolution in nickel-based superalloys subjected to hot compression. Analyses of DRX behavior, grain boundary character, and textures evolution were carried out by using EBSD technique.
II. EXPERIMENTAL PROCEDURES
A commercial nickel-based superalloy of GH99 alloy was used in this work with a main chemical composition by weight (%) of 18.3-Cr, 6.4-Co, 5.9-W, 4.02-Mo, 2.19-Al, 1.16-Ti, 0.24-Fe, 0.05-Si, 0.02-Mn, 0.045-C, and balance nickel. The studied alloy is the vital material for the critical parts, such as combustion systems and gas turbines in aerospace industries, due to its excellent high-temperature strength at about 1000 °C.Reference Zhang, Zhou, Qin, Liu and Xu10 Cylindrical specimens were machined with a diameter of 8 mm and a height of 12 mm. Cylindrical samples with the dimension of ϕ 8 mm × 12 mm were prepared from a forged bar of the studied alloy. Before compression, the samples were heat treated at 1100 °C for 30 min, to realize the homogenization of initial microstructure.
The hot compression tests were carried out by using the Gleeble-1500D thermomechanical simulator (DSI, Poestenkill, New York), and the studied alloys were compressed to various true strains ranging from 0.1 to 0.9 at 1110 °C with a strain rate of 0.01 s−1. The deformation parameters were chosen from the practice industrial hot deforming process of the studied alloy. The specimens were heated to the deformation temperature at a heating rate of 10 °C/s and held for 180 s to eliminate thermal gradient prior to the compression tests. During hot compression, the load-stroke curves were converted into true stress-true strain curves by using standard equations. After that, samples were immediately quenched in water to preserve the high-temperature microstructure. Then, the deformed samples were sliced along the compression axis for microstructure observation. The samples for EBSD analysis were mechanically polished, followed by electropolishing in a solution of 10% perchloric acid in ethanol at 20–30 V for 30 s. A Quanta 200FEG scanning electron microscope (FEI, Eindhoven, The Netherlands) equipped with an EBSD detector was used for EBSD detections, and step sizes of 0.25–1 μm were used to scan the deformed portion available at the cut surface. Multiple scans were performed at each condition, and the acquired EBSD data were exported to OIM™ 5 analysis software for analysis.
III. RESULTS AND DISCUSSION
A. Initial microstructure
Figure 1 shows the initial microstructure of the solution treated superalloy before hot deformation. The inverse pole figure (IPF) color map is shown in Fig. 1(a), and different colors represent different crystallographic orientations, which reveals the random textured state in the initial microstructure. The HAGBs (>15°, black lines) and LAGBs (<15°, white lines) are also highlighted in Fig. 1(a), and the fraction of HAGBs can reach above 97%. Moreover, many lamella-like straight annealing twins can also be seen in the initial microstructure, as indicated by the arrows, and these primary annealing twins have Σ3 misorientation. Figure 1(b) shows the orientation imaging microscopy (OIM) map of the alloy, in which the Σ3, Σ9, and Σ27 boundaries are highlighted with red, green, and blue lines, respectively. Obviously, a lot of Σ3 boundaries can be found in the initial microstructure, the fraction of which can reach 55.6%. Meanwhile, the fractions of Σ9 and Σ27 boundaries are only 2.2 and 0.3%, which are almost negligible. Figure 1(c) shows the grain size distribution, which exhibits the dominant presence of grains in the sizes around 100 µm. The average grain size is calculated to be 96.8 µm. In addition, the misorientation distribution plotted in Fig. 1(d) reaffirms the weak presence of LAGBs, and the average misorientation angle (θavg) is 51.6°.
The initial microstructure of the alloy after solution treatment: (a) IPF color map with color code as the inset, (b) OIM map, (c) grain size distribution plot, and (d) misorientation distribution plot.

B. Flow behavior
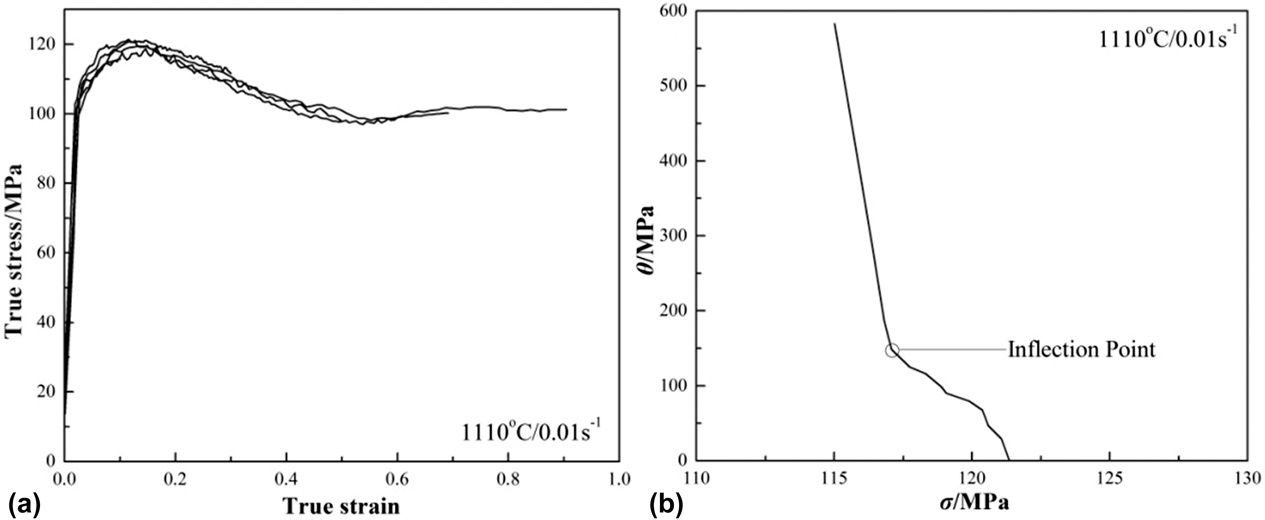
Figure 2(a) shows the flow curves obtained at different strains ranging from 0.1 to 0.9, and these curves exhibit a similar characteristic, which is as indicative of appropriateness of the deformed specimens to represent the same deformation parameter of 1110 °C and 0.01 s−1. From the flow curve obtained at the strain of 0.9, it can be found that the work hardening led to a distinct peak stress, followed by a flow softening stage resulted from the occurrence of DRX. Then, a steady stage was obtained at the high strain, and the similar flow behavior was also observed in the other nickel-based superalloy during hot deformation.Reference He, Lin, Jiang, Yin, Wang and Wu17 In the initial stage of hot deformation, the rapid rise in stress was closely related to the work hardening, which was generally caused by dislocation motion. Meanwhile, it has been reported that the high-density dislocations could lead to the high flow stress.Reference Wen, Lin, Li and Singh18 In other words, the dislocation continually increased and rapidly accumulated in the initial stage of hot deformation, resulting in the rapid increase of flow stress.Reference Zhang, Zhang, Jiang and Lu19 During the initial stage, the effect of work hardening can be partially neutralized by the occurrence of DRV, which is characterized by climb and cross slip of dislocations. However, it should be noticed that the low stacking fault energy of nickel-based superalloys is unfavorable to the cross slip and climb of dislocations.Reference Liu, Hu, Li, Kou, Li, Chang and Fu20 The inadequate extent of DRV can’t balance the dislocations accumulated by stain hardening, leading to the significant increase of dislocation density, which stimulated the occurrence of DRX once a critical strain was exceeded. It is well known that DRX is associated with the development of strain free grains through nucleation by replacing regions of high dislocation density, which can effectively counteract the effect of work hardening and greatly reduce the flow stress.Reference Mcqueen and Imbert21 Furthermore, the nucleation of DRX grains often takes place in the areas with high strain gradients, through strain-induced grain boundary migration, accompanied by the formation of both large angle sub-boundaries and annealing twins.Reference Beladi, Cizek and Hodgson22 On the other hand, after the work hardening stage and flow softening stage, the flow stress reached a steady state owing to the dynamic equilibrium between hardening and softening mechanisms, as seen in Fig. 2(a). In a word, the microstructure evolution during hot deformation is considered as competing processes of work hardening and dynamic softening mechanisms.
The flow behavior of the studied alloy deformed at 1110 °C/0.01 s−1: (a) true stress-true strain curves obtained at different strains and (b) the work hardening rate-true stress curve.

In addition, it is well known that the work hardening rate (dθ = dσ/dε) versus flow stress (σ) curves can reflect the microstructure evolution during hot deformation, such as verifying the occurrence of DRX.Reference Kumar, Raghu, Bhattacharjee, Rao and Borah7 Figure 2(b) shows the θ–σ curve of the studied alloy deformed at 1110 °C/0.01 s−1, and the value of θ decreases linearly at a high speed in the initial deformation stage, accompanied by the formation of subgrains induced by DRV. Moreover, a clear inflection point can be seen after the linear stage of the θ–σ curve, indicating the onset of DRX. According to the mathematical technique proposed by Mecking et al.,Reference Mecking and Kocks23 the critical stress for DRX initiation corresponds to the inflection point in the θ–σ curve. In the view of microstructure evolution, the inflection point reflects the initiation of additional thermodynamic degrees of freedom in the system corroborating to the onset of DRX in addition to DRV. Meanwhile, the analysis of θ–σ curve is based on the fact that the initiation of DRX alters the flow behavior with a concomitant change in the work hardening rate through the introduction of new DRX grains.Reference Najafizadeh and Jonas24 Obviously, the inflection point is also corresponding to the critical strain (εc) for the onset of DRX, which is determined to be 0.07 through detecting the true stress-true strain curve and θ–σ curve.
C. Hot deformation microstructures
1. Effect of strain on the recrystallized microstructures
To investigate the effect of strain on the DRX behaviors of the studied alloy, the DRX grains should be distinguished precisely from the deformed grains. In this study, the grain orientation spread (GOS) was used to distinguish the DRX grains, which is the average difference in orientation between the average grain orientation and all measurements within a single grain. Meanwhile, there is almost no strain and step size dependence for GOS value, which can be obtained accurately from the EBSD data. Moreover, the principle of GOS method is that the GOS value of DRX grains is lower than that of the deformed grains. In the authors’ previous publication,Reference Zhang, Zhang, Zhou, Lu, Zhao and Yang4 it has been reported that a GOS ‘cut off’ of 2° is a suitable criterion to partition DRX grains from deformed matrix for the studied alloy. Based on the criterion, the grains with a GOS value less than 2° are considered as DRX grains.
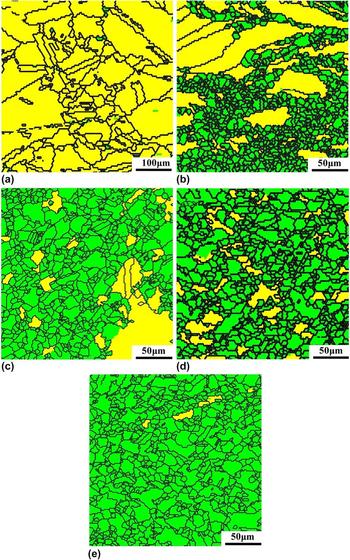
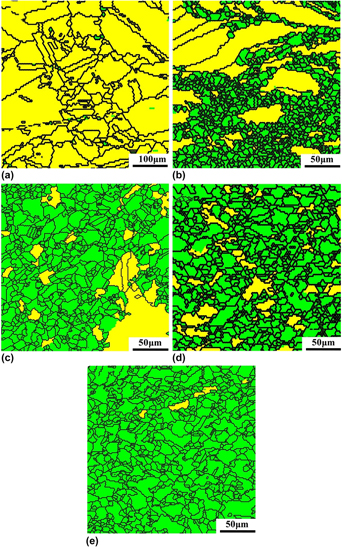
By using the GOS method, the EBSD maps highlighted with the recrystallized zones were obtained, in which the DRX grains were featured by green color and the black lines represented HAGBs, as shown in Fig. 3. Obviously, it can be found that true strain have a significant influence on the DRX grains. As shown in Fig. 3(a), only few small DRX grains can be seen in the specimen deformed to a strain of 0.1, indicating the initiation of DRX owing to the strain-induced boundary migration. Meanwhile, a lower fraction of DRX grains signifies that a lower strain level can’t provide sufficient thermal and strain energy to promote DRX across the entire microstructure. In addition, the characteristics of discontinuous DRX (DDRX) can also be observed in Fig. 3(a), such as the serrated/bulged original grain boundaries. In the authors’ previous publication,Reference Zhang, Zhang, Jiang, Zhou, Zhao and Yang13 DDRX was considered as the main nucleation mechanism of DRX for the studied alloy during hot deformation. At the true strain of 0.3, more DRX grains formed along the original grain boundaries and serrated/bulged grain boundaries became more distinct, resulting in the necklace structures due to the occurrence of DDRX, as shown in Fig. 3(b). It is well known that the bulged/serrated original grain boundaries can act as the potential DDRX nucleation sites.Reference Mandal, Bhaduri and Sarma25 Moreover, it also can be seen that the deformed microstructures was inhomogeneous at the true strain of 0.3, caused by the grain boundary shearing in the initial stages of hot deformation. With the increasing strain, the near-equiaxed DRX grains gradually dominated the microstructures, and the large non-recrystallized grains gradually disappeared, as shown in Figs. 3(c)–3(e). In other words, the fraction of equiaxed DRX grains increased significantly with the increasing strain level at the expense of the large non-recrystallized grains with strong lattice disorientations, due to the fact that the higher strain levels provided more energy for the occurrence of DRX. However, though the fraction of non-recrystallized grains reduced quickly with the increasing strain, they can still be seen in the microstructures with comparatively smaller sizes.
Microstructures of the alloy deformed to different true strains at 1110 °C/0.01 s−1: (a) ε = 0.1, (b) ε = 0.3, (c) ε = 0.5, (d) ε = 0.7, and (e) ε = 0.9.

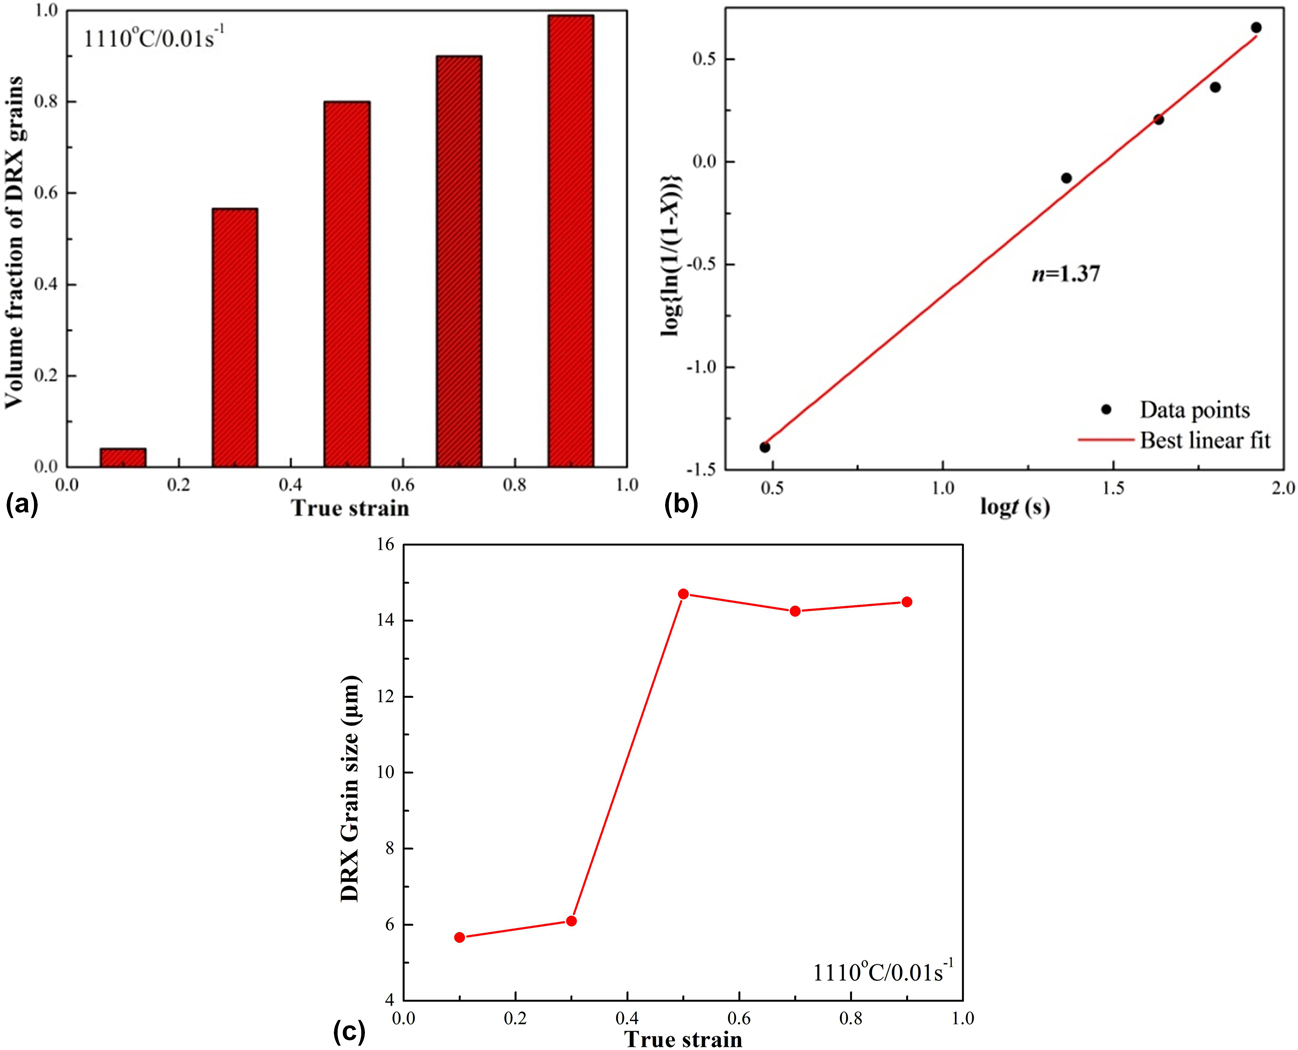
Figure 4(a) shows the volume fractions of DRX grains at different strains, which reaches almost 100% at the strain of 0.9. It is apparent that the sufficient strain level is necessary for overcoming the required strain threshold to complete DRX throughout the entire microstructure. Moreover, the DRX time (t) was calculated according to strain rate  $\left( {t = {{\left( {\varepsilon - {\varepsilon _{\rm{c}}}} \right)} / {\dot{\varepsilon }}}} \right)$, and the Johnson–Mehl–Avrami–Kolmogorov (JMAK) equation was applied to perform Avrami analysis asfollows:
 $$X = 1 - \exp \left( { - k{t^n}} \right)\quad ,$$
where n and k are the parameters associated with the nucleation and growth rates of DRX grains, respectively.Reference Mirzadeh, Cabrera, Najafizadeh and Calvillo26 Based on Eq. (1), the plot of log {ln(1/(1 − X))} versus log t is shown in Fig. 4(b), and the value of n can be determined from the slope of the fitting line, which is 1.37. The low time exponent in the present work is close to the values of n for the 800H alloy and 304H austenitic stainless steel,Reference Cao, Di, Zhang, Zhang, Ma and Misra8,Reference Mirzadeh, Cabrera, Najafizadeh and Calvillo26 illustrating that the DRX behavior of the studied alloy during hot deformation was growth controlled, and a large number of growing nuclei could lead to the single peak behavior and grain refinement. Meanwhile, it has been reported that such a low Avrami exponent also indicates that nucleation takes place at the surface of grain and twin boundaries.Reference Zhang, Zhang, Jiang and Lu19
(a) The volume fraction of DRX grains at different strains, (b) the plot used to determine the Avrami constants, and (c) evolution of average DRX grain size during hot deformation at various strains.

Figure 4(c) shows the average DRX grain size of the studied alloy deformed at 1110 °C/0.01 s−1 with different strains. It can be found that the average DRX grain size is only about 6 μm at the true strains of 0.1 and 0.3, but it increases quickly above 14 μm at the true strain larger than 0.5. In the initial stage of hot deformation (ε ≤ 0.3), even if the strain energy was sufficient to initiate DRX, the magnitude was not high enough to enhance subsequent grain growth. Meanwhile, there was not enough deformation time for the grain growth, and the nucleation of DRX grains was dominant in this stage. On the contrary, due to the combined effects of high strain energy and long deformation time for grain growth, the coarsening of DRX grains was very obvious at the large true strain (ε ≥ 0.5). It is reasonable to assume that the grain growth of DRX grains would be strengthened at the larger strain, which gradually dominated DRX behavior. On the other hand, it also can be seen that the average DRX grain size keeps at a steady value when the true strain is larger than 0.5, which is in good agreement with previous reports based on the necklace mechanism.Reference Rollett, Humphreys, Rohrer and Hatherly27 In the full DRX microstructure, the stable grain size is almost the same with the average DRX grain size, which is about 14.5 μm, as shown in Fig. 3(e). The ratio of the initial grain size and the stable grain size is about 6.67, indicating that grain refinement has been effectively achieved by DRX.
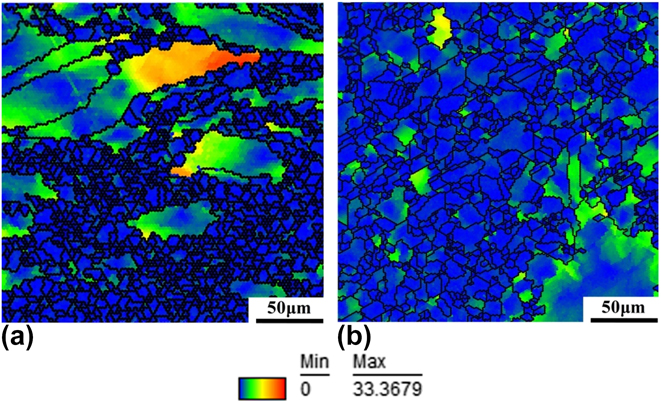
As mentioned above, the occurrence of DRX behavior during hot deformation is closely related to the dislocation density in the deformed alloy. To further investigate the DRX behavior of the studied alloy during hot deformation, the grain reference orientation deviation (GROD) maps were established to analyze the dislocation storage in the deformed alloy. It has been reported that the GROD maps show the orientation deviation between a reference point in a grain and all the other points within the grain, which can reflect and quantify the dislocation density in the deformed alloy.Reference Tu and Pollock28 Figure 5 shows the GROD maps of the studied alloy deformed to the strains of 0.3 and 0.5 at 1110 °C/0.01 s−1. The color coded map is shown at the bottom of the GROD maps, the least and severely misoriented grains denoted by blue and red colors, respectively. It can be found that little misorientation was accumulated within the DRX grains during hot deformation, illustrating that the occurrence of DRX rapidly eliminated dislocations, resulting in the lower dislocation density. Compared with the DRX grains, the GROD values and dislocation storage were higher in the deformed grains, where the growing nuclei may readily accumulate the adequate misorientation to become new DRX grains. Once the critical dislocation density was attained in the higher GROD regions, the DRX behaviors would be initiated. Meanwhile, the misorientation accumulation near the deformed grain boundaries seems to be higher than that within the grains, indicating that new DRX grains mainly formed along the deformed grain boundaries. The higher dislocation density near the deformed grains can also confirm the transformation of deformed structure into recrystallized structure mainly by DDRX.
GROD maps obtained from EBSD in the alloy deformed to different true strains at 1110 °C/0.01 s−1: (a) ε = 0.3 and (b) ε = 0.5.

2. Effect of strain on the grain boundary characteristics
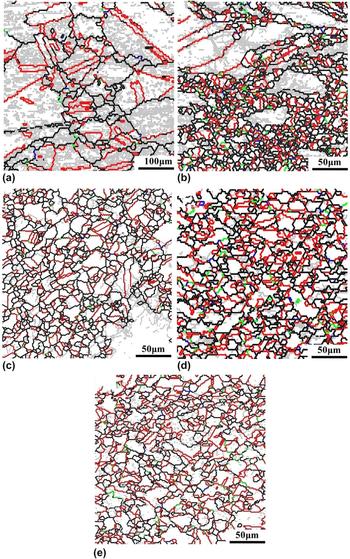
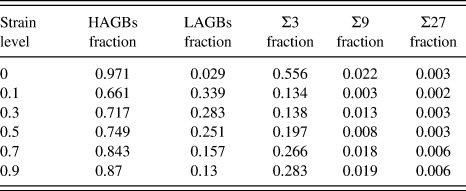
To further study the microstructure evolution of the studied alloy during hot deformation, the EBSD data were used to identify the HAGBs, LAGBs and the twin boundaries (Σ3, Σ9, and Σ27), and the fraction of these boundaries was also given as a percentage of the total boundaries within the given map area in this study. Figure 6 shows the OIM maps of the alloy deformed to different true strains, where HAGBs, LAGBs, Σ3, Σ9, and Σ27 boundaries are represented by black, gray, red, green, and blue lines, respectively. It can be found that the fraction of the LAGBs was dependent on the true strain, and a large number of LAGBs formed in the deformed grains at the low strains of 0.1 and 0.3, as shown in Figs. 6(a) and 6(b). Such phenomenon implies the predominant accumulation of LAGBs in the early stage of hot deformation, which is closely related to the dynamic softening mechanisms. In the initial stage of hot deformation, the strain energy was not sufficient to initiate DRX, and the weak DRV can’t annihilate and rearrange the dislocations substructures generated by work hardening effectively, leading to the formation of a large number of subgrains and LAGBs. As shown in Figs. 6(c)–6(e), the fraction of LAGBs seems to be lower at the larger strain, whereas the fraction of HAGBs increases with the increasing strain, the values of which have been listed in Table I. Such phenomenon indicates the continuous transformation from LAGBs to HAGBs during the DRX process. With the development of DRX, lots of mobile dislocations were continuously absorbed by LAGBs, which would transform into HAGBs. Meanwhile, as shown in Fig. 5, lots of DRX grains formed in the vicinity of the deformed grain boundaries, accompanied with the formation of considerable HAGBs. Moreover, the nucleation and growth of DRX nuclei gradually annihilated dislocations, leading to the decreasing fraction of LAGBs. In addition, some LAGBs can also be seen in the DRX grains, as shown in Figs. 6(c)–6(e), indicating that the newly formed DRX grains also contained a few subgrains. It has been reported that these subgrains would disappear gradually with the proceeding of hot deformation, which are supposed to be transformed into new grains with HAGBs.Reference He, Tan, Liu, Huang, Huang and Jiang12
OIM maps of the alloy deformed to different true strains at 1110 °C/0.01 s−1: (a) ε = 0.1, (b) ε = 0.3, (c) ε = 0.5, (d) ε = 0.7, and (e) ε = 0.9.

Dependency of the fraction of grain boundaries of different characteristics on the applied strain level in the studied alloy.

On the other hand, the formation of primary twin boundaries (Σ3) is highly prevalent in the deformed alloy, and many of HAGBs have Σ3 twin relationship, as shown in Fig. 6. Such observation suggests that twinning is one of the major deformation mechanisms for the studied alloy during hot deformation, which can consume a large portion of strain energy delivered into the material. And yet, there are only few Σ9 and Σ27 boundaries (higher order twins) in the deformed alloy. The fraction of Σ3, Σ9, and Σ27 boundaries has also been listed in Table I. As shown in Table I, the fraction of Σ3 boundaries can reach above 55% in the initial microstructure of the studied alloy, which was reduced to only 13.4% at the true strain of 0.1. This indicates that strain accumulation in the initial stage of hot deformation is not sufficient enough to produce high fraction of Σ3 boundaries. Meanwhile, it has been reported in the authors’ previous publication that concomitant rotation of grains during deformation continuously changed the orientation of original twin boundaries, and most of the original Σ3 boundaries lost their Σ3 relationships at the relatively low strain, leading to the reduction of Σ3 boundaries fraction.Reference Zhang, Zhang, Jiang, Zhou, Zhao and Yang13
In addition, it also can be found a large number of new Σ3 boundaries mainly formed in the newly formed DRX grains, and the fraction of Σ3 boundaries increased with the increasing strain, as shown in Fig. 6 and Table I. It can be concluded that the occurrence of DRX can promote the formation of Σ3 boundaries and a suitable strain level was needed to achieve desired twin boundaries fraction for the studied alloy during hot deformation. It has been widely accepted that twin nucleation is mainly caused by the mobile HAGBs, and the formation of Σ3 boundaries is a result of stacking error at the migrating grain boundaries during the DRX process, which is known as the growth accident model.Reference Mandal, Bhaduri and Sarma25,Reference Mahajan, Pande, Imam and Rath29 The formation of stacking errors at some locations of HAGBs can result in that a random HAGB turns into a junction of a Σ3 boundary and another random HAGB.Reference Song, Chun and Hwang30 When the process is repeated, Σ3 boundaries are generated continuously. At the higher strain level, the longer time for grain boundary migration and the higher strain energy can promote the formation of stacking errors, which is propitious to the formation of Σ3 boundaries by growth accidents. In addition, the propagation of slip dislocations across grain boundaries can produce additional {111} steps, which will in turn increase the probability of twin formation.Reference Mahajan, Pande, Imam and Rath29 Furthermore, the new Σ3 boundaries may also form due to the interactions of Σ3n boundaries through grain boundary migration during hot deformation, which is known as multiple twinning.Reference Mcqueen and Imbert21,Reference Randle31 However, the fraction of Σ9 and Σ27 boundaries is below 2% all the time, indicating the few interactions of Σ3n boundaries.
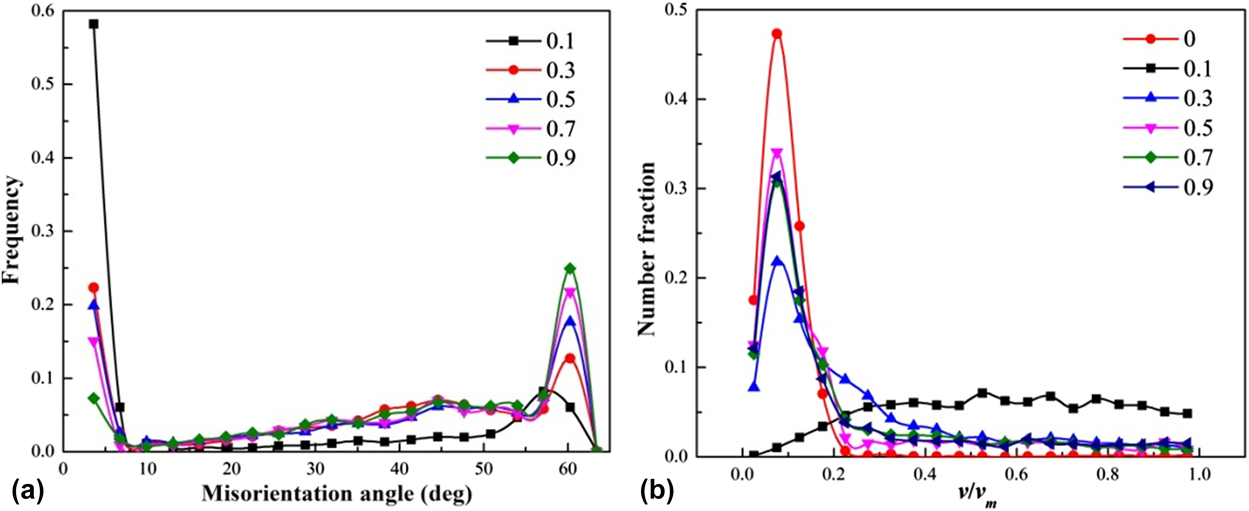
Additionally, the misorientation angle distributions and v/v m distributions of Σ3 boundaries were also used to further investigate the evolution of Σ3 boundaries for the studied alloy during hot deformation, as shown in Fig. 7. From Fig. 7(a), it can be found that there is an obvious increase in approximately 60° boundaries with the increasing strain, which is closely related to the formation of annealing twins during hot deformation. On the contrary, there is an obvious reduction in the peak of the low (2–5°) misorientation angles with the increasing strain, due to elimination of LAGBs by migrating grain boundaries. In other words, with the increasing strain, there is a decrease in total LAGBs fraction and a simultaneous increase in the fraction of HAGBs, many of which have Σ3 twin relationship. This is in a good agreement with the observations of OIM maps, as shown in Fig. 6.
Misorientation angle distributions (a) and the v/v m distributions of Σ3 boundaries (b) for the alloy deformed to different true strains at 1110 °C/0.01 s−1.

On the other hand, the Σ3 twin boundaries can be divided into two types, coherent Σ3 boundaries with {111} boundary plane and incoherent Σ3 boundaries with {112} boundary plane. It should be noted that relative deviation (v/v m) value can be used to distinguish the type of Σ3 boundaries in the deformed alloy, which can provide an estimate of the plane type and the energy of boundaries.Reference Randle and Davies32 For the relative deviation, v is the deviation from the ideal twin orientation and v m is the maximum angular deviation. Moreover, it has been reported that 0.2 is the threshold value of coherent Σ3 boundaries and incoherent Σ3 boundaries, and the relative deviation of coherent Σ3 boundaries is less than 0.2.Reference Mandal, Bhaduri and Sarma33 Figure 7(b) shows the v/v m distributions of Σ3 boundaries for the studied alloy deformed to different strains. It can be seen that in the initial microstructures of the alloy before deformation, there is a high peak at the values of v/v m less than 0.2, indicating that majority of the Σ3 boundaries are coherent Σ3 boundaries. However, such a peak almost disappeared when the alloy was deformed to the strain of 0.1, and most of v/v m values were more than 0.2. This indicates that most of original coherent Σ3 boundaries lost their orientation in the initial stage of hot deformation, leading to the higher fraction of incoherent Σ3 boundaries in the Σ3 total boundaries. As mentioned above, the dislocation density and the fraction of LAGBs were higher in the deformed grains at the low strain. The accumulation of high dislocation densities at the twin boundaries could alter the coherent nature of the Σ3 twins, leading to the sharp reduction of Σ3 boundaries by loss of their coherency.Reference Jin, Gumbsch, Ma, Albe, Lu, Hahn and Gleiter34 Meanwhile, the high fraction of LAGBs might promote the formation of incoherent Σ3 boundaries, through the interactions between LAGBs and original coherent Σ3 boundaries. In addition, it can be seen that all the curves corresponding to the strain above 0.3 exhibit a peak in the region with v/v m less than 0.2 again, and the intensities of these peaks are much stronger in the strain region of 0.5–0.9. It can be inferred that coherent Σ3 boundaries were much easier to form at the strain above 0.5. There are three main reasons for such phenomenon. First, the formation of coherent Σ3 boundaries is energetically favorable, due to that coherent Σ3 boundaries have the lower interfacial energy, lower mobility, and ideal structures.Reference Randle and Davies32 Second, unstable incoherent Σ3 boundaries could be transformed into the stable coherent Σ3 boundaries at the large strain. Third, the lower fraction of LAGBs and dislocation density in the alloy deformed to the higher strain might inhibit the formation of incoherent Σ3 boundaries.
3. Effect of strain on the texture evolution
In this study, the EBSD technology was also used to investigate texture evolution in the studied alloy during hot deformation. Figure 8 shows the IPF color maps of the alloy deformed to the strain of 0.3 and 0.5. Combining the color code shown in Fig. 1(a), it can be found that most of the large deformed grains exhibit a preference for {110} poles to orient parallel to the compression axis, which is considered as the stable compression texture for FCC materials. Meanwhile, there are obvious gradual changes of misorientation across some deformed grains, indicating the strain gradients in the crystals. Moreover, the DRX regions exhibit an obvious relatively random texture, which is consistent with the observation reported by Coryell et al.Reference Coryell, Findley, Mataya and Brown16
IPF color maps of the alloy deformed to different true strains at 1110 °C/0.01 s−1: (a) ε = 0.3 and (b) ε = 0.5.

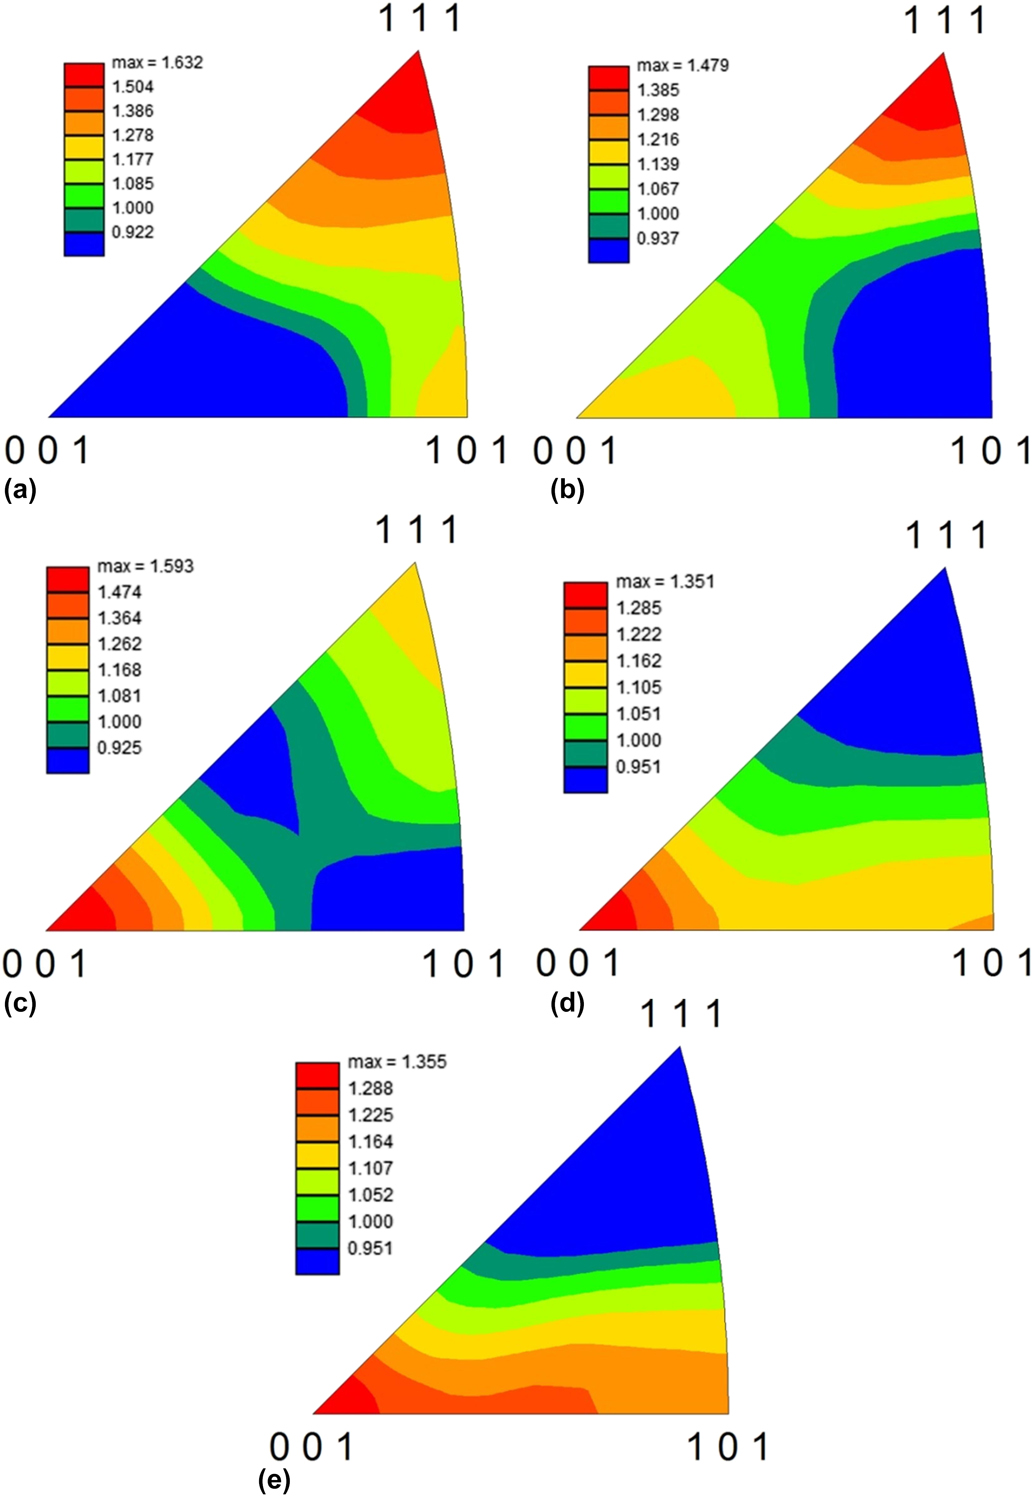
Figure 9 shows the IPFs of the alloy deformed to different true strains at 1110 °C/0.01 s−1. It can be found that the peak intensities of the measured textures are below 1.65, indicating the weak textures of the studied alloy during hot deformation. Such phenomenon is obviously attributable to the DRX process as well as to the extensive annealing twins in the alloy during hot deformation, and annealing twins could also hinder the development of DRX texture.Reference Hasegawa, Yamamoto and Fukutomi35 Moreover, it can be seen that 〈100〉 component of the textures became stronger with the increasing strains. It is well known that oriented grain growth can lead to the observed 〈100〉 texture via the movement of boundaries with high-mobility and high-energy.Reference Coryell, Findley, Mataya and Brown16,Reference Frommert and Gottstein36 As mentioned above, grain growth of DRX grains was strengthened at the larger strain. Hence, 〈100〉 component of the textures could be strengthened at high strains. In addition, the lack of 〈111〉 orientations can be observed in the textures at high strains above 0.7, which was mainly caused by the DRX grains rotating toward the compression texture with subsequent deformation.
IPFs of the alloy deformed to different true strains at 1110 °C/0.01 s−1: (a) ε = 0.1, (b) ε = 0.3, (c) ε = 0.5, (d) ε = 0.7, and (e) ε = 0.9.

IV. CONCLUSIONS
The microstructure evolution of a typical nickel-based superalloy was studied by using EBSD technique in the strain range of 0.1–0.9 at 1110 °C/0.01 s−1. From the above study, the following results can be concluded:
(1) The flow curve of the studied alloy under deformation parameters of 1110 °C and 0.01 s−1 exhibited a distinct peak stress in the initial stage of hot deformation due to the effect of work hardening, followed by a flow softening stage resulted from the occurrence of DRX. Then, a steady stage was obtained at the high strain owing to the dynamic equilibrium between hardening and softening mechanisms. According to the work hardening rate versus flow stress curve, the critical strain for the onset of DRX was determined to be 0.07. Meanwhile, the fraction of equiaxed DRX grains increased significantly with the increasing strain level at the expense of the large non-recrystallized grains with strong lattice disorientations, and the new DRX grains mainly formed along the deformed grain boundaries due to the nucleation mechanisms of DDRX.
(2) According to the JMAK equation, a time exponent of 1.37 was determined from Avrami analysis, indicating that DRX behavior of the studied alloy during hot deformation was growth controlled. In the initial stage of hot deformation (ε ≤ 0.3), the strain energy was not sufficient enough to enhance subsequent grain growth, and the average DRX grain size was only about 6 μm. With the increasing strain, the grain growth of DRX grains gradually dominated DRX behavior, due to the combined effects of high strain energy and long deformation time for grain growth.
(3) There was a sharp rise in the fraction of LAGBs at the relatively low strain, and accumulation of high dislocation densities at the twin boundaries altered the coherent nature of the Σ3 twins, resulting in that most of original coherent Σ3 boundaries lost their orientation in the initial stage of hot deformation. With the increasing strain, there was a decrease in total LAGBs fraction and a simultaneous increase in the fraction of HAGBs, many of which have Σ3 twin relationship. On the other hand, lots of new Σ3 boundaries formed in the newly formed DRX grains mainly by growth accidents, and the coherent Σ3 boundaries were much easier to form at the strain above 0.5.
(4) Most of the large deformed grains exhibit a preference for {110} poles to orient parallel to the compression axis, and the DRX regions exhibited an obvious relatively random texture. Meanwhile, 〈100〉 component of the textures became stronger with the increasing strains, due to the grain growth of DRX grains. In addition, lack of 〈111〉 orientations can also be observed in the textures at high strains above 0.7, which was mainly caused by the DRX grains rotating toward the compression texture with subsequent deformation.
ACKNOWLEDGMENT
This work was supported by the National Natural Science Foundation of China (Nos. 51575324 and 51804187), Fund for Doctor of Shandong Province (Nos. ZR2017BEM008 and ZR2018BEE007), and the Scientific Research Foundation of Shandong University of Science and Technology for Recruited Talents (Nos. 2016RCJJ019 and 2017RCJJ026).