Introduction
A rapid advance in species distribution modelling has been facilitated through the integration of three resources. First, massive online databases documenting species occurrence, accessible in publicly available repositories such as the Global Biodiversity Information Facility (GBIF: https://www.gbif.org/). Second, the development of environmental layers such as the gridded climate data widely used for bioclimatic modelling via WorldClim (Hijmans et al. Reference Hijmans, Cameron, Parra, Jones and Jarvis2005; Fick & Hijmans Reference Fick and Hijmans2017) or CHELSA (Karger et al. Reference Karger, Conrad, Böhner, Kawohl, Kreft, Soria-Auza, Zimmerman, Linder and Kessler2017). Third, the publication of user-friendly platforms implementing powerful statistical methods, such as MaxEnt (Phillips et al. Reference Phillips, Anderson and Schapire2006; Phillips & Dudík Reference Phillips and Dudík2008; Elith et al. Reference Elith, Phillips, Hastie, Dudík, Chee and Yates2011), to combine occurrence data (response) with environmental predictors. During development of species distribution models, much attention has been paid to the effect of underlying data properties (Baker et al. Reference Baker, Maclean, Goodall and Gaston2022; Dubos et al. Reference Dubos, Préau, Lenormand, Papuga, Monsarrat, Denelle, Le Louarn, Heremans, May and Roche2022), the design and choice of environmental predictors (Jiménez-Valverde et al. Reference Jiménez-Valverde, Rodríguez-Rey and Peña-Aguilera2021; Abdulwahab et al. Reference Abdulwahab, Hammill and Hawkins2022), combined with different statistical methods (Heikkinen et al. Reference Heikkinen, Marmion and Luoto2012; Smith & Santos Reference Smith and Santos2020). Less attention has been paid to deciding the time window over which occurrence data are sampled through the activities of field recorders (though see Roubicek et al. (Reference Roubicek, VanDerWal, Beaumont, Pitman, Wilson and Hughes2010)). There is, therefore, an easily overlooked but outcome-critical decision about the time window used when combining occurrences to create a reliable species distribution for subsequent modelling. This distribution is often compared to a baseline period for the environmental predictor, for example in bioclimatic modelling typically represented as climate averages for ‘standard baselines’ calculated over 30 to 50 years (Hijmans et al. Reference Hijmans, Cameron, Parra, Jones and Jarvis2005; Fick & Hijmans Reference Fick and Hijmans2017; Karger et al. Reference Karger, Conrad, Böhner, Kawohl, Kreft, Soria-Auza, Zimmerman, Linder and Kessler2017). For many taxonomic specialist groups, with a relatively low recording effort, establishing the distributional time window is a major challenge. If using a too narrow window for combining occurrences, then distributions can be badly skewed by sampling bias. If too wide, then emergent distributions may have been shaped by variability across multiple environmental predictors within the time window, making attribution a significant challenge when the data are assumed to represent a stable distribution at equilibrium.
Lichens are a case in point; they are diverse (cf. Galloway Reference Galloway1992; Sipman et al. Reference Sipman and Aptroot2001; Lücking et al. Reference Lücking, Dal-Forno, Sikaroodi, Gillevet, Bungartz, Moncada, Yánez-Ayabaca, Chaves, Coca and Lawrey2014a, Reference Lücking, Johnstone, Aptroot, Kraichak, Lendemer, Boonpragob, Cáceres, Ertz, Ferraro and Jiab), functionally important (Galloway Reference Galloway1992; Asplund & Wardle Reference Asplund and Wardle2017) and have recently been the subject of extensive species distribution (bioclimatic) modelling (see for example Ellis (Reference Ellis2019), and references therein). Lichens are also a specialist taxonomic group far less intensively recorded than, for example, birds, mammals or vascular plants. In many regions of the world, lichen recording is simply too sparse to enable species distributions to be accurately modelled. However, in the United Kingdom (UK), an organized and relatively intensive lichen recording effort by the British Lichen Society (BLS) since 1963 (initiated as the ‘Mapping Scheme’) has enabled species occurrences to be compiled for distribution mapping and trend analysis (Seaward & Hitch Reference Seaward and Hitch1982; Seaward Reference Seaward1998; Coppins et al. Reference Coppins, Hawksworth, Rose and Hawksworth2001). Relaunched in 2016 as the BLS ‘Recording Scheme’, the accumulated data now include > 2.6 million lichen records databased and publicly available via repositories such as the UK's National Biodiversity Network (https://nbn.org.uk/), which is the basis for statistical modelling of distributional change (Ellis & Coppins Reference Ellis and Coppins2019; Outhwaite et al. Reference Outhwaite, Gregory, Chandler, Collen and Isaac2020), providing evidence for the policy impactful ‘State of Nature’ reports (Burns et al. Reference Burns, Mordue, al Fulaij, Boersch-Supan, Boswell, Boyd, Bradfer-Lawrence, de Ornellas, de Palma and de Zylva2023). Nevertheless, even within the UK, lichen occurrences across multiple decades may need to be combined to generate a reliably informative distribution that can be compared to environmental predictors. Relevant examples of species distribution models have adopted a 1960–2006 (c. 45 year) time window for the combination of records, matched to a 1961–2000 climate baseline (Ellis et al. Reference Ellis, Coppins, Dawson and Seaward2007; Binder & Ellis Reference Binder and Ellis2008), or a 1961–2010 (c. 50 year) time window, matched to a 1961–2006 climate baseline (Ellis et al. Reference Ellis, Eaton, Theodoropoulos, Coppins, Seaward and Simkin2014b). Consequently, these extended windows could very likely incorporate the asynchronous effect of different predictors that have changed over the same period, for example, being the result of sulphur dioxide emissions (Gilbert Reference Gilbert1970; Hawksworth & Rose Reference Hawksworth and Rose1970) and nitrogen pollution (van Herk Reference van Herk1999; Wolseley et al. Reference Wolseley, James, Theobald and Sutton2006), combined with a lichen response to historical and current climate change (Ellis et al. Reference Ellis, Yahr, Belinchón and Coppins2014a). The assumption of a stable distribution could cause erroneous attribution to these environmental predictors, and a flawed interpretation of statistical models where the dynamic process of species response is not fully incorporated.
Our aim was to better understand how a dynamic response to environmental change may be nested within broad (multi-decade) species distribution time windows. To do this, we narrowed the window used for comparing species distribution and environmental predictors, so that it more appropriately reflects the rate at which lichen distributions might respond to a changing environment. Accordingly, we partitioned occurrences of Bryoria fuscescens (Gyeln.) Brodo & D. Hawksw. into five-year time slices for comparison with environmental predictors. Especially important given the more limited number of occurrences per decade, we also controlled for spatially biased recording effort. Expecting covariation among predictors, we avoided formal hypothesis testing, and multimodel inference was used to explore the relative importance of different environmental predictors over time. On this basis, we estimated a consistent long-term decline in the extent of Bryoria fuscescens caused by a multiplicity of drivers that shift in their magnitude over time.
Methods
Data sampling
First, we sampled a time series of pollution data from the UK FRAME model (Singles et al. Reference Singles, Sutton and Weston1998; Tomlinson et al. Reference Tomlinson, Carnell, Dore and Dragosits2021), which had been used to reconstruct the atmospheric concentration of sulphur dioxide (SO2 μg m−3) and the wet deposition of nitrogen (kg N ha−1 yr−1) at a 5 km grid scale for six discrete time points: 1800, 1900, 1950, 1970, 1990 and 2010.
Second, records of Bryoria fuscescens were downloaded from the British Lichen Society database, totalling 2754 confirmed occurrences from 1745 to 2019. These were filtered to include only those occurrences as epiphytes on trees (corticolous), together with epixylic (lignicolous) records, and therefore excluding occurrences that were on bryophytes, or saxicolous and terricolous. The 1395 occurrences remaining were then grouped into six decadal time periods corresponding to the time points of the UK FRAME model. Removing any duplicate records at a 10 km grid scale, the number of occurrences per decade were as follows: 1800–1809 (0 occurrences), 1900–1909 (1 occurrence), 1950–1959 (4 occurrences), 1970–1979 (152 occurrences), 1990–1999 (89 occurrences) and 2010–2019 (175 occurrences). Only the 1970s, 1990s and 2010s provided a sufficient number of occurrences for statistical modelling. To associate the records for Bryoria fuscescens as closely as possible with the pollution data, the records were trimmed to the periods 1970–1975 (111 occurrences), 1990–1995 (61 occurrences) and 2010–2015 (122 occurrences).
Finally, interpolated climate data (Perry & Hollis Reference Perry and Hollis2005; Hollis et al. Reference Hollis, McCarthy, Kendon, Legg and Simpson2019) were sampled at the 12 km grid scale, being averaged for the periods matching the lichen occurrences: 1970–1975, 1990–1995, 2010–2015.
Environmental predictors were summarized at the 10 km grid scale of lichen records (for a total of 2875 grid cells) as the mean (pollution data) or majority overlapping value (climate data); we therefore modelled the distribution of B. fuscescens in response to the sulphur dioxide concentration, nitrogen deposition, and the climate summarized as minimum temperature, a predictor that in previous bioclimatic analysis was shown to best explain the distribution of B. fuscescens when compared to other possible climate variables (Ellis et al. Reference Ellis, Eaton, Theodoropoulos, Coppins, Seaward and Simkin2014b, Reference Ellis, Eaton, Theodoropoulos, Coppins, Seaward and Simkin2015).
Distribution modelling
We built separate distributional datasets for each of three time periods (1970s, 1990s, 2010s) as follows. The observed occurrences of Bryoria fuscescens were matched against pseudo-absences at the 10 km grid scale. If n is the number of grid cells from which Bryoria fuscescens had not been recorded for a given time period, then: i) recording effort was calculated for these individual grid cells as the number of independent occurrence records for a set of commonly occurring epiphytes (‘control species’) that are ubiquitously distributed and without a strong biogeographical structure in the British Isles (cf. https://britishlichensociety.org.uk/resources/species-accounts), an approach that has been applied in previous trend analyses (Whittet & Ellis Reference Whittet and Ellis2013; Ellis & Coppins Reference Ellis and Coppins2019), and which maintains resolution as an alternative to the spatial aggregation of data (Sparrius et al. Reference Sparrius, van den Top and van Swaay2018). Selected control species were Evernia prunastri (L.) Ach., Hypogymnia physodes (L.) Nyl., Lecanora chlarotera Nyl., Lecidella elaeochroma (Ach.) M. Choisy, Lepraria incana (L.) Ach., Melanelixia subaurifera (Nyl.) O. Blanco et al., Parmelia sulcata Taylor and Ramalina farinacea (L.) Ach. Note that the recording effort per 10 km grid cell could exceed the number of control species if one or more of these had been recorded multiple times independently; ii) the probability distribution of the observed recording effort was then calculated, and from this a randomized vector of recording effort was generated (length = n) and aligned to the observed recording effort; iii) grid cells were selected as pseudo-absences if the observed recording effort exceeded the randomized effort generated from the probability distribution.
A full generalized linear model (GLM) for each time period used the confirmed occurrences and pseudo-absences as Bryoria fuscescens response, and the respective sulphur dioxide concentration, nitrogen deposition and minimum temperature as predictors (Bates et al. Reference Bates, Mächler, Bolker and Walker2015). To accommodate uncertainty created by covariability among the three predictors, we used multimodel averaging to explore their relative importance (Grueber et al. Reference Grueber, Nakagawa, Laws and Jamieson2011; Symonds & Moussalli Reference Symonds and Moussalli2011). We constructed all possible model subsets, using the MuMIn package in R (Bartón Reference Bartón2019), ranking these by their scores for the corrected Akaike's Information Criterion (AICc), and then summing Akaike weights for each of the subset models within which a predictor is featured, to estimate the probability that a predictor will be a component of the best approximating model. Additionally, i) to explore lag-effects for a dynamic pollution regime, each full GLM included values of sulphur dioxide concentration and nitrogen deposition for the preceding time period, for example comparing the 1970s Bryoria fuscescens response to both the 1970s and 1950s pollution regimes etc., and ii) to accommodate randomization effects in the formation of pseudo-absences, ten distributional datasets were created per time period and the variance displayed as box plots for the multimodel averaging results. To aid interpretation of the results, we used Pearson's product moment correlation to measure covariance among predictors for each of the three time periods. To verify the suitability of selected predictors, we also provided the model diagnostics for the optimized GLM with the lowest AICc (the model with the highest Akaike weight), for each of the time periods.
Trend analysis
Finally, we wanted to relate predictors for Bryoria fuscescens distribution to any trends over time in its regional extent. We used the relatively simple Telfer–Preston–Rothery method of trend analysis (Telfer et al. Reference Telfer, Preston and Rothery2002). This compares the number of records for Bryoria fuscescens plus the control species over consecutive time periods to provide a general estimate of increased or decreased occupancy across a shared set of grid cells. Trends for Bryoria fuscescens are isolated against this shared pattern by calculating its deviation as a standardized residual, being the index of change. This index therefore references a relative increase or decrease in distributional extent when compared to the pattern for control species that accommodates recording effort (Hill Reference Hill2012). Analysis was implemented using the R package sparta (https://github.com/BiologicalRecordsCentre/sparta), with the minimum number of recorded sites for time-period comparison set to 5, and with 10 model iterations (Telfer et al. Reference Telfer, Preston and Rothery2002). Index values for the control species were then bootstrapped, resampling 1000 times, to provide a mean and variance against which the value of Bryoria fuscescens could be statistically evaluated.
Results
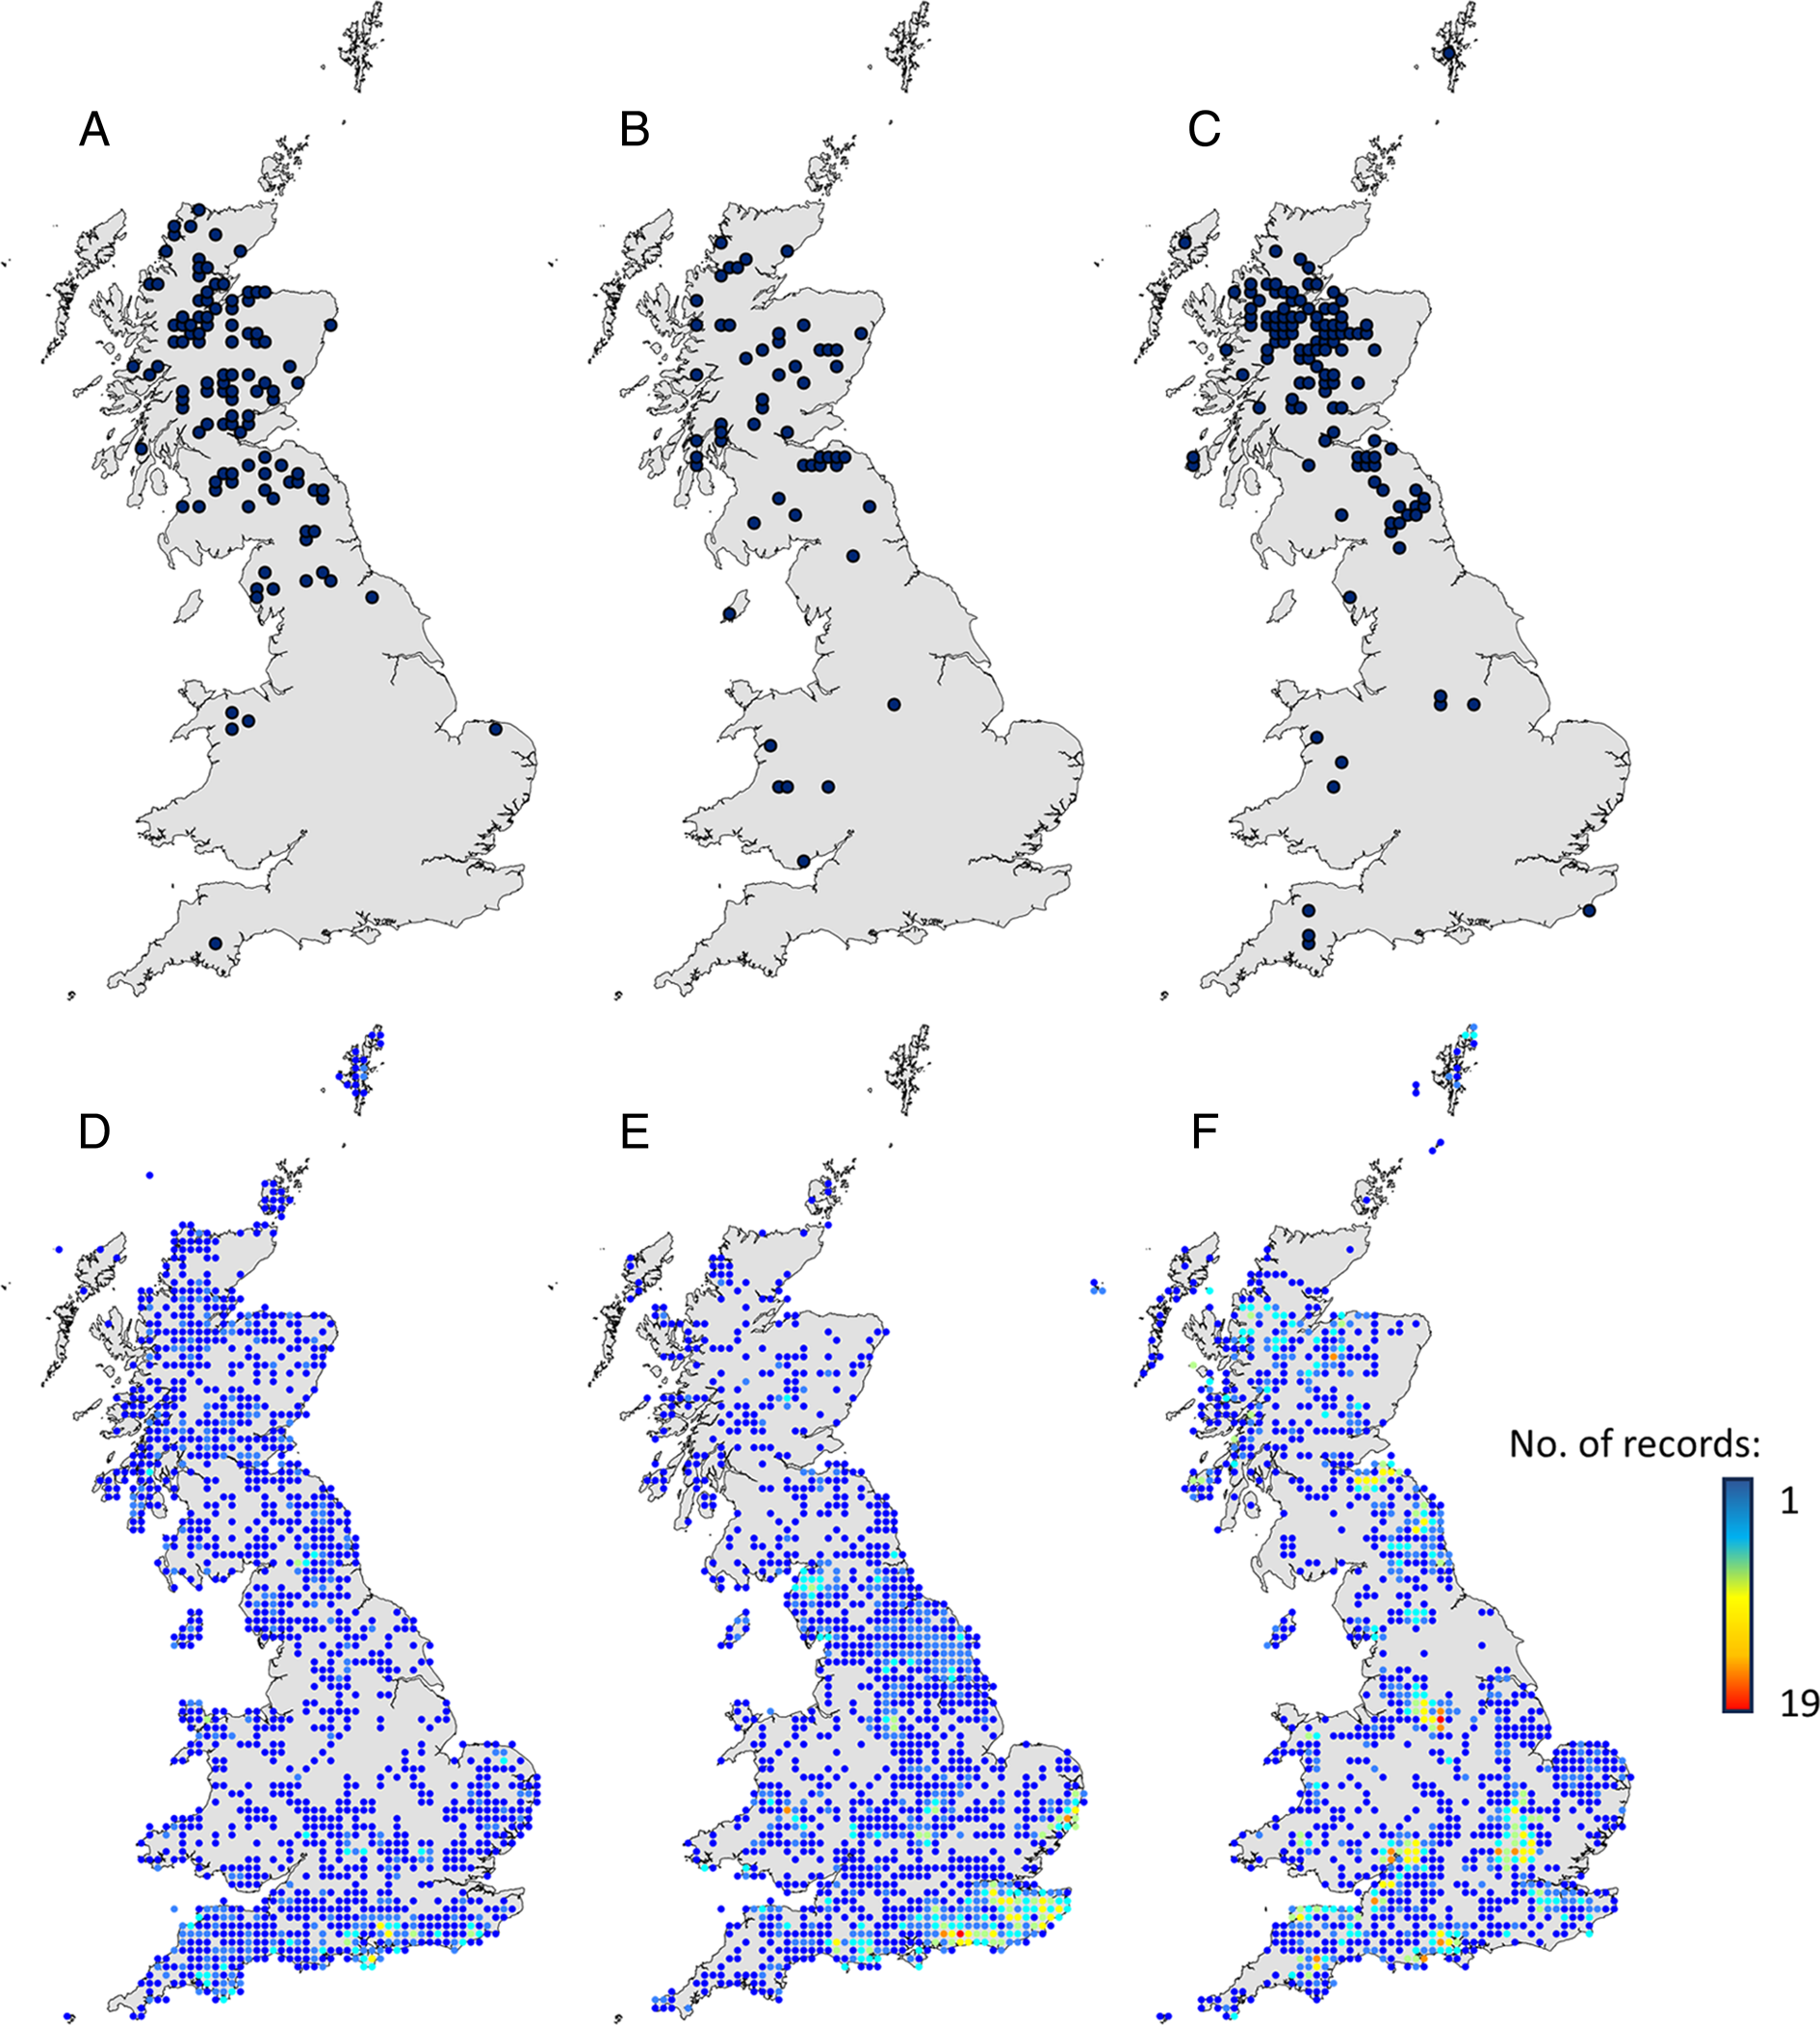
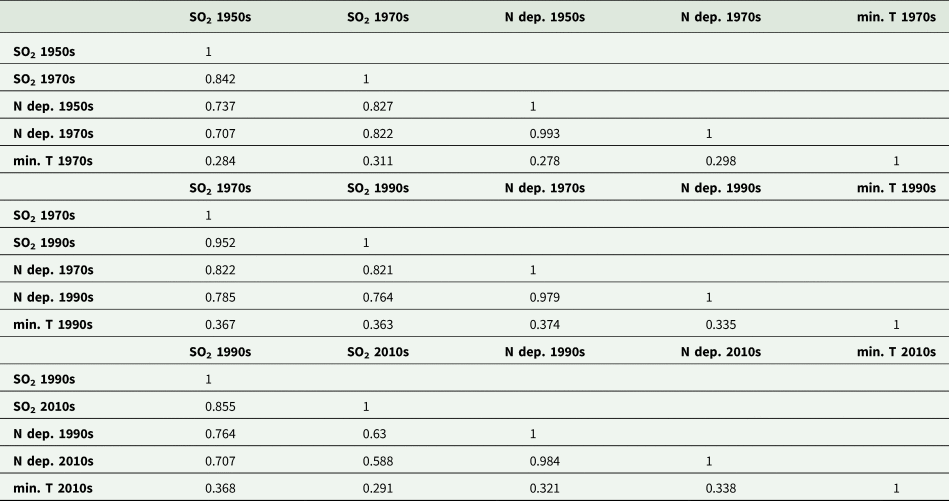
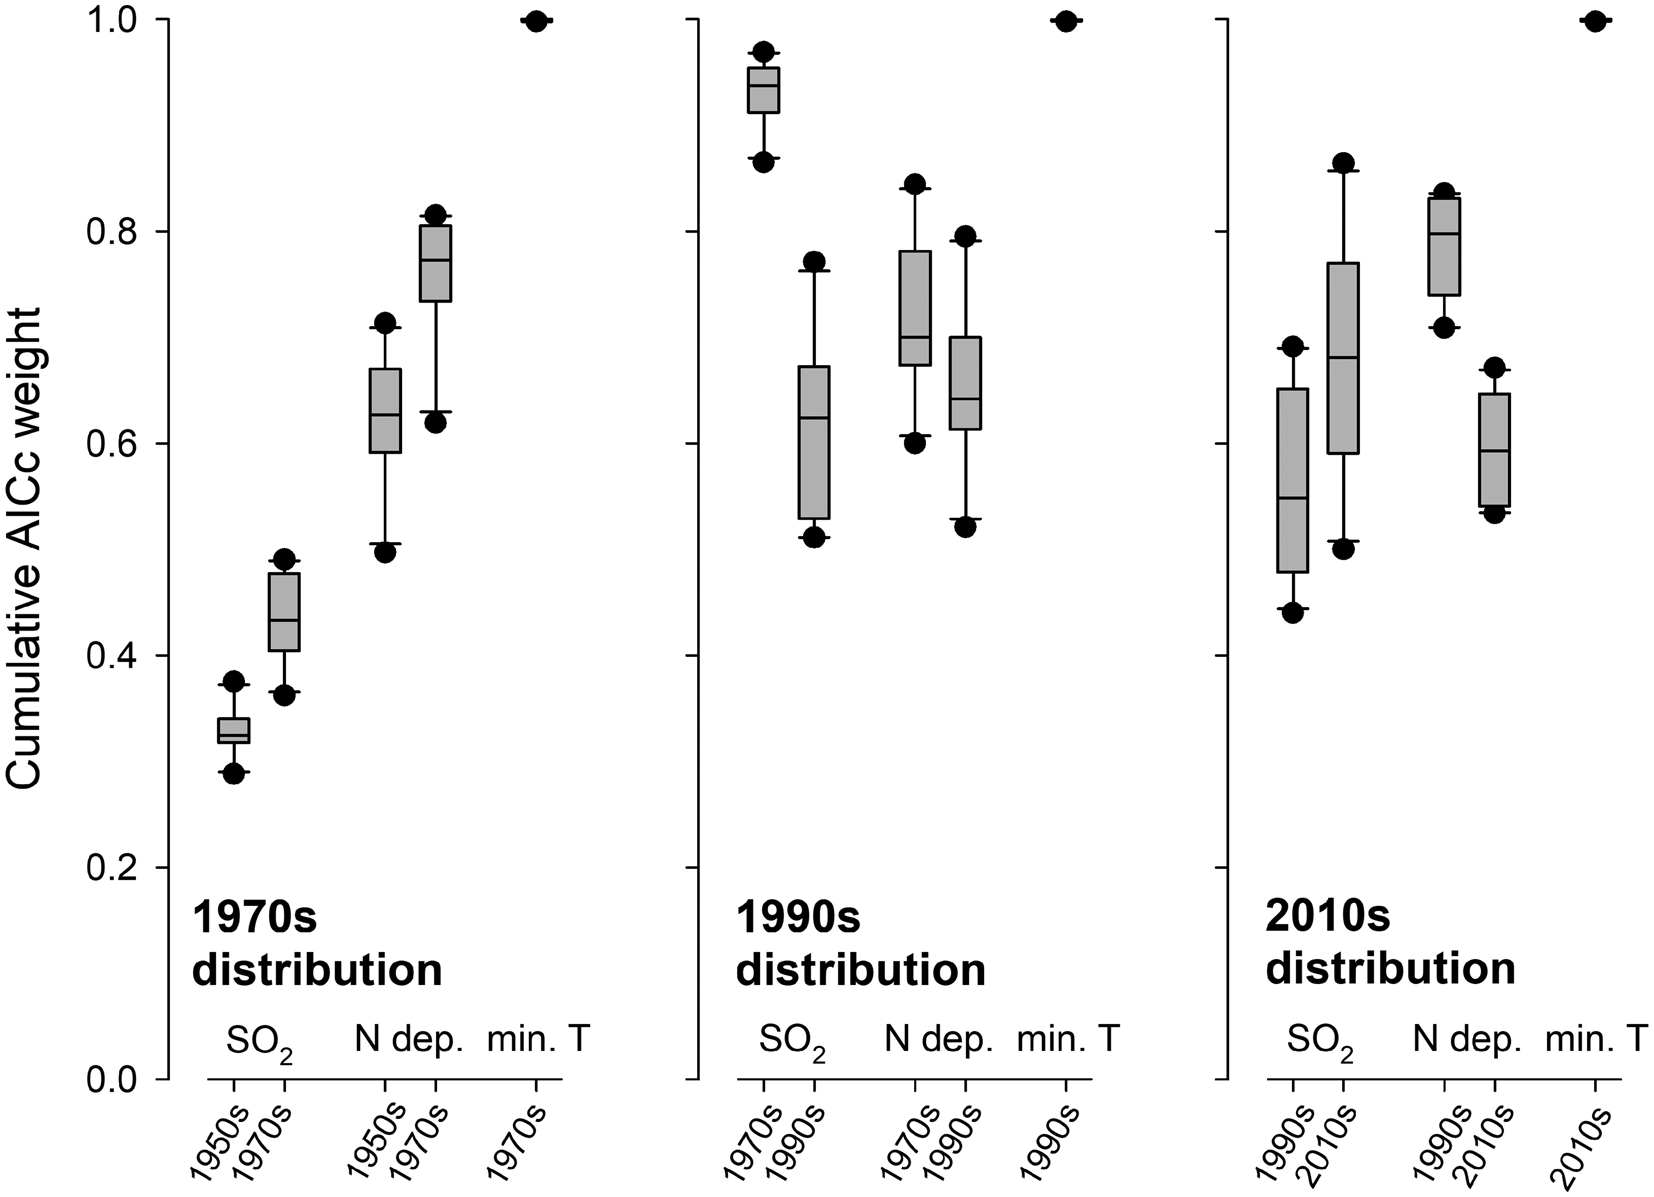
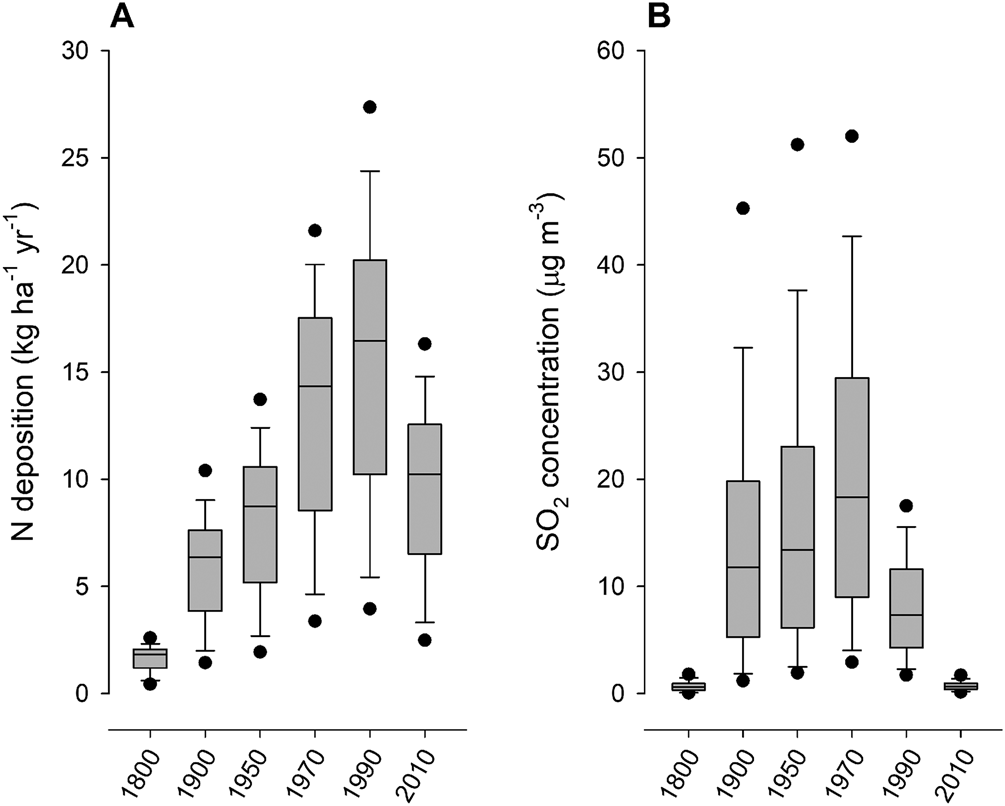
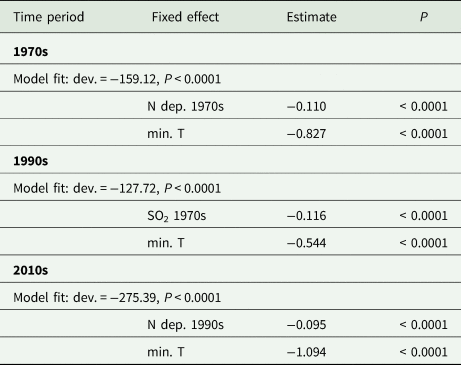
There were only subtle changes in the apparent distribution of Bryoria fuscescens over the three decades examined (Fig. 1A–C), although these time windows need to be interpreted against changing patterns in recording effort (Fig. 1D–F) while allowing due caution when attributing the distribution to predictors, given their covariation (Table 1). Based on multimodal averaging, the distribution of Bryoria fuscescens was defined by two important features (Fig. 2): i) climate (minimum temperature) appeared to be consistently important in explaining the species distribution, and presumably being a key factor setting limits to its natural biogeographical range; ii) a changing pattern of pollution (Fig. 3) was apparent in shifting the relative importance of predictors explaining Bryoria fuscescens distribution. These broad inferences from multimodal averaging receive verification since the optimized GLMs with the lowest AICc for each time period are statistically significant (Table 2), suggesting that the highest ranked models (those contributing the highest Akaike weights) encompass relevant predictors for the Bryoria fuscescens distribution. The models indicate that the probability of Bryoria fuscescens occurrence declines with higher minimum temperatures, higher SO2 concentration and higher nitrogen deposition.
Maps showing 10 km (hectad) records for Bryoria fuscescens for the periods 1970–1975 (A), 1990–1995 (B), and 2010–2015 (C), with respective values (D–F) for the number of independent records of commonly occurring epiphytes as a proxy for recording effort and for the resampling of weighted pseudo-absences. An inferred decline in records over time is therefore calculated with respect to the spatial pattern in values of recording effort. In colour online.

Covariance (Pearson's product moment correlation) among predictors used to explain the distribution of Bryoria fuscescens for each of three time periods.

Multimodel inference for the relative importance of alternate predictors explaining the distribution of Bryoria fuscescens over three decadal time periods (cf. Fig. 1). The box plots show the probability that a predictor will be a fixed effect within the best model approximating Bryoria fuscescens distribution (line = median, box = interquartile range, whiskers = 10th and 90th percentiles, circles = 5th and 95th percentiles). N. dep. = nitrogen deposition; min. T. = minimum temperature.

The variability in modelled values for atmospheric total nitrogen deposition (A) and sulphur dioxide concentrations (B) for the UK, used to explain Bryoria fuscescens distribution, with box plots for consecutive decades (line = median, box = interquartile range, whiskers = 10th and 90th percentiles, circles = 5th and 95th percentiles).

Diagnostics for the optimized GLM with the lowest AICc (the model with the highest Akaike weight), for each of the three time periods.

In detail, nitrogen appears to have had a consistent long-standing effect on Bryoria fuscescens distribution, with its importance extending to at least the 1970s, during which time it is relatively more important than sulphur dioxide (Table 2, Fig. 2). The relative importance of sulphur dioxide appears to increase in the 1990s (Fig. 2), and this appears to be explained by a lag-effect from peak values in the 1970s (Fig. 3). The 1970s values of sulphur dioxide therefore appear to be more important in explaining the 1990s Bryoria fuscescens distribution than the 1990s values of sulphur dioxide (Table 2, Fig. 2). By the 2010s, the importance of sulphur dioxide appears to have declined again, relative to the importance of nitrogen. This reflects an ongoing fall in atmospheric concentrations of sulphur dioxide (Fig. 3), while the consistent importance of nitrogen through the 1990s and 2010s appears to incorporate an increasingly strong lag-effect (Fig. 3).
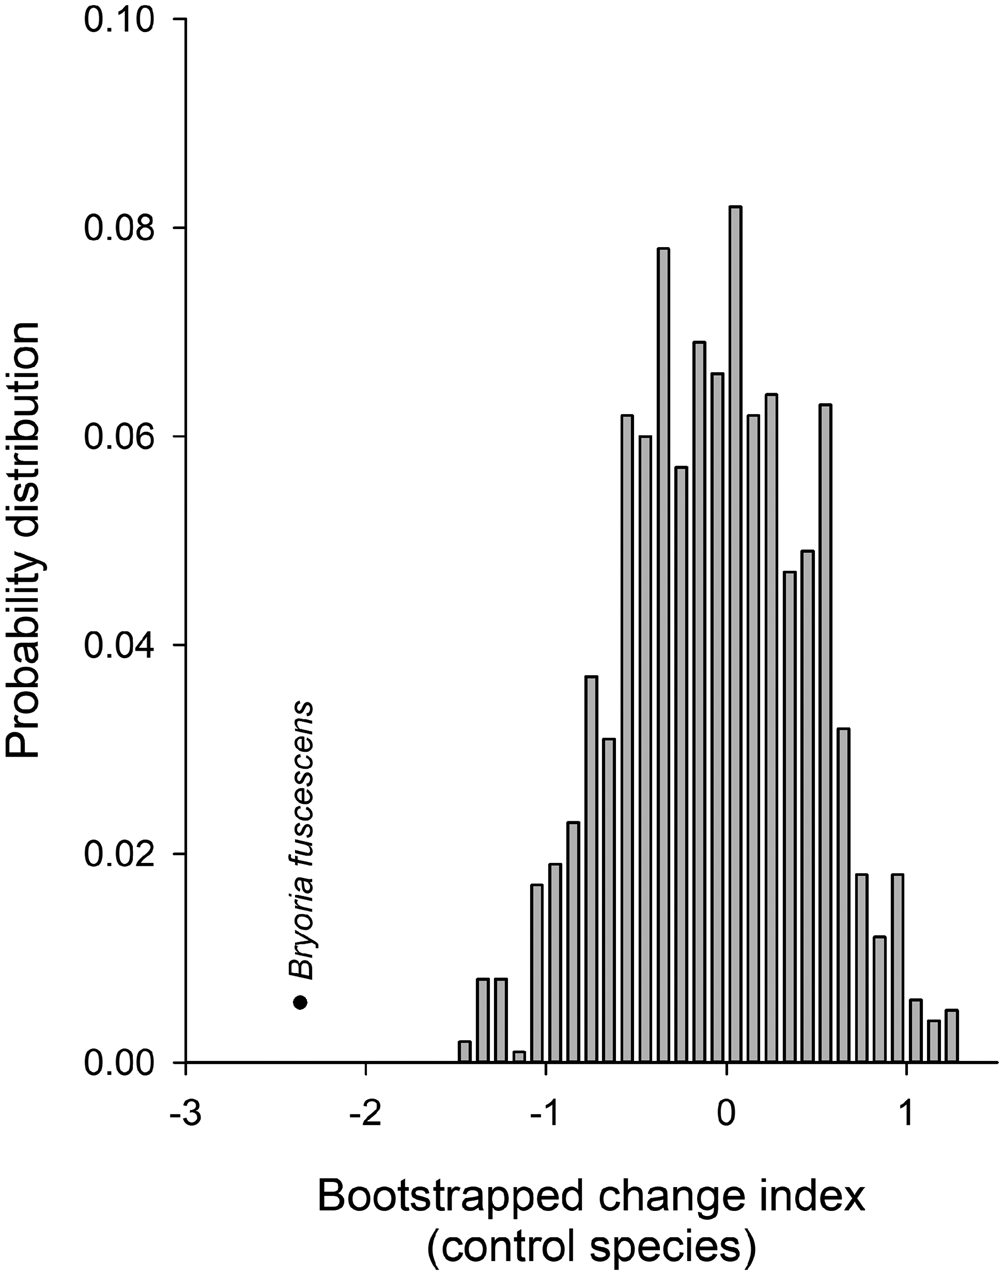
Tested using the Telfer–Preston–Rothery method of trend analysis, the impacts of sulphur dioxide and nitrogen air pollution are coincident with a decline in the regional extent of Bryoria fuscescens, which had a negative (standardized) change index of −2.37, relative to recording effort inferred over the period 1970–2010 (Fig. 4), and which is significantly different from the control species values which had a lower 95% confidence interval of −1.05.
Comparison of the change index for Bryoria fuscescens (symbol), with the bootstrapped distribution of values for control species as a proxy for recording effort, and indicating a decrease in occupancy across UK grid cells.

Discussion
Species distributions can be expected to be dynamic over time and shaped in response to a changing environment. This obvious point confounds the recognition of baselines that are a bedrock of species distribution modelling, and assumptions of stability and equilibrium. Although a detailed interpretation of the relative importance of different predictors is governed by our choice of case-study species, it seems clear that the relative importance of different predictors can, in general terms, be confirmed to change over time. This effect is detectable across time periods at sub-decadal scales based on distributions that emerge when combining field recording data for a lichen epiphyte in the UK.
More specifically, a first observation relates to the importance of climate in shaping the species distribution. Bioclimatic models often predict distributions focusing on climate as the main (or only) predictor (Ellis et al. Reference Ellis, Coppins, Dawson and Seaward2007; Allen & Lendemer Reference Allen and Lendemer2016; Rubio-Salcedo et al. Reference Rubio-Salcedo, Psomas, Prieto, Zimmermann and Martínez2017), although partitioning community structure suggests that the effects of climate are moderated by prevailing pollution and habitat conditions (cf. McCune et al. Reference McCune, Daey, Peck, Heiman and Will-Wolf1997; Will-Wolf et al. Reference Will-Wolf, Jovan, Neitlich, Peck and Rosentreter2015, Reference Will-Wolf, Jovan, Nelsen, Trest, Rolih and Reis2018; Smith et al. Reference Smith, Jovan, Stanton and Will-Wolf2020). This favours the ongoing development of multivariate bioclimatic models that combine different global change predictors. Examples include the combined effects of climate change plus invasive pests and pathogens affecting forest composition (Ellis et al. Reference Ellis, Eaton, Theodoropoulos, Coppins, Seaward and Simkin2014b; Nascimbene et al. Reference Nascimbene, Benesperi, Casazza, Chiarucci and Giordani2020). However, even within the complex environmental situation represented by the UK, where pollution and habitat loss have both had widespread effects over many centuries (Ellis et al. Reference Ellis, Yahr and Coppins2011, Reference Ellis, Yahr and Coppins2018), climate is nevertheless supported in our results as a consistent predictor for the recent (post-industrial) distribution of Bryoria fuscescens. This attests to the importance of human-induced climate change as a driver of species distributions and a risk factor for lichens.
A second observation relates to the interpretation of pollution effects although, in common with other studies based on reconstructed historical pollution trends (Russ et al. Reference Russ, Cherrie, Dibben, Tomlinson, Reis, Dragosits, Vieno, Beck, Carnell and Shortt2021), these currently lack uncertainty estimates. Being an acidophyte (Otnyukova & Sekretenko Reference Otnyukova and Sekretenko2008; Manninen Reference Manninen2018) and also having an ‘alectorioid’ or ‘hair-lichen’ morphology (Geiser et al. Reference Geiser, Nelson, Jovan, Root and Clark2019), Bryoria fuscescens is expected to be among the most sensitive lichens to excess atmospheric nitrogen (Delves et al. Reference Delves, Lewis, Ali, Asad, Chatterjee, Crittenden, Jones, Kiran, Pandey and Reay2023). The modelled values used here (Fig. 3) begin to exceed a critical level for lichen epiphytes, estimated from meta-analysis at c. 8.26 kg N ha−1 yr−1 (Ellis et al. Reference Ellis, Steadman, Vieno, Chatterjee, Jones, Negi, Pandey, Rai, Tshering and Weerakoon2022), as early as 1900. The acute sensitivity traits of Bryoria fuscescens can explain the relatively high importance of nitrogen as a predictor for its distribution since at least the 1970s, and prior to peak deposition values in the 1990s. Nitrogen deposition is expected to continue to affect Bryoria fuscescens after the 1990 peak since, although nitrogen emissions have begun to stabilize or fall (Matejko et al. Reference Matejko, Dore, Hall, Dore, Bɫaś, Kryza, Smith and Fowler2009; Tomlinson et al. Reference Tomlinson, Carnell, Dore and Dragosits2021), most of the reduction in UK regional nitrogen deposition will be a result of reducing emissions of nitrogen oxides (NOx), with more modest reductions in emissions of ammonia (NH3) (Sutton et al. Reference Sutton, van Dijk, Levy, Jones, Leith, Sheppard, Leeson, Tang, Stephens and Braban2020). Previous studies have partitioned and demonstrated the importance of these different nitrogen types (Will-Wolf et al. Reference Will-Wolf, Jovan, Neitlich, Peck and Rosentreter2015; Smith et al. Reference Smith, Jovan, Stanton and Will-Wolf2020) and, although not tested here, sustained high levels of reduced nitrogen compounds are likely to affect Bryoria fuscescens while being hidden within the averaged trend of declining total nitrogen deposition (Sutton et al. Reference Sutton, van Dijk, Levy, Jones, Leith, Sheppard, Leeson, Tang, Stephens and Braban2020). Notwithstanding the changing contributions of different nitrogen compounds, total deposition remains broadly useful as an integrated measure of nitrogen supply (Jovan et al. Reference Jovan, Riddell, Padgett and Nash2012) and our results are consistent with multiple forms of nitrogen having had a cumulative effect on lichen epiphytes (Cleavitt et al. Reference Cleavitt, Hinds, Poirot, Geiser, Dibble, Leon, Perron and Pardo2015), with impacts that continue to accrue today through a strengthening legacy of previously high values.
The relative importance of nitrogen is conditional on the co-occurring effect of sulphur dioxide, which appears to have had its strongest relative importance as a predictor following peak values in the 1970s, and which presumably represented a threshold for impacting Bryoria fuscescens (Tarhanen et al. Reference Tarhanen, Poikolainen, Holopainen and Oksanen2000; Häffner et al. Reference Häffner, Lomský, Hynek, Hällgren, Batič and Pfanz2001) beyond the already occurring effects of nitrogen, and with a decadal-scale lag-effect that may be related to delayed colonization when repopulating from a severely depleted range (Weldon & Grandin Reference Weldon and Grandin2021). Underscoring complexity when interpreting this dynamic response to multivariate drivers, the lag-effect importance of sulphur dioxide in the 1990s appears to reduce the relative importance of nitrogen, at the point when values for nitrogen deposition peak.
Although a direct attribution of the changing Bryoria fuscescens distribution is confounded by spatial and temporal covariance in environmental predictors, cautiously interpreted here in an information-theoretic framework using multimodal inference, our conclusions are validated by comparable studies elsewhere in Europe. The combined importance of both climate and nitrogen pollution are consistent with research from Scandinavia, demonstrating a negative response of Bryoria fuscescens to both warmer temperatures and increasing total nitrogen deposition (Esseen et al. Reference Esseen, Ekström, Westerlund, Palmqvist, Jonsson, Grafström and Ståhl2016, Reference Esseen, Ekström, Grafström, Jonsson, Palmqvist, Westerlund and Ståhl2022). Furthermore, a trend analysis benchmarked against recording effort appeared to confirm the anecdotal decline in the distribution of Bryoria fuscescens over the past 50 years in the UK. This contrasts with the general increase in lichens as a guild (especially in England) that was observed by Outhwaite et al. (Reference Outhwaite, Gregory, Chandler, Collen and Isaac2020) and recorded in the UK State of Nature reports for 2019 and 2023 (Hayhow et al. Reference Hayhow, Eaton, Stanbury, Burns, Kirby, Bailey, Beckmann, Bedford, Boersch-Supan and Coomber2019; Burns et al. Reference Burns, Mordue, al Fulaij, Boersch-Supan, Boswell, Boyd, Bradfer-Lawrence, de Ornellas, de Palma and de Zylva2023), further emphasizing a need to balance trends for the lichen guild as a whole, against threats to individual species, especially where these can be linked to known environmental drivers.
In summary, our results confirm i) that a dynamic response of lichens can be cautiously detected at a sub-decadal scale within the UK, in response to multivariate environmental predictors that change in relative importance over time, ii) that climate is consistently important as a predictor, and the relative importance of nitrogen pollution remains high despite stabilized or declining emissions, and iii) for our case-study species of Bryoria fuscescens, we can attribute a persistent decline in its UK distribution to climate change and warming temperatures (noting that the mean minimum temperature increased from 4.99 °C in the 1970s, to 5.38 °C and 5.49 °C in the 1990s and 2010s, respectively), as well as to the legacy effects of sulphur dioxide and the accruing impacts of long-term nitrogen pollution. We add that a further potentially important predictor (not considered here owing to a lack of appropriate time-series data) is the effect of changing woodland spatial-temporal structure, especially since Bryoria fuscescens is considered an indicator of ecological continuity (Coppins & Coppins Reference Coppins and Coppins2002; Ellis Reference Ellis2015), so that its decline may be influenced by the extensive threat to European ancient woodland (Rackham Reference Rackham2008). Finally, we caution that an ability to resolve lichen status and trends at the same resolution as dynamic environmental change depends on systematic field recording that is spatially balanced along relevant environmental gradients. Field recording in the UK has often been supported by the activities of specialist societies (in the case of this study, the British Lichen Society), and there is an ongoing requirement to maintain field identification skills and recording effort to future proof trend analysis appropriate to conservation targets.
Acknowledgements
The study was made possible by Scottish Government (SG) grant-in-aid to the Royal Botanic Garden Edinburgh, contributing to the Strategic Research Programme of the SG's Rural and Environmental Science and Analytical Services (RESAS), and indirectly benefited from funding provided to ST and MAS from within the UKRI's Global Challenges Research Fund ‘South Asia Nitrogen Hub’. We thank Robert Smith and an anonymous reviewer for their constructive and helpful comments to improve the original submitted manuscript.
Author ORCID
Christopher J. Ellis, 0000-0003-1916-8746; Sam Tomlinson, 0000-0002-3237-7596; Edward J. Carnell, 0000-0003-0870-1955; Mark A. Sutton, 0000-0002-1342-2072.
Competing Interests
The authors declare none.