

Introduction
Large carnivores are keystone species whose conservation benefits the broader ecosystem (Farashi & Shariati, Reference Farashi and Shariati2018) and whose charisma fuels their protection. However, conflict can arise where there is overlap between large carnivores and local communities (Sommers et al., Reference Sommers, Price, Urbigkit and Peterson2010; Engel et al., Reference Engel, Vaske, Bath and Marchini2017; Ramesh et al., Reference Ramesh, Kalle, Milda, Gayathri, Thanikodi, Ashish and Giordano2020). Many local people rely on livestock for their livelihoods and livestock depredation is a key driver of human–wildlife conflict (Lute et al., Reference Lute, Carter, López-Bao and Linnell2018). Whilst a reduction in the number of livestock lost is often used as an indicator of successful coexistence (Bagchi & Mishra, Reference Bagchi and Mishra2006; van Eeden et al., Reference van Eeden, Eklund, Miller, López-Bao, Chapron and Cejtin2018b), there is also a need to address perceived conflict. Studies have shown a mismatch between perceived and actual levels of human–carnivore conflicts (Dickman, Reference Dickman2010). For example, intangible psychological costs such as fear and risk have been demonstrated as far more significant when explaining attitudes towards wildlife than tangible costs such as the number of livestock lost to depredation (Kansky et al., Reference Kansky, Kidd and Knight2014).
Attitude research is one way in which local perspectives towards large carnivores can be captured and incorporated into plans for coexistence. Attitude can be understood as a continuum referring to the tendency to respond with some degree of favourableness, or lack thereof, to an object, person or behaviour (Fishbein & Ajzen, Reference Fishbein and Ajzen2010). Although an individual’s attitude can influence the actions they take, it is not interchangeable with behaviour (Lai & Nepal, Reference Lai and Nepal2006; Kareiva & Marvier, Reference Kareiva and Marvier2012). Instead, attitude can be considered a condition for behaviour (Heberlein, Reference Heberlein2012), which is important when considering how local communities view large carnivores and will engage with plans for coexistence.
The snow leopard Panthera uncia is a keystone species found in 12 countries across Asia (McCarthy et al., Reference McCarthy, Mallon, Zahler and McCarthy2017). It is categorized as Vulnerable on the IUCN Red List (McCarthy et al., Reference McCarthy, Mallon, Zahler and McCarthy2017), with a decreasing population and a progressively diminishing habitat under climate change (Forrest et al., Reference Forrest, Wikramanayake, Shrestha, Areendran, Gyeltshen and Maheshwari2012). Prey includes wild ungulates such as bharal Pseudois nayaur, Siberian ibex Capra sibrica, Himalayan tahr Hemitragus jemlahicu and argali Ovis ammon, as well as small-bodied domestic livestock such as goats Capra hircus and sheep Ovis aries, and large-bodied domestic livestock such as yak Bos grunniens, horse Equus caballus and cattle Bos taurus (Oli et al., Reference Oli, Taylor and Rogers1993). Livestock depredation by the snow leopard has been documented in Nepal (Wegge et al., Reference Wegge, Wegge, Shrestha and Flagstad2012; Devkota et al., Reference Devkota, Silwal and Kolejka2013; Chetri et al., Reference Chetri, Odden, Devineau and Wegge2019; Kusi et al., Reference Kusi, Sillero-Zubiri, Macdonald, Johnson and Werhahn2020), placing a financial burden on remote herding communities. Previous studies of attitudes towards snow leopards in Nepal have reported that the species is viewed as a problematic carnivore by some local communities (Kusi et al., Reference Kusi, Sillero-Zubiri, Macdonald, Johnson and Werhahn2020), whereas others found that positive attitudes have increased over time (Oli et al., Reference Oli, Taylor and Rogers1994; Hanson et al., Reference Hanson, Schutgens and Leader-Williams2019; Shahi et al., Reference Shahi, Aryal, Blon and Khanal2023).
We aimed to contribute to snow leopard conservation by investigating local attitudes, identifying the factors that best explain these attitudes and establishing what determines them. Our results will help to inform strategies that mitigate livestock depredation and promote coexistence between snow leopards and people.
Study area
Shey Phoksundo National Park is a remote protected area in the Dolpo district of Nepal (Fig. 1). It is the largest national park in Nepal, spanning 3,555 km2, with an additional 1,350 km2 in the surrounding buffer zone (DNPWC, 2017). There are two main divisions in this region with differing geographic conditions: the lower Dolpo receives 1,500 mm of rain annually and supports a mixed broadleaf and coniferous forest, whereas the upper Dolpo lies in the rain shadow of Tibet and receives 500 mm of rain annually (Khanal et al., Reference Khanal, Mishra and Ramesh Suryawanshi2020). There is rich biodiversity including nearly 200 bird species and 32 species of mammal (Kusi et al., Reference Kusi, Werhahn and Poudyal2018), many of which are vulnerable to extinction such as the snow leopard, grey wolf Canis lupus, brown bear Ursus arctos and Alpine musk deer Moschus chrysogaster (Devkota et al., Reference Devkota, Silwal and Kolejka2013).
The study area of Shey Phoksundo National Park, divided into upper Dolpo and lower Dolpo, with locations of village clusters and main trekking route.

The main sources of income for communities living in Shey Phoksundo National Park include livestock husbandry, agriculture and the collection of yartsa, the caterpillar fungus Ophiocordyceps sinensis (Kusi et al., Reference Kusi, Sillero-Zubiri, Macdonald, Johnson and Werhahn2020). Lower Dolpo is home to c. 550 people spread across four village clusters. These communities have reduced their holdings of small livestock (sheep and goats) because of increasing tourism but still rear large livestock (yaks, horses, cattle; Khanal et al., Reference Khanal, Mishra and Ramesh Suryawanshi2020). In upper Dolpo, there are > 2,500 inhabitants and fewer opportunities for tourism. On average each household rears 40 mixed livestock (Khanal et al., Reference Khanal, Mishra and Ramesh Suryawanshi2020). The dominant religion of people in this region is Bon, the Indigenous religion of Tibet.
The Dolpo district is thought to be home to the highest densities of snow leopards in the country, particularly upper Dolpo, where maximum estimates range from 2.5 to 3.2 individuals per 100 km2 (DNPWC, 2017; Khanal et al., Reference Khanal, Mishra and Ramesh Suryawanshi2020). Potential snow leopard habitat covers 90% of the protected area (DNPWC, 2017), making this a significant area for the future of snow leopard conservation. Livestock depredation has been recorded in Shey Phoksundo National Park for some time (Devkota et al., Reference Devkota, Silwal and Kolejka2013; Khanal et al., Reference Khanal, Mishra and Ramesh Suryawanshi2020) leading the Department of National Parks and Wildlife Conservation, partnered with World Wildlife Fund Nepal, to implement snow leopard conservation initiatives in 2018, mainly to address human–snow leopard conflict. These include predator-proof night corrals for livestock, education initiatives, a wildlife damage relief fund and livelihood support such as homestay promotion and hotel management training (Shrestha & Gurung, Reference Shrestha and Gurung2022).
Methods
Questionnaire survey
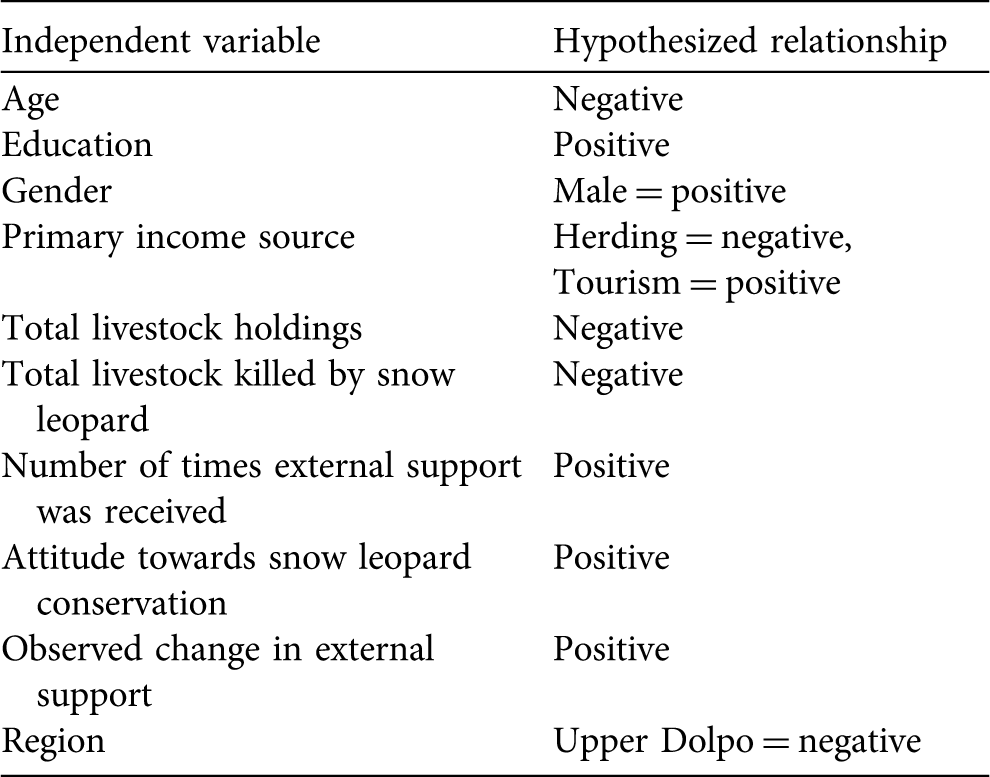
We designed a targeted questionnaire using quantitative, closed-ended questions and some open-ended questions to capture the reasoning behind certain responses in greater detail (Supplementary Material 1; White et al., Reference White, Jennings, Renwick and Barker2005). We identified 10 potential explanatory variables and hypothesized their relationships to attitude (Table 1). We formulated questions to explore six themes of human–wildlife conflict: (1) socio-demographic characteristics, (2) livestock holdings, (3) snow leopards and livestock depredation, (4) attitudes towards snow leopards, (5) livestock husbandry and mitigation techniques, and (6) attitudes towards snow leopard conservation (Zimmermann et al., Reference Zimmermann, Walpole and Leader-Williams2005; Suryawanshi et al., Reference Suryawanshi, Bhatia, Bhatnagar, Redpath and Mishra2014; Hanson et al., Reference Hanson, Schutgens and Leader-Williams2019; Kusi et al., Reference Kusi, Sillero-Zubiri, Macdonald, Johnson and Werhahn2020; Uduman et al., Reference Uduman, Hagerman, Edward, Watson, Kittle and Burton2021; Shahi et al., Reference Shahi, Aryal, Blon and Khanal2023). To record livestock depredation, we asked respondents to describe the visual signs of snow leopard kills as opposed to attacks by other large carnivores such as wolves. These included scat or pug marks, ventral portion of neck injured or direct sighting of a snow leopard. The questionnaire was field-tested prior to implementation by two local research assistants, and questions were modified for greater clarity (Hacker et al., Reference Hacker, Dai, Cheng, Zhang, Zhang, Miller and Janecka2020).
Ten independent variables hypothesized to influence attitudes towards snow leopards Panthera uncia in Shey Phoksundo National Park, Nepal, and the direction of the relationship.

Table 1 Long description
A table with two columns and ten rows. The first column is labeled ‘Independent variable’ and the second column is labeled ‘Hypothesized relationship’. Row 1: Age, Negative. Row 2: Education, Positive. Row 3: Gender, Males = positive. Row 4: Primary income source, Herding = negative, Tourism = positive. Row 5: Total livestock holdings, Negative. Row 6: Total livestock killed by snow leopard, Negative. Row 7: Number of times external support was received, Positive. Row 8: Attitude towards snow leopard conservation, Positive. Row 9: Observed change in external support, Positive. Row 10: Region, Upper Dolpo = negative.
The questionnaire captured respondents’ attitudes towards snow leopards from 12 statements ranked on a 3-point Likert scale of disagree, neutral and agree (Likert et al., Reference Likert, Roslow and Murphy1934), ensuring there were both positive and negative statements (Supplementary Material 1; Dunlap et al., Reference Dunlap, Van Liere, Mertig and Jones2000). If a respondent did not wish to answer a question, they were given the option to select ‘Don’t know’, and their response was not included in further analysis. A 3-point scale was selected to make the choice straightforward for respondents who were unfamiliar with research methods (Shaaban, Reference Shaaban2019). Previous studies found that respondents with low literacy and education levels, as those we expected to encounter in our study, have difficulties distinguishing between categories in 5-point scales, with responses mirroring a 3-point scale even when a 5-point scale was used (Chachamovich et al., Reference Chachamovich, Fleck and Power2009). A University of Waterloo ethics approval was completed prior to fieldwork (ORE#43202), and all responses were treated confidentially, with no identifying information reported to ensure respondents’ anonymity.
We conducted a 5-week survey along the main trekking route in Shey Phoksundo National Park during May–June 2022. We aimed to interview 10–15% of the 772 total households in Shey Phoksundo National Park (Khanal et al., Reference Khanal, Mishra and Ramesh Suryawanshi2020). This trekking route was selected to focus on our target population in two major village clusters in lower Dolpo (Phoksundo and Dho Tarap) and one major village cluster in upper Dolpo (Saldang). Upon arrival at a village cluster, we selected a household randomly and identified a potential participant using head of household and owner of livestock as inclusion criteria. We then employed a snowball sampling approach to identify additional heads of households who were currently available in each village cluster (Sadler et al., Reference Sadler, Lee, Kim and Fullerton2010). The questionnaire was written in English and conducted verbally in Dolpo, the local language spoken by residents, by two research assistants who were fluent in both English and Dolpo. The interviews were conducted at the location most convenient for the respondent, and responses were recorded on paper. Using this approach, we completed a total of 105 questionnaires in lower Dolpo (n = 60) and upper Dolpo (n = 45).
Data analysis
We analysed responses from lower and upper Dolpo separately to investigate the differences between the two regions. We calculated the mean livestock holding per household and used the number of depredation events over the previous 3 years (July 2019–June 2022) to compare depredation rates between lower and upper Dolpo. This ensured that variations in respondents’ recall did not influence the frequency and severity of depredation being reported (Ikeda, Reference Ikeda2004; Shahi et al., Reference Shahi, Aryal, Blon and Khanal2023). We calculated the total number of livestock lost to snow leopard depredation over 3 years from the questionnaire responses. Depredation had a non-normal distribution, so we employed a Mann–Whitney U test to assess the difference in livestock depredation between the lower and upper Dolpo. To examine the significance of livestock depredation in a single year, and ensure results were comparable with similar research in Shey Phoksundo National Park (Devkota et al., Reference Devkota, Silwal and Kolejka2013; Khanal et al., Reference Khanal, Mishra and Ramesh Suryawanshi2020; Kusi et al., Reference Kusi, Sillero-Zubiri, Macdonald, Johnson and Werhahn2020), we also calculated the proportion of total livestock holdings lost to snow leopard depredation by dividing the sum of total livestock lost in lower and upper Dolpo for the most recent year at the time of data collection by the sum of total livestock holdings (July 2021–June 2022).
We categorized the responses to the 12 attitude statements by region then summed and divided by the total number of responses for the lower and upper Dolpo separately to determine the percentage of negative, neutral and positive responses. We compared attitude statement responses between regions using a χ 2 test in R 4.2.2 (R Core Team, 2023). We used a Fisher’s exact test for those cases with expected values < 5 (Mchugh, Reference Mchugh2013) as it can be used for small sample sizes with comparable P values (Hess & Hess, Reference Hess and Hess2017).
We combined attitude statements into a composite score for each respondent, which we treated as continuous data. This follows a growing trend in attitudinal research methods for large carnivores (Zimmermann et al., Reference Zimmermann, Walpole and Leader-Williams2005; Suryawanshi et al., Reference Suryawanshi, Bhatia, Bhatnagar, Redpath and Mishra2014; Hacker et al., Reference Hacker, Dai, Cheng, Zhang, Zhang, Miller and Janecka2020; Hanson et al., Reference Hanson, Schutgens, Lama, Aryal and Dhakal2020; Uduman et al., Reference Uduman, Hagerman, Edward, Watson, Kittle and Burton2021). We examined the internal consistency of this composite attitude score using Cronbach’s alpha (α), with a score > 0.7 considered to indicate a satisfactory level of internal consistency (Bland & Altman, Reference Bland and Altman1997). Of the 12 initial attitude statements, two were removed from the analysis prior to calculating the alpha score as one proved to be a neutral statement and subsequent scoring was not possible, and the second had no variance in response. The final score (n = 105) was α = 0.71 (95% CI 0.61–0.78), based on the 10 attitude statements retained, indicating sufficient internal consistency. This process was repeated for the two potential explanatory variables under the theme snow leopard conservation. The variable indicating mitigation measures was not internally reliable (α = 0.34, 95% CI 0.15–0.52) and was excluded from further analysis, whereas the observed change in external support proved reliable (α = 0.80, 95% CI 0.72–0.86) and was retained.
We coded positive statements as follows: agree = +1 neutral = 0, and disagree = −1. Negative statements used reverse coding. This allowed for the summation of 10 attitude statements with a possible composite score ranging from +10 to −10, whereby a score of +10 indicates a wholly positive attitude and −10 indicates a wholly negative attitude. Respondents who were unsure had the option to select ‘Don’t know’. We removed data from respondents who selected ‘Don’t know’ for any statement as it could not be coded and averaging would heavily skew subsequent analysis because of the large number of unsure responses. This considerably reduced the total sample size included in the analysis (n = 59).
We examined the relationship between each of our explanatory variables and respondent attitude using a simple linear regression. We used a dummy coding system for categorical variables such as region, whereby lower Dolpo = 0 and upper Dolpo = 1. We then ran a multiple linear regression to explore if a combination of variables better explained attitude than a single variable, using Akaike’s information criterion corrected for small sample sizes (AICc) to rank the performance of candidate models. Values of AICc are often used in explanatory rather than predictive models, such as when a range of variables are being explored for their association with a given trait (Symonds & Moussalli, Reference Symonds and Moussalli2011), and have been used for model selection in similar human–wildlife conflict analysis (Zimmermann et al., Reference Zimmermann, Walpole and Leader-Williams2005; Broekhuis et al., Reference Broekhuis, Kaelo, Sakat and Elliot2020; Uduman et al., Reference Uduman, Hagerman, Edward, Watson, Kittle and Burton2021). The relationship amongst variables was examined prior to modelling with the polycor package in R (Fox, Reference Fox2022) using Pearson’s correlation coefficients. We removed one variable from each pair of highly correlated variables (r > 0.5) from further analysis. Total livestock holdings and total livestock killed by snow leopards were highly correlated, and total holdings was removed. The seven predictor variables used in the multiple linear regression were: region, years of education, number of times external support was received, observed change in external support, gender, age, and total number of livestock killed by snow leopards. All possible models were examined using a best subset technique selecting the top four models with each addition of an independent variable. Models shown are within three AICc units of the model with the lowest AICc value. In addition, we conducted a forward, backward and mixed stepwise regression to examine whether the final model selection differed between the various approaches. The simple and multiple linear regressions were conducted in JMP 14 (SAS Institute Inc, 2019).
Results
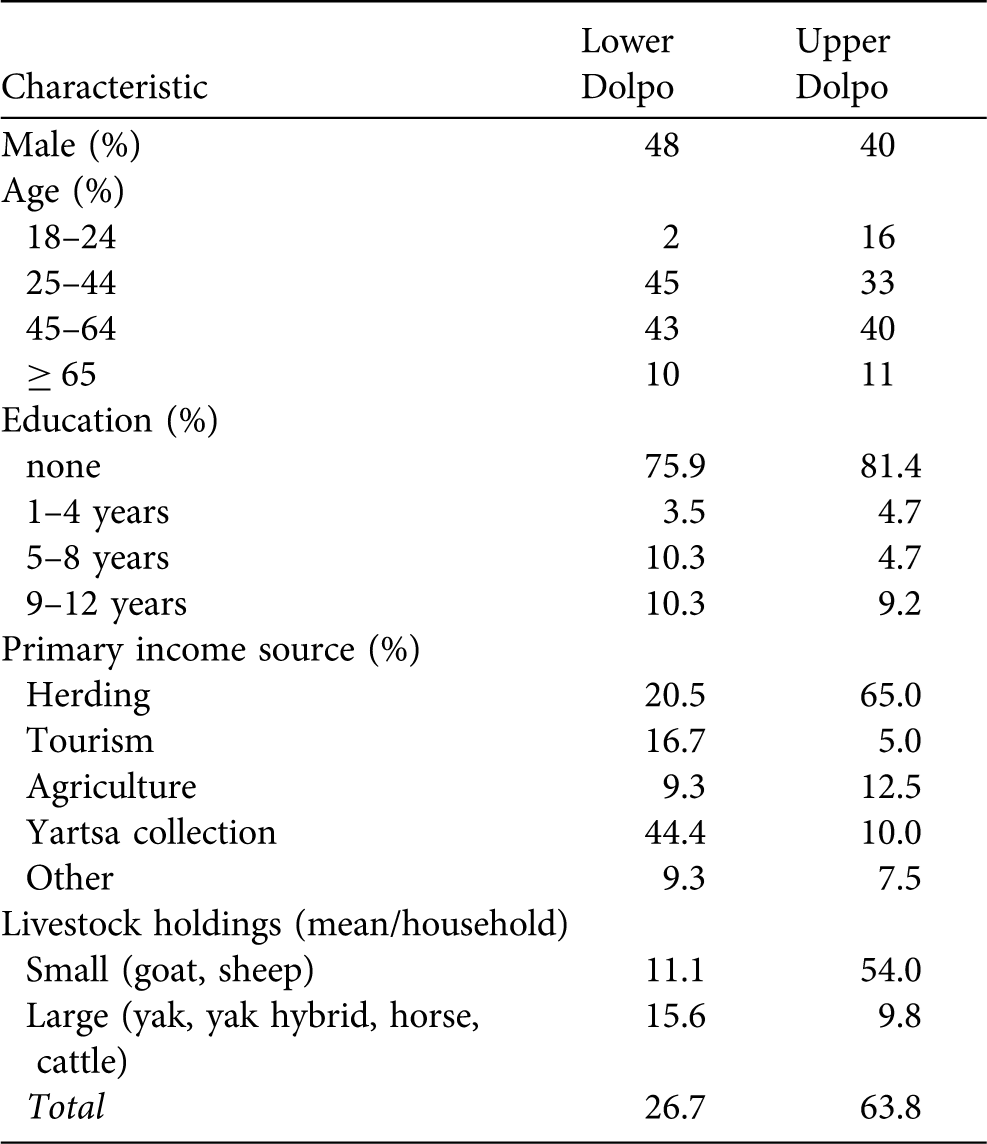
We compared respondent demographics from households in lower and upper Dolpo that participated in our questionnaire survey in 2022 (Table 2). There were slightly fewer male respondents in both lower (48%) and upper Dolpo (40%). Most respondents had no education in both lower (76%) and upper Dolpo (81%). Most participants were 25–64 years old: in lower Dolpo 45% were 25–44 years old and 33% were aged 45–64 years; in upper Dolpo respondents aged 25–44 years comprised 43% and those aged 45–64 years 40% of the total. The most common primary source of income in lower Dolpo was yartsa collection (44%), whereas in upper Dolpo it was livestock herding (65%). Households in lower Dolpo owned a mean of 27 animals, with the majority being large-bodied livestock (yaks, horses, cattle); in upper Dolpo the mean was 64 livestock per household, with the majority being small-bodied (sheep and goats).
Demographics of questionnaire respondents in lower Dolpo (n = 60) and upper Dolpo (n = 45) in Shey Phoksundo National Park, Nepal.

Table 2 Long description
The table compares demographics of questionnaire respondents in lower and upper Dolpo. It has 10 rows and 3 columns. The columns are labeled ‘Characteristic’, ‘Lower Dolpo’, and ‘Upper Dolpo’. The rows are labeled with different characteristics such as Male (percent), Age (percent), Education (percent), Primary income source (percent), and Livestock holdings (mean/household). Row 1: Male (percent), Lower Dolpo: 48, Upper Dolpo: 40. Row 2: Age (percent), 18-24, Lower Dolpo: 2, Upper Dolpo: 16. Row 3: Age (percent), 25-44, Lower Dolpo: 45, Upper Dolpo: 33. Row 4: Age (percent), 45-64, Lower Dolpo: 43, Upper Dolpo: 40. Row 5: Age (percent), >= 65, Lower Dolpo: 10, Upper Dolpo: 11. Row 6: Education (percent), none, Lower Dolpo: 75.9, Upper Dolpo: 81.4. Row 7: Education (percent), 1-4 years, Lower Dolpo: 3.5, Upper Dolpo: 4.7. Row 8: Education (percent), 5-8 years, Lower Dolpo: 10.3, Upper Dolpo: 4.7. Row 9: Education (percent), 9-12 years, Lower Dolpo: 10.3, Upper Dolpo: 9.2. Row 10: Primary income source (percent), Herding, Lower Dolpo: 20.5, Upper Dolpo: 65.0. Row 11: Primary income source (percent), Tourism, Lower Dolpo: 16.7, Upper Dolpo: 5.0. Row 12: Primary income source (percent), Agriculture, Lower Dolpo: 9.3, Upper Dolpo: 12.5. Row 13: Primary income source (percent), Yartsa collection, Lower Dolpo: 44.4, Upper Dolpo: 10.0. Row 14: Primary income source (percent), Other, Lower Dolpo: 9.3, Upper Dolpo: 7.5. Row 15: Livestock holdings (mean/household), Small (goats, sheep), Lower Dolpo: 11.1, Upper Dolpo: 54.0. Row 16: Livestock holdings (mean/household), Large (yak, yak hybrid, horse, cattle), Lower Dolpo: 15.6, Upper Dolpo: 9.8. Row 17: Livestock holdings (mean/household), Total, Lower Dolpo: 26.7, Upper Dolpo: 63.8.
Over three-quarters of respondents (77%) believed there were more snow leopards in Shey Phoksundo National Park at the time of the interviews (2022) than 5 years previously. Most respondents (93%) had experienced livestock depredation by snow leopards. Following a depredation event, most households (90%) increased their presence around livestock to better protect their animals; additional strategies included relocating livestock (75%) and using guard dogs (50%). The livestock most commonly killed by snow leopards were goats and sheep (81%) followed by yaks and yak hybrids (12%). Over the preceding 3 years (July 2019–June 2022), a total of 843 livestock were killed by snow leopards from our sample of households in Dolpo, with a mean of 2.7 livestock killed annually per household. Households in lower Dolpo lost a mean of 1.3 livestock annually (5% of total livestock holdings), whereas households in upper Dolpo lost a mean of 4.5 livestock annually (7% of total livestock holdings). The results from the Mann–Whitney U test showed a significant difference in depredation levels between the two regions (U = 624.5, lower Dolpo = 60, upper Dolpo = 45, P = 2.294 × 10⁻⁶).
Attitude towards snow leopards
Respondents living in lower Dolpo showed a more favourable attitude towards the snow leopard than those living in upper Dolpo (Table 3), with a significant difference in responses to seven of the 10 attitude statements. The biggest difference between people from lower and upper Dolpo was in the responses to the statement ‘I would be happier if zero snow leopards lived in Shey Phoksundo in the future’ (χ 2 = 30.710, P < 0.000; Cramer’s V = 0.55). Most respondents living in lower Dolpo disagreed with this statement, indicating a positive attitude towards snow leopards (78%), whereas fewer than one-third of upper Dolpo respondents disagreed (29%). There was also a significant difference between responses to the statement ‘Snow leopards deserve protection’ (χ 2 = 19.298, P < 0.000, Cramer’s V = 0.43), with most respondents (80%) in lower Dolpo agreeing, compared to 38% agreement from respondents in upper Dolpo. In addition, there were significant differences between the regions in responses to the statements ‘Snow leopards killing livestock is an acceptable risk to herding’ (Fisher’s exact test, P < 0.000, Cramer’s V = 0.46; 92% of respondents in lower Dolpo agreed; 53% in upper Dolpo) and ‘The nature and wildlife in Shey Phoksundo should be conserved’ (Fisher’s exact test, P = 0.001, Cramer’s V = 0.37; 92% agreed in lower Dolpo; 62% in upper Dolpo).
Per cent responses to snow leopard attitude statements from respondents in lower Dolpo (L, n = 60) and upper Dolpo (U, n = 45), Shey Phoksundo National Park, Nepal, using χ 2 to test for independence (or Fisher’s exact test if at least one expected frequency was < 5) and Cramer’s V to test the strength of the relationships. All responses of ‘Don’t know’ were excluded from the analysis, which accounts for the difference between row totals and 100. See Supplementary Material 1 for questionnaire details. Statistically significant effects (P < 0.05) are marked with an asterisk.

Table 3 Long description
A table with 10 rows and 10 columns comparing responses to snow leopard attitude statements from respondents in lower Dolpo (L) and upper Dolpo (U), Shey Phoksundo National Park, Nepal. The columns are labeled Agree, Neutral, Disagree, and Statistics. The row labels are attitude statements. The table includes values for L and U under Agree, Neutral, and Disagree, and statistics including chi-squared (χ²), P, and Cramer’s V. Row 1: The nature and wildlife in Shey Phoksundo is a global treasure; Agree L 92, U 71, Neutral L 3, U 18, Disagree L 2, U 7; Statistics χ² 0.009*, P 0.293. Row 2: The nature and wildlife in Shey Phoksundo should be conserved; Agree L 92, U 62, Neutral L 3, U 22, Disagree L 2, U 9; Statistics χ² 0.001*, P 0.370. Row 3: If someone loses their livestock in a mass killing, it is okay for them to kill the snow leopard; Agree L 12, U 16, Neutral L 32, U 44, Disagree L 35, U 24; Statistics χ² 2.223, P 0.329, V 0.162. Row 4: Snow leopards provide benefits to my household; Agree L 30, U 9, Neutral L 20, U 20, Disagree L 45, U 69; Statistics χ² 8.074, P 0.018*, V 0.283. Row 5: My livelihood is more important than snow leopards; Agree L 43, U 51, Neutral L 35, U 33, Disagree L 5, U 4; Statistics χ² 0.883, P 0.055. Row 6: In this household, we cannot tolerate snow leopards killing a single livestock; Agree L 32, U 42, Neutral L 23, U 16, Disagree L 32, U 36; Statistics χ² 1.544, P 0.462, V 0.128. Row 7: I would be happier if zero snow leopards lived in Shey Phoksundo in the future; Agree L 13, U 36, Neutral L 3, U 33, Disagree L 78, U 29; Statistics χ² 30.710, P 0.000*, V 0.551. Row 8: Snow leopards killing livestock is an acceptable risk to herding (if it is not mass killing); Agree L 92, U 53, Neutral L 3, U 18, Disagree L 2, U 22; Statistics χ² 0.000*, P 0.459. Row 9: Snow leopards mass killing livestock is a problem that local authorities need to address; Agree L 78, U 71, Neutral L 8, U 13, Disagree L 2, U 2; Statistics χ² 9.427, P 0.009*, V 0.288. Row 10: Snow leopards deserve protection; Agree L 80, U 38, Neutral L 10, U 29, Disagree L 7, U 27; Statistics χ² 19.298, P 0.000*, V 0.439.
Determinants of attitude
Values from the composite attitude score ranged from −4 (negative) to +10 (wholly positive) with a mean of 3.71 ± SE 3.59, showing overall more positive attitudes towards snow leopards in Shey Phoksundo National Park. Simple linear regressions revealed no significant relationship between the composite attitude scores and total livestock holdings, total livestock killed by snow leopards, age, gender, or primary income source. However, we found a significant relationship between observed changes in external support and attitude towards snow leopards, with an adjusted R 2 = 0.280 (F(1, 48) = 20.03, P = 4.692 × 10⁻⁵). Region also proved significant, with an adjusted R 2 = 0.24 (F(1,57) = 19.19, P = 5.124 × 10⁻⁵). The number of cases of external support that a respondent’s household had benefited from also proved significant, with an adjusted R 2 = 0.15 (F (1, 57) = 11.43, P = 0.00131), as did years of education, with an adjusted R 2 = 0.11, (F (1,57) = 8.22, P = 0.00579).
The best performing multiple regression model with the lowest AICc included the explanatory variables of region, gender, years of education, number of times external support was received, and observed change in external support (Table 4). Our results demonstrate a positive relationship between composite attitude score and observed change in external support (0.544, 95% CI 0.113–0.975, P = 0.015), the region of lower Dolpo (2.541, 95% CI 1.046–4.037, P = 0.001), years of education (0.299, 95% CI 0.115–0.484, P = 0.002), and the number of times external support was received (1.093, 95% CI 0.300–1.887, P = 0.008). There was a significant relationship between gender and composite attitude score, with men tending to express more negative attitudes (−1.900, 95% CI −3.712–−0.079, P = 0.041). A repeated analysis using a forward, backward and mixed stepwise selection process with a P-value threshold of 0.05 resulted in the same model selection.
Predictor variables included in multiple linear regression to identify determinants of attitudes (n = 59) toward snow leopards amongst local communities in Shey Phoksundo National Park, Nepal. Models were assessed using the Akaike information criterion corrected for small sample size (AICc); models shown in the table are those that were within three AICc units of the top candidate model with the lowest AICc.

Table 4 Long description
A table comparing different regression models based on variables such as region, gender, education, and external support. The table has four rows and four columns. The columns are labeled Model, df, AICc, and R squared. The rows present different models with varying combinations of variables. Row 1: Model includes region, gender, education, count of external support, and observed change in external support; df is 53; AICc is 243.569; R squared is 0.584. Row 2: Model includes region, education, count of external support, and observed change in external support; df is 54; AICc is 245.646; R squared is 0.542. Row 3: Model includes region, age, gender, education, count of external support, and observed change in external support; df is 52; AICc is 246.261; R squared is 0.585. Row 4: Model includes region, total livestock, education, count of external support, and observed change in external support; df is 52; AICc is 246.339; R squared is 0.584.
Discussion
Whilst most of our sampled households had experienced livestock depredation by snow leopards, those residing in upper Dolpo experienced more depredation than those in lower Dolpo. Those living in upper Dolpo generally held more livestock, owned a greater proportion of small-bodied livestock and were more reliant on herding as a primary income source, all of which probably contributed to this result. In addition, upper Dolpo has a higher density of snow leopards, which in combination with higher livestock densities increases livestock depredation (Suryawanshi et al., Reference Suryawanshi, Bhatnagar, Redpath and Mishra2013; Chetri et al., Reference Chetri, Odden, Devineau and Wegge2019; Khanal et al., Reference Khanal, Mishra and Ramesh Suryawanshi2020). This relationship may also explain why the rate of livestock depredation observed in our study (annual depredation of 5% and 7% of total livestock holdings in lower and upper Dolpo, respectively), which corroborates findings previously reported from this area (3–10%; Devkota, Reference Devkota2007; Khanal et al., Reference Khanal, Mishra and Ramesh Suryawanshi2020), is notably higher than in other areas of Nepal. For example, annual losses of 1–2% have been reported from Annapurna and Manaslu (Chetri et al., Reference Chetri, Odden, Devineau and Wegge2019), 2.3% in the upper Mustang region (Aryal et al., Reference Aryal, Brunton, Ji, Barraclough and Raubenheimer2014), and 2.6% in the Manang valley (Oli et al., Reference Oli, Taylor and Rogers1994) These high levels of depredation in Shey Phoksundo National Park, which may increase further if conservation initiatives successfully increase snow leopard populations in future, highlight the importance of conflict mitigation measures.
The variables that best explained attitudes towards snow leopards were region, gender, years of education, number of times external support was received, and the perception of change in external support available over the last 5 years. Although the mean composite score suggested a predominantly positive attitude towards snow leopards overall, households in lower Dolpo tended to respond more positively than those in upper Dolpo. This was most evident in statements relating to the ongoing protection of snow leopards and the desirability of their continued presence, both of which elicited more negative responses from upper Dolpo households. Thus, the region in which a respondent resided was a clear driver of their attitude.
Respondents who had received more years of formal education had more positive attitudes towards snow leopards, a finding previously reported in other areas of Nepal (Hanson et al., Reference Hanson, Schutgens and Leader-Williams2019; Shahi et al., Reference Shahi, Aryal, Blon and Khanal2023). In our study, men held a more negative attitude towards snow leopards than women, whereas the opposite or no significant relationship has been observed in other research (Suryawanshi et al., Reference Suryawanshi, Bhatia, Bhatnagar, Redpath and Mishra2014; Kusi et al., Reference Kusi, Sillero-Zubiri, Macdonald, Johnson and Werhahn2020; Shahi et al., Reference Shahi, Aryal, Blon and Khanal2023). There was no significant relationship between age of respondents and attitude, contrary to other studies that have identified a negative relationship between these variables (Suryawanshi et al., Reference Suryawanshi, Bhatia, Bhatnagar, Redpath and Mishra2014). Unexpectedly, primary occupation did not significantly influence attitude, contrasting with other research in Shey Phoksundo National Park that found households relying primarily on agropastoralism held more negative attitudes towards snow leopards (Shahi et al., Reference Shahi, Aryal, Blon and Khanal2023).
Four external conflict mitigation mechanisms were being used in Shey Phoksundo National Park at the time of data collection: predator-proof night corrals, education initiatives, a wildlife damage relief fund, and livelihood support. Our results suggest these measures positively influence attitudes towards snow leopards: households who had received such support more often had a more positive attitude. This is an important finding as there is a lack of research into the effectiveness of conflict mitigation strategies across social and ecological contexts (Inskip & Zimmermann, Reference Inskip and Zimmermann2009; Eklund et al., Reference Eklund, López-Bao, Tourani, Chapron and Frank2017; van Eeden et al., Reference van Eeden, Crowther, Dickman, Macdonald, Ripple, Ritchie and Newsome2018a). How a respondent felt about the level of support provided by groups involved in snow leopard conservation (park management, snow leopard community groups and NGOs) also proved to be a significant variable. A study in the neighbouring region of Annapurna found similar results, showing a positive relationship between snow leopard conservation and attitude towards snow leopards (Hanson et al., Reference Hanson, Schutgens and Leader-Williams2019). This highlights the importance of communities’ perceptions of conservation action taken by external groups, and the role these perceptions play in forming attitudes towards snow leopards.
Our study found no relationship between attitude towards snow leopards and the number of livestock owned or the number of livestock lost to snow leopard depredation. Findings of previous studies vary; some reported no significant relationship (Suryawanshi et al., Reference Suryawanshi, Bhatia, Bhatnagar, Redpath and Mishra2014; Kusi et al., Reference Kusi, Sillero-Zubiri, Macdonald, Johnson and Werhahn2020), others an found association (Hacker et al., Reference Hacker, Dai, Cheng, Zhang, Zhang, Miller and Janecka2020). Our findings may suggest that strategies in Shey Phoksundo National Park targeted solely at reducing the number of livestock killed may not be sufficient to improve the attitude of local communities towards snow leopards.
The retaliatory killing of snow leopards following livestock depredation is a significant threat to the species’ survival. The responses to our attitude statements demonstrated that although respondents thought that the loss of a few livestock was an acceptable risk of herding, mass killings were a problem that local authorities needed to address. Mass killings occur when snow leopards enter traditionally constructed fixed corrals where livestock are kept overnight, killing more livestock than they can consume. The provision of predator-proof night corrals is an external support that aims to eliminate mass killings, with each predator-proof corral installed in a community saving up to five snow leopards from retaliatory killings (Jackson & Wangchuk, Reference Jackson and Wangchuk2004). At the time of our study, four predator-proof night corrals had been constructed in Shey Phoksundo National Park, with no mass killings reported in these corrals since construction (WWF Nepal, 2022). A similar proportion of households in lower (8.3%) and upper Dolpo (8.9%) had benefited from one of these predator-proof corrals. Scaling up this programme to construct a greater number of predator-proof corrals, particularly in upper Dolpo, is expected to lead to more positive attitudes towards snow leopards.
The Wildlife Damage Relief Fund is a government programme that offers financial support for loss of livelihood caused by any protected wildlife species in Nepal. This fund can offer up to NPR 30,000 per livestock lost to snow leopard depredation, and in the year 2022 the communities of Dolpo received a reported NPR 10 million distributed across 387 households (Shrestha & Gurung, Reference Shrestha and Gurung2022). Our results found that of the households who experienced livestock depredation by snow leopards, 43% in lower Dolpo and 49% in upper Dolpo had received financial aid. Many respondents suggested that the effectiveness of the relief fund could be enhanced by increasing awareness of the programme and simplifying the application process (e.g. modifying requirements for photographic evidence), or by increasing the amount of compensation.
At the time of data collection in 2022, a higher percentage of households in lower Dolpo (38%) had benefited from external educational support compared to households in upper Dolpo (13%). This type of support is of particular importance as years of education was positively associated with attitude. This finding supports previous attitudinal studies showing that higher levels of education and literacy are associated with more positive attitudes towards snow leopards (Hanson et al., Reference Hanson, Schutgens and Leader-Williams2019; Chetri et al., Reference Chetri, Odden, Devineau, McCarthy and Wegge2020; Shahi et al., Reference Shahi, Aryal, Blon and Khanal2023). Educational initiatives could be prioritized in upper Dolpo to increase access to education and improve attitudes towards snow leopards.
Lastly, we found that more households in lower Dolpo (12%) have benefited from livelihood support than in upper Dolpo (7%). Providing greater livelihood support, such as training in hotel management or homestay development as part of initiatives linked to ecotourism and snow leopard conservation, would be particularly beneficial as over half of respondents indicated that the presence of snow leopards did not currently benefit their household. Although our results did not demonstrate a relationship between attitude and primary income source, the relationship between reliance on agropastoralism and negative attitudes towards snow leopards has been observed elsewhere (Suryawanshi et al., Reference Suryawanshi, Bhatia, Bhatnagar, Redpath and Mishra2014; Chetri et al., Reference Chetri, Odden, Devineau, McCarthy and Wegge2020; Shahi et al., Reference Shahi, Aryal, Blon and Khanal2023). Moreover, diversified livelihood strategies that lead to greater financial security have been shown to increase local tolerance of snow leopards (Bagchi & Mishra, Reference Bagchi and Mishra2006) through avenues such as traditional handicraft making (Mishra, Reference Mishra1997) or participation in ecotourism (Vannelli et al., Reference Vannelli, Hampton, Namgail and Black2019).
Our study builds upon previous research in Nepal that aims to understand community attitudes towards the snow leopard. Future research should monitor changing attitudes towards snow leopards in Shey Phoksundo National Park and elsewhere as conservation initiatives are scaled up across the species’ global range. We have identified a number of important factors that contribute towards negative attitudes and we recommend that these are addressed through mitigation strategies. A focus on local perspectives, attitudes and tolerance prior to and after the implementation of mitigation strategies would be of particular value. No single mitigation strategy alone can foster coexistence between local communities and snow leopards, but providing households, in upper Dolpo in particular, with a combination of support measures could increase positive attitudes towards snow leopards in Shey Phoksundo National Park.
Supplementary material
The supplementary material for this article is available at doi.org/10.1017/S0030605325000146
Acknowledgements
We thank all respondents who completed the questionnaire for their valuable contributions; the Department of National Parks and Wildlife Conservation for permission to conduct this research; World Wildlife Fund Nepal for logistical guidance and support to secure the research permit; and Sheren Shrestha, Mountain Programs Coordinator at WWF Nepal for operational support. Funding was provided by the NSERC CGS-M graduate scholarship and SSHRC Grant 435-1385-2020. A final special thanks to our research assistants Sonam Lama and Tshiring Lama for conducting the questionnaire in Dolpo and translating responses to English, and our local field team who supported everyday logistics during our 5-week trek.
Author contributions
Study design: CL, SN, RS; data collection: CL, SN; data analysis: CL, with guidance from SN, RS, DR; writing: CL; revision: all authors.
Conflicts of interest
None.
Ethical standards
This research abided by the Oryx guidelines on ethical standards. Research was conducted with a memorandum of understanding signed between WWF Nepal, WWF Canada and the University of Waterloo, ensuring both active collaboration and that results and publications are shared with all relevant institutions including local and national organizations in Nepal. Approval from the University of Waterloo Office of Research Ethics (ORE#43202) was granted prior to conducting the surveys.
Data availability
Data are available on request from the corresponding author.





 Open access

