NOMENCLATURE
- A1
entrance area of diffuser
- A2
exit area of diffuser
- Ai
an arbitrary cross section area of the diffuser
- D
exit diameter of the diffuser
- d0
the height of the first level grid
- Ls
length of the diffuser
- Ma0
freestream Mach number
- Mae
exit Mach number of the diffuser
- P0
freestream static pressure
- Pe
exit static pressure of the diffuser
- Sp
throat area near the plug
- Se
cross sectional area of the flow path
- TR
throttling ratio
- Xm
X-coordinate of the control point in the center line
- Ym
Y-coordinate of the control point in the center line
- Ys
offset distance of the diffuser
- σe
total pressure recovery coefficient of the exit
1.0 Introduction
Supersonic vehicle has drawn an ever-increasing attention in the world [Reference Walker, Kennedy and Mikkelson1–Reference Ding, Liu, Shen, Huang, Liu and Chen3]; it could operate over a wide flight envelope within an altitude between 0 and 20 km. The engine is the key technology, and it directly determines the success or failure of flight.
Inlet is an important aerodynamic component of the engine, which plays a key role in the performance of the whole propulsion system. The contradiction between the starting performance at low Mach number and the aerodynamic performance at high Mach number has become a serious problem that restricts the flight in wide speed range [Reference Liu, Fan, Tao and Liu4, Reference Wang and Guo5]. So, the high aerodynamic performance of the inlet at design point cannot guarantee that the inlet can work normally and stably in all working conditions. To solve the contradiction, a variable geometry scheme must be considered, and it becomes an inevitable trend in the study of inlet in recent years.
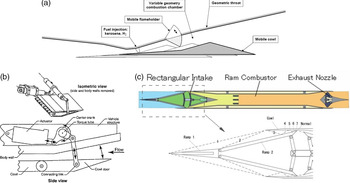
In various kinds of inlets, the two-dimensional inlet is widely used because its variable geometry structure is simpler and easier to realise. For a two-dimensional inlet, common variable geometry schemes [Reference David, Lawrence and Carl6–Reference Liu, Wang and Qian10] mainly include the following: cowl lip rotation case adopted by X-43A in the United States (as seen in Fig. 1(a)) and cowl lip translation case adopted by ONERA in France (as seen in Fig. 1(b)). By rotating and translating the cowl lip, the entrance area of the inlet decreases while the throat area remains unchanged, which leads to the reduction of an internal contraction ratio, so the inlet could start normally at a low Mach number. Once starting, the inlet obtains reasonable compression and higher capture airflow by increasing the internal contraction ratio to achieve aircraft acceleration. Another scheme is the compression ramp rotation case adopted by ATREX in Japan (as seen in Fig. 1 (c)). In this case, the entrance area and throat area of the inlet decrease at the same time to reduce the internal contraction ratio for the start performance. By adjusting the angle of the compression ramp, the compression efficiency and capture flow rate of the inlet can be adjusted to meet the requirements of the engine under different flight conditions. This type of variable geometry inlet is convenient for parallel installation, and it is also easy to control and adjust.
Different kinds of variable geometry scheme.

In this article, design of a two-dimensional variable inlet operating from Mach number 1.5 to 4 was developed. Numerical simulation and wind tunnel experiments were carried out to investigate the aerodynamic performance and variable geometric rules of the inlet. The influence of the large bleed window below throat at low Mach number was also studied.
2.0 Numerical simulation and wind tunnel experiments
2.1 Design of inlet
2.1.1 Variable geometry scheme
Considering the realisation and convenience of the experiment to be carried out later, compression ramp rotation case is adopted as the variable geometry scheme in this paper. Three different conventional adjustment schemes are shown in Fig. 2. Two adjustable ramps can be rotated: One is the external compression surface, and the other is diffuser lower surface behind the throat. Figure 2 (c) is similar to the ATREX case mentioned above, the motor screw moves horizontally and the rotation adjustment of the two ramps is realised by parallelogram mechanism. Figure 2 (b) relies on the same principle as Fig. 2 (c) in which the motor screw moves vertically to complete the adjustment of the ramps. Differently, Fig. 2 (a) utilises two motors to control the two ramps, respectively, compared with Figs. 2 (a) and (b). All of the three schemes are multi-degree-of-freedom adjustments, which can be realised theoretically. But how to achieve synchronous control and avoid mechanism getting stuck are still serious problems when there is more than one movable component. Moreover the connection and thermal problems between adjacent components are also difficult.
Conventional compression ramp rotation case.

In order to avoid the mechanism getting stuck during the process of experiment, design of a single-degree-of-freedom variable geometry scheme with shared diffuser was proposed. As shown in Fig. 3, compared with the multi-degree-of-freedom scheme, the single-degree-of-freedom scheme only uses one motor to control multiple variables, such as secondary compression ramp, throat height and internal contraction ratio. When the inlet works at the lowest Mach number, the second compression ramp is at the lowest point, while the second compression angle is the smallest and the throat height is at the highest. As the flight Mach number raises, the second compression ramp rotates around the fixed hinge and the throat height decreases gradually with the internal contraction ratio increasing. When the Mach number reaches 4, the inlet works at the design point and the external shock waves attach on the cowl lip.
Comparison between single-degree-of-freedom and multi-degree-of-freedom schemes.

2.1.2 Large bleed window
There is no adjustable ramp behind the throat in single-degree-of-freedom scheme, which means the diffuser remains unchanged at all flight conditions. The angle of the secondary compression ramp is small at low Mach numbers, so an obvious bleed window occurs near the throat as shown in Fig. 4.
Sketch of large bleed window at low Mach number.

The large bleed window mainly plays the following two roles:
First, it is beneficial to stabilise the terminal shock wave [Reference Shi, Chang, Zhang, Wang, Hou and Bao11, Reference Cai, Zhou, Liu and Lin12]. Pressure increases when the air flow passes through the shock wave. Usually, for the inlet with small bleed window, the region near the throat consists of a low-pressure area and a high-pressure area before and behind the terminal shock wave. The terminal shock wave locates near the entrance of the diffuser. However, for the inlet with large bleed window, the region near the throat consists of three areas including the low pressure near the bleed window which could not be ignored as shown in Fig. 5. Low-pressure airflow near the large bleed window mixes the original high-pressure airflow behind the shock train, which leads to the decline of the overall pressure in the area from suction slots to entrance of the diffuser. It weakens the intensity of the shock wave and promotes the terminal shock wave to move upstream and remain stable in the internal contraction section.
Comparison between small bleed window and large bleed window.

Second, for the inlet with large bleed window, the airflow is divided into two streams — one stream enters into the diffuser, and the other stream is excluded out along the bleed window (or enters to another channel). Mach number of the diffuser entrance declines, and it leads to the reduction of shock wave loss. In addition, due to the existence of the bleed window, the boundary layer at the entrance of the diffuser becomes thinner, which enhances total pressure slightly. It is more conducive to improving the total pressure recovery coefficient of the diffuser.
2.1.3 External compression configuration and diffuser design
The two-dimensional supersonic inlet is divided into conventional multi-stage wedge compression inlet and curved surface compression [Reference Zhang13–Reference Qiao, Yu, Gao and Wang15] inlet according to the external compression forms. Here we call them Case A and Case B, respectively. These two methods decelerate and pressurise the airflow through multi-stage oblique shock wave and curved shock wave generated by external compression surface, respectively.
The compression efficiency of Case A is lower, and the length of the external compression surface is longer compared with Case B, but it is more flexible because of several rotatable components in the external compression surface. On the contrary, the compression efficiency of Case B is higher and the length is shorter. But the surface of Case B is continuous and smooth. There are no rotatable and adjustable components unless breaking the compression surface. The airflow will undergo the process of compression-expansion-recompression if adopting variable geometry adjustment, which is not conducive to improving the performance of the inlet as shown in Figs. 6 and 7.
Comparison between Case A and Case B.

Different external compression forms.

Considering the advantages and disadvantages of the two cases, combination configuration of curved compression with wedge compression was proposed. A curved compression surface is used as the first ramp for better compression efficiency. According to the specific geometric constraints (length of the external compression wall, capture height, etc.), the mathematical expression of the curved shock wave is given and then the mathematical expression of the curved compression wall is inversely designed using the method of characteristics (MOC) [Reference Zucrow and Hoffman16, Reference Zhang17]. Compared with traditional wedge compression wall, the designed curved compression wall has shorter length and higher compression efficiency [Reference Zuo and Huang18]. The wedge compression is utilised as the second compression wall, which is set up artificially based on the oblique shock wave theory. The second compression wall extends to the throat and rotates around a fixed hinge which is the only rotating part of the inlet.
The design of subsonic diffuser is an important factor in the design process of the inlet. The change of geometric shape directly affects the viscous loss and diffuser loss. Inappropriate shape may even cause local flow separation in the internal path, resulting in the decrease of total pressure and increase of distortion at the exit of the inlet. Therefore, under the premise of meeting the overall request of the engine, the design parameters and rules should be reasonably selected to avoid the occurrence of flow separation for higher total pressure recovery coefficient and flow field quality at the exit of inlet.
In this article, the entrance cross section of the diffuser is a rectangle while the exit is a circle, so a conventional rectangle-to-circle S-bend approach [Reference Lee and Boedicke19, Reference Sun20] is adopted. The main parameters include center line distribution, area distribution and area shape distribution, etc. The deflection of the flow in the diffuser is determined by center line distribution, which also control the transverse pressure gradient and the secondary flow. The expansion of the flow in the diffuser is determined by area distribution which also control the streamwise pressure gradient and the separation. A good combination of these parameters could maximise diffuser performance. Figure 8 shows the design parameters of the diffuser. A1 and A2 denote the area of the entrance and exit while Ls and Ys denote the length and offset distance of the diffuser. Point Pm is the control point in the center line.
Design of the diffuser.

2.1.4 Descriptions of the inlet
The inlet is devised to work within Mach number 1.5- 4.0 and cruise at Mach number 4. Figure 9 shows the two-dimensional symmetrical sketch of the inlet. The inlet geometry size was dimensionless treated using exit diameter D of the diffuser. The starting and ending angle of the curved compression ramp are 6° and 10°,and the secondary compression ramp degree is 11.5° The overall length of the inlet is 10.3D while the width of the half-model is 0.5D. The length of the external compression, the internal contraction section and the diffuser are 4.04D, 1.59D and 4.67D, respectively. The capture height is 1.56D, and the throat height is 0.3D. In order to improve the self-starting and restarting performance of the inlet [Reference Haberle and Gulhn21–Reference Yuan and Liang23], six suction slots of 0.06D in width were set at the shoulder of the internal contraction section.
Sketch of the two-dimensional supersonic inlet.

Table 1 lists tested configuration parameters. It includes the compression ramp arrangement and the throat height under different Mach numbers. The rotation angle of the second compression wall during the variable geometry adjustment is relative to the design point (Mach number 4). According to the ratio of bleed height to throat height, it could be judged whether the bleed window is large or small. In this paper, the ratio of large bleed window is greater than 30%.
Configuration of the inlet under different Mach numbers

2.2 Numerical simulation
Numerical simulation of the steady flow field in the inlet was performed by the commercial CFD software Fluent. The Reynolds averaged Navier-Stokes equations [Reference John and Anderson24] in three dimensions were solved with a finite volume spatial discretisation method. Steady flow field simulations were carried out using the density-based implicit solver with an implicit time-marching algorithm. During the computation, the inviscid flux scheme was the Roe’s method [Reference Roe25], and the monotonic upwind scheme for conservation laws (MUSCL) [Reference Van26] approach was used for variable extrapolation. The viscous flux scheme was discretised based on second order central difference scheme. The turbulent flow was modeled by using the one-equation Spalart-Allmaras turbulence model [Reference Spalart and Allmaras27]. Unsteady simulation method was also utilised to study the flow field of the inlet. Dual-time stepping method was used for calculation, and the total calculation time of unsteady simulation was about 50ms. The physical time step was set as 0.01ms, and the iteration in each time step was 20 times. The fluid was treated as a compressible ideal gas. The computational domain included the flow field surrounding the inlet, and its boundary condition was set as pressure far field. The no-slip adiabatic wall conditions were imposed in the solid wall boundaries. The geometry was symmetrical, and the flow field were symmetrical. In this case, the computational domain chosen was only a half of the actual one. A typical computational mesh is shown in Fig. 10.
Computational mesh of the two-dimensional supersonic inlet.

2.3 Wind tunnel experiment
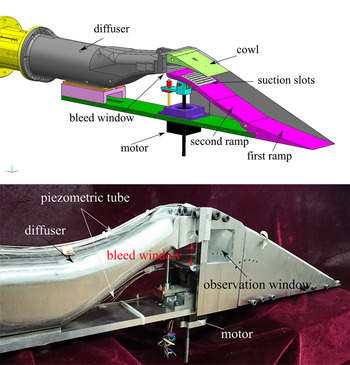
After obtaining the flow field and performance of the inlet by numerical simulation, the wind tunnel experimental model was designed. Figure 11 shows the model designed by Unigraphics NX (a modeling software) and the real experimental model of the inlet. The model mainly consists of an external compression section, internal contraction section, diffuser and measurement section. The external compression section is composed of a primary compression surface and a secondary compression surface. The primary compression surface is fixed, and the secondary compression surface rotates by a motor. The internal contraction section is equipped with a detachable suction device to study the influence of the suction slots. An observation window is set on the sidewall to observe the terminal shock wave and judge the working condition of the inlet.
Experiment model and configurations of the inlet.

The experiment was conducted in the FL-23 high-speed wind tunnel of China Aerodynamic Research and Development Center (CARDC). The tunnel is a direct-connected temporary-impulse transonic wind tunnel, and it has a rectangular working section with constant cross section which is 600mm wide by 600mm height. The upstream of working section is an interchangeable two-dimensional De Laval nozzle that provide nominal free-stream Mach number ranging from 0.4 to 4.5. The total pressure and total temperature of free stream at design point (Mach number 4) were 480kPa and 288K. The working condition changing of the engine was simulated by adjusting throttling plug at the end of the model. The throttling ratio (TR) is utilised to define the axial positions of the plug:
 \begin{align}{\rm{TR}} = (1 - {{\rm{s}}_{\rm{p}}}/{{\rm{S}}_{\rm{e}}}) \times 100\% \end{align}
Wherein, Sp is the throat area near the plug and Se is the cross-sectional area of the flowpath. In wind tunnel tests, TR could be set as a value between 0% (fully open) and 100% (fully closed).
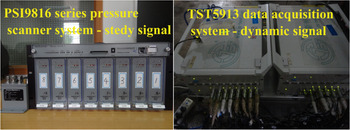
Two different test systems were utilised to measure steady and dynamic pressure signals, respectively, during the test as seen in Fig. 12. PSI9816 series pressure scanner system was used to measure the steady static pressure along the wall and circumferential static pressure at the exit of the diffuser. There are 73 pressure orifices used to measure the static pressure distribution. 41 pressure orifices (L1-L41) along the lower wall and 32 pressure orifices (U1-U32) along the upper wall of the inlet were used to evaluate the oblique shock waves reflection and location of the terminal shock wave. Four Kulite dynamic sensors were set at the exit of the diffuser to monitor unsteady flow patterns and measure the dynamic distortion of the inlet. TST5913 data acquisition system was used to sample the data measured by the sensors, and the sampling frequency was 10kHz.
Steady and dynamic pressure measurement system.

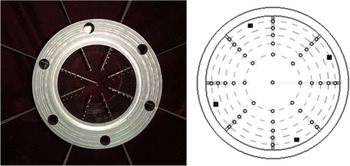
The performance parameters of the inlet exit were calculated with the mass-weighted method according to the data acquired from the measurement rake as seen in Fig. 13. The circles represent the static pressure measure points whereas the rectangles represent the dynamic pressure sensors. Some parameters could be used to quantify the performance of the inlet, including exit total pressure recovery coefficient  $\sigma_{\textrm{e}}$, exit Mach number Mae and mass flow ratio Φ. The coefficient
 $\sigma_{\textrm{e}}$ and Φ indicate the quality and quantity of the airflow, respectively.
 $\sigma_{\textrm{e}}$ is the total pressure ratio of exit to freestream whereas Φ is the ratio of exit mass flow to the captured mass flow. Specific inflow conditions are summarised in Table 2, and the experiment model of the inlet in wind tunnel is shown in Fig. 14.
Measure rake of the inlet exit.

Flow conditions of the inlet experiment

Experiment model in wind tunnel.

3.0 Results and discussion
3.1 Result of the wind tunnel
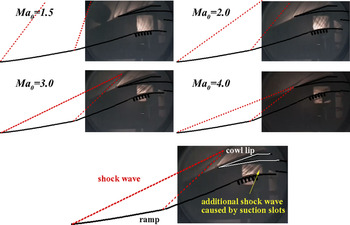
In this experiment, the performance of the inlet with different inflow Mach numbers and backpressures were verified. Figure 15 shows the experimental schlieren of the two-dimensional inlet under different Mach numbers. The red dashed lines represent shock wave while the black solid lines represent surface of the inlet. From the figure, it can be seen that as the inflow Mach number increases, the second adjustable compression wall rotates around the fixed hinge, the second compression angle increased gradually. Meanwhile, the curved shock wave and oblique shock wave move toward the cowl lip and attach on the lip at Mach number 4. The inlet works stably at all flight condition, and there is no obvious flow separation in the internal flow path. Additional shock wave induced by the suction slots can be observed clearly.
Experimental schlieren of the two-dimensional inlet under different Mach numbers.

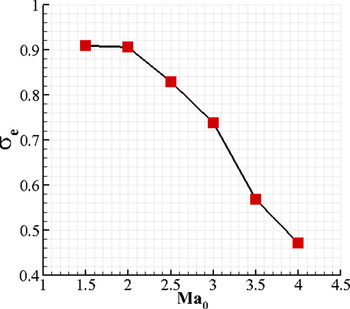
The steady aerodynamic performance of the inlet is given in Fig. 16 where X-coordinate denotes flight Mach number Ma0, Y-coordinate denotes total pressure recovery coefficient  $\sigma_{\textrm{e}}$ of the inlet. The result indicates that the inlet starts successfully over a wide speed range. The total pressure recovery coefficient reaches 0.87,0.73 and 0.47 at Mach number 2, 3 and 4, respectively.
Aerodynamic performance of the inlet under different Mach numbers.

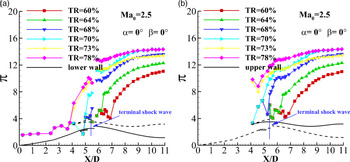
To validate the reasonability of the large bleed window idea using in the single-degree-of-freedom scheme shown in this paper, a typical working condition (Ma0=2.5) is selected. Figure 17 shows the static pressure distribution curves along the upper and lower walls under different throttling ratios (TR) in the experiment. Y-coordinate  $\pi$ denotes the static pressure ratio of outlet to inflow, and X-coordinate X/D denotes the streamwise distance, which is also dimensionless treated using exit diameter D of the diffuser. Different curves indicate different throttling ratios (TR) caused by the movement of the plug. The position of terminal shock can be indicated by the sharp rise in static pressure. As throttling ratio increases, pressure distribution along external compression surface of the inlet is not affected and the starting position of pressure rise decreases, which means the shock train moves upstream. The terminal shock stabilises in the internal contraction section when TR is 68% and gets stuck at the suction slots when TR is 70%. Once TR continues to increase, the terminal shock will be pushed out of the internal contraction section, a large separation bubble is generated, and the inlet will unstart. Total pressure recovery coefficient and mass flow ratio will decline greatly.
Pressure distribution under different throttling ratios at Mach number 2.5.

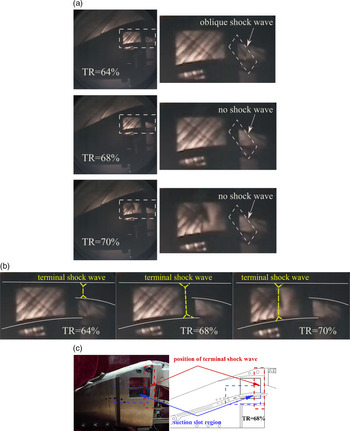
Figure 18 shows the schlieren figure of the experiment and the local sketch of the model at Mach number 2.5. The results of different throttling ratio (TR = 64%,TR = 68%,TR = 70%) are given. Some auxiliary lines have been added to explain the schlieren. The white solid lines represent the upper and lower wall of the inlet while the yellow dashed lines represent the terminal shock wave. Combining the schlieren and model sketch with the pressure distribution mentioned above, it can be seen that when the throttling ratio is 64%, the terminal shock train has not reached the entrance of the diffuser. Therefore an oblique shock generated by the outer wall of the diffuser can be clearly watched from the right local enlarged figure. With the increase of the throttling ratio to 68%, the oblique shock wave disappears but shock wave structure in the schlieren window remains unchanged. This illustrates that the terminal shock has passed through the diffuser entrance and is located in the region between the schlieren window and the diffuser entrance as seen in Fig. 18 (b). As the throttling ratio increases to70%, the shock wave structure in the schlieren window changes, the terminal shock wave is pushed out from the diffuser and stuck in the suction slot in the internal contraction section.
Experiment schlieren and model sketch at Mach number 2.5.

3.2 Numerical simulation validation
There is no observation window in experimental diffuser, and the specific flow field in the internal flow path could not be observed, so the flow field can only be predicted by numerical simulation results combined with experimental data.
Selection of turbulent model and grid independent study were conducted to validate the simulation. Three different kinds of grids were utilised to study the grid independent including coarse grids (2.8 million cells, red curve), medium grids (3.8 million cells, blue curve) and dense grids (4.8 million cells, green curve), as shown in Fig. 19. Backpressure ratio P/P0 is equal to 6.8 where Pe and P0 indicate the actual pressure of the exit and inflow, respectively. Flow field and pressure distribution along the wall are almost the same except for the downstream of the inlet.
Grid independent validation.

In addition, three turbulent models were used to during the simulation including RNG k- $\varepsilon$ (red curve, y+>30), SST k-
 $\omega$ (blue curve, y+<1) and Spalart-Allmaras (green curve, y+<5) model as shown in Fig. 20 where the discrete points denote the experimental data and the curves denote numerical simulation result. To ensure the accuracy of the turbulence flow solution, appropriate values of y+ for each turbulent model were realised near the wall flow region. Compared with k-
 $\omega$ model, simulation result using Spalart-Allmaras turbulent model and k-
 $\varepsilon$ turbulent model are both in good accordance with the experiment data, the static pressure distribution along the wall is consistent with the experiment result including the starting position of the shock train and the highest static pressure at diffuser exit.
Turbulent model selection validation.

To improve computational efficiency and accuracy at the same time, medium grids (3.8 million cells) and Spalart-Allmaras turbulent model were finally chosen for further numerical simulation.
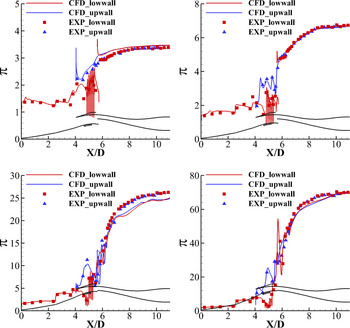
Figure 21 shows the static pressure distribution along the lower wall and upper wall in typical condition such as Mach number 1.5, 2, 3 and 4. The discrete points in the figure denote the experimental data whereas the curve represents the numerical simulation results, red and blue symbols represent lower wall and upper wall, respectively. In addition, Y-coordinate  $\pi$ is the static pressure ratio of exit to inflow. It can be seen from the figure that the static pressure distribution along the wall using simulation is consistent with the experiment result including the starting position of the shock train and the static pressure rise of the diffuser exit. Compared with the result at low Mach number, there are some deviations in the diffuser at high Mach number, but the overall trend is consistent. It is worth noting that there is a large fluctuation of pressure in the internal contraction section. The strong oscillation is caused by the suction slots instead of the shock train. According to the starting position of pressure rise, it can be inferred that the shock train has not reached the entrance and it is still in the diffuser.
Static pressure distribution along the lower and upper wall under different Mach numbers.

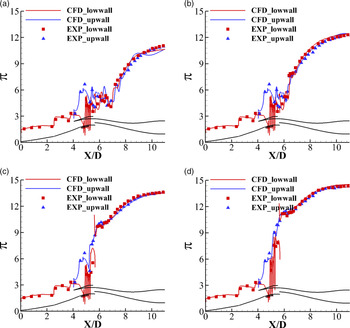
Figure 22 shows the static pressure distribution along the lower wall and upper wall under different backpressure ratios at Mach number 2.5. Throttling ratios (TR) corresponding to the experiments are 60%, 64%, 68% and 70%, respectively, while the backpressure ratios P/P0 corresponding to the simulation are 11, 12.5, 13.6 and 14.6, respectively. Here Pe and P0 denote the pressure of exit and inflow. In numerical simulation, the high backpressure produced by throttling device or combustor is simulated by changing Pe/P0. The position of shock train could be predicted by the starting position of pressure rise according to the figure. As can be seen from the pressure distribution below, the change of back pressure in the downstream of the inlet will not affect the upstream flow field. With the increase of backpressure, the shock train in the diffuser moved upward continuously. When the backpressure downstream Pe/P0 reached 13.6, the shock train pushed out from diffuser and stabilised in the internal contraction section.
Static pressure distribution along the lower and upper wall under different backpressures at Mach number 2.5.

In addition, the corresponding relationship between the throttling ratio (TR) and the backpressure ratio (Pe/P0) can be established. Figure 23 shows the corresponding relationship. Y-coordinate in the figure indicates the backpressure ratio (Pe/P0) and X-coordinate indicates the throttling ratio (TR). As TR increases, the corresponding Pe/P0 shows an upward trend. Establishing the corresponding relationship between throttling ratio and backpressure ratio is beneficial to predict the characteristics of shock train according to simulation results.
Corresponding relationship between Pe/P0 and TR.

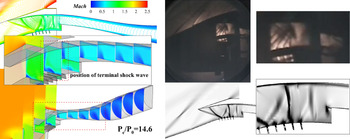
Figure 24 shows the flow field contour and the comparison between numerical schlieren and wind tunnel schlieren when Pe/P0 was 14.6 and TR was 70%. It can be seen from the figures that the numerical simulation also presented the phenomenon in which the terminal shock wave stuck at the fifth suction slot and converted to normal shock wave. In conclusion, the numerical simulation results matched well with the experimental results, so the numerical simulation adopted in this paper is credible and receivable. More in-depth study on the details of the flow field will be conducted using the numerical simulation method.
Numerical schlieren and wind tunnel schlieren at Mach number 2.5.

3.3 Flow field analysis
3.3.1 Shock train structure
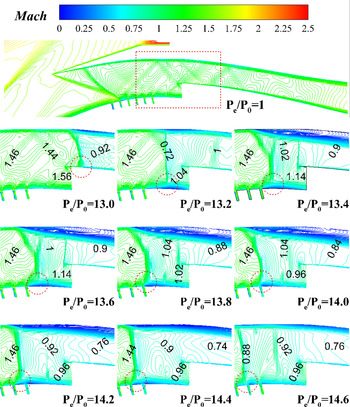
Figure 25 shows Mach number contour near the throat under critical conditions at Mach number 2.5. Backpressure ratio Pe/P0 ranges from 13 to 14.6. The shock-foot of the terminal shock wave is marked using a red circle. The movement of the shock wave can be seen more clearly from the figure. When Pe/P0 is 13, the terminal shock wave locates behind the entrance of the diffuser. When Pe/P0 adds up to 13.2, the terminal shock wave is pushed out to internal contraction section. With the further increase of the backpressure, the terminal shock wave continues to move upstream and is finally stuck in the last two (fifth and sixth) suction slots of the internal contraction section when Pe/P0 is larger than 13.8.
Mach number contour near the throat under critical conditions at Mach number 2.5.

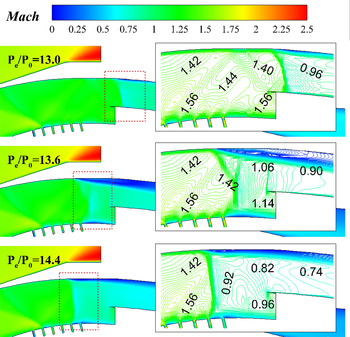
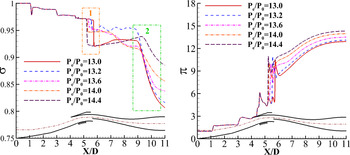
To reveal the function of the large bleed window, Fig. 26 shows the local enlarged figure mentioned above, in which Pe/P0 are 13, 13.6 and 14.4, respectively. From the figure, the specific location of the shock train and the structure variation of the shock train can be clearly observed. Figure 27 shows the total pressure and static pressure distribution along the inlet core area (the direction of streamline in the figure) under typical conditions. Two extra conditions have been added to the figure in which backpressure ratios are 13 and 13.4. There are two obvious changes of total pressure — one is in the upstream of the diffuser while the other is in the downstream. The first sudden drop of the total pressure in the figure represents the shock train position. Combining the flow field contour and the total pressure and static pressure distribution, it can be seen that when Pe/P0 is 13, the terminal shock wave locates near the entrance of the diffuser and the flow field in the internal contraction section remained unchanged. The shock train presents  $\lambda$-type closing to the normal shock wave [Reference Tamaki, Tomita and Yamane28, Reference Tamaki, Tomita and Yamane29]. Compared with X-type shock, the shock-foot is shorter, and the Mach disk is longer. It results in high total pressure drop and static pressure rise to the airflow. The total pressure recovery ratio
 $\sigma_{\textrm{e}}$ declines from 0.96 to 0.92 after airflow passed through the shock wave. Here we call it strong
 $\lambda$-type shock wave in this paper. As backpressure raises, the shock train is pushed out from diffuser, and the structure of shock train changes slightly. Although it is still
 $\lambda$-type, the shock-foot becomes longer and is close to the X-type shock wave, which impairs the compressibility to the airflow. The total pressure recovery ratio drops from 0.96 to 0.94, so we called it weak
 $\lambda$-type shock wave. As backpressure continues to raise, the terminal shock moves forward and locates at the suction slot in the internal contraction section. At this time, the shock train transforms from
 $\lambda$-type to normal shock wave with higher compression than before. During the whole process, the intensity of shock train decreases first and then increases. When Pe/P0 is equal to 13.6, local airflow behind the shock train is still supersonic. The main reason is that the low-pressure airflow near the large bleed window neutralises the original high-pressure airflow behind the terminal shock wave, which leads to the decline of the overall pressure in the area from suction slots to entrance of the diffuser. To match the pressure, a special weak
 $\lambda$-type shock wave forms. Besides, the total pressure has a second drop in the downstream of the diffuser (X/D=9). The additional pressure drop is due to the separated boundary layer from shock-boundary layer interaction. This pressure loss is greater than the shock losses.
Local enlarged Mach number contour near the throat under critical conditions at Mach number 2.5.

Total pressure and static pressure distribution along the inlet core area under typical conditions at Mach number 2.5.

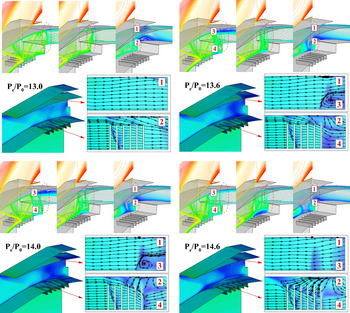
Figure 28 shows the contour, slice and limiting streamlines on the upper and lower wall of the internal contraction section under typical critical conditions. Four places are marked (region 1, 2, 3 and 4) near the throat to observe and analyse the changes of shock train and flow details. As can be seen from the figure, the shock train is a complex three-dimensional flow phenomenon. With the increase of backpressure, the shock train moves not only upward and downward, but also left and right. When Pe/P0 is 13, the shock train has not reached the internal contraction section, so the upper and lower limiting streamlines are smooth. When Pe/P0 adds up to 13.6 and 14, the shock train moves along the cowl side at symmetrical plane, and large-scale flow separation occurs in region 3. The structure of shock train is forced to change to match the lower pressure caused by the large bleed window. Separation is generated to weaken the terminal shock wave, and shock-foot is a part of terminal shock actually. As Pe/P0 continues to raise, separation flow is exhausted through suction slots and the range of separation area reduces. So weak  $\lambda$-type wave turns into strong
 $\lambda$-type again and finally to normal shock wave.
Through the analysis of the phenomenon and issues mentioned above, the stability of the shock wave in the internal contraction section owes to the suction slots on the one hand, and the weakness to the shock wave induced by large bleed window on the other hand.
Contour, slice and limiting streamlines under typical critical conditions at Mach number 2.5.

Total pressure recovery coefficient of the inlet under different backpressure at Mach number 2.5.

The aerodynamic performance with different backpressure of the inlet at Mach number 2.5 is given in Fig. 29 where X-coordinate denotes backpressure, Y-coordinate denotes total pressure recovery coefficient  $\sigma_{\textrm{e}}$ of the diffuser. The result demonstrates that the total pressure recovery coefficient of increases gradually as backpressure raises. When the Pe/P0 is13 and 14.6,
 $\sigma{\textrm{e}}$ is 0.816 and 0.886, respectively. The performance near the critical condition improves by 8.5%. At the last moment, even if the anti-backpressure ratio increases a little, the performance of the inlet could improve a lot. The large bleed window promotes the anti-backpressure capacity of the inlet. It proves that the scheme adopted in this paper has a great effect on terminal shock wave control and inlet performance improvement.
3.3.2 Shock wave oscillation
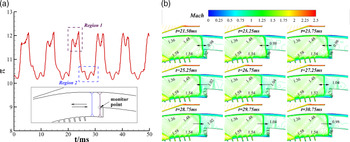
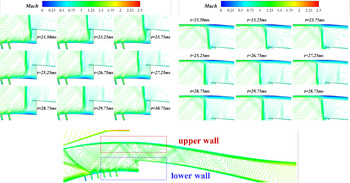
In addition, during numerical simulation, it was found that the monitored parameters of diffuser cannot converge and present a periodic trend when Pe/P0 is 13.1. Therefore, an unsteady simulation method was utilised to study the flow field under this condition. Dual-time stepping method was used for calculation, and the total calculation time of unsteady simulation was about 50ms. The physical time step was set as 0.01ms and the iteration in each time step was 20 times. The calculation converges in each time step. The front edge point of the lower wall of the diffuser was taken as the monitor point. Figure 30 shows the pressure versus time curve of the monitor point and the Mach number contour near the internal contraction section within one cycle. Region 1 and Region 2 in Fig. 30 (a) represent the nearest position and the farthest position from the monitor point during the whole process, respectively. It can be seen from the figure that large amplitude oscillation and small amplitude oscillation exist at the same time. The period of the large amplitude oscillation is about 10ms between the two limit positions. From 21.50ms to 23.75ms and 26.75ms to 28.75ms, terminal shock oscillates slightly near Region 1 and Region 2, respectively. The period of the small amplitude oscillation is about 2ms. In the rest of time, terminal shock moves upstream and downstream.
Shock wave oscillation.

Local enlarged Mach number contour during the oscillation.

Figure 31 shows local enlarged Mach number contour during the oscillation. From the figure, it can be seen that the terminal shock presents weak- $\lambda$ type during the whole oscillation. Except for the position, the structure of the terminal shock almost remains unchanged, so it can only be analysed by slight changes of the separation bubbles near the surface. In fact, the separation and shock structure are coupled. As the terminal shock moves upstream, the separation on the upper wall first becomes larger and then gets smaller. On the contrary, the separation on the lower wall first becomes smaller and then gets larger. In general, the change is slight during the whole oscillation.
Figure 32 shows the mass flow versus time curve of the diffuser entrance within one cycle. The mass flow remains unchanged and is equal to about 0.44 when backpressure is not very high (Pe/P0<13). The terminal train is still in the diffuser. As Pe/P0 increases to 13.1, the terminal shock is pushed out form the diffuser and the oscillation occurs. From the figure, it can be seen that the mass flow fluctuates between 0.426 and 0.436. The further away from the entrance, the less the mass flow.
Mass flow versus time curve during the oscillation.

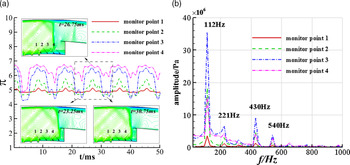
Pressure oscillation curve and the FFT transformation result.

Figure 33 (a) shows the pressure versus time curve of four monitor points on the lower wall of the internal contraction section. The movement of the terminal shock wave is observed through the pressure fluctuation in different place. From the figure, it can be seen that there is no obvious fluctuation at point 1 in the whole process, which means the terminal shock wave does not affect point 1 and there is still a distance between the farthest position and point 1. On the contrary, point 4 presents the largest fluctuation, and it indicates that the farthest position of the terminal shock wave is near point 3. FFT transformation of the four monitor points pressure signal was conducted and the power spectral density distribution from 0 to 1000 was shown in Figure 33 (b). As can be seen from the figure, the frequency domain results of the four points are similar with a large amplitude peak at 112Hz and some small amplitude peaks at 221Hz, 430Hz and 540Hz. Low-frequency with high-amplitude oscillation and high-frequency with small-amplitude oscillation exist at the same time during the whole process. Low-frequency oscillation is the primary oscillation while higher-frequency peaks are harmonic signatures related to the primary oscillation.
Mach number contour and pressure distribution along the streamline.

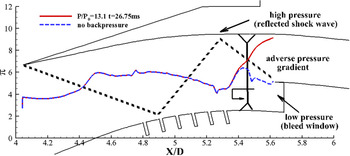
Adverse pressure gradient.

Figure 34 shows the Mach number contour and pressure distribution along the streamline in core areas when Pe/P0 is 13 and 13.1. The result of the previous one (Pe/P0=13) is steady while the later one (Pe/P0=13.1) is unsteady. Considering the large bleed window, the channel is divided into two parts — one is bleed channel, and the other is the diffuser. The blue line represents the pressure distribution along upper streamline, and the red line represents the other streamline. It can be seen from the figure that when Pe/P0 is 13, the terminal shock wave has not arrived at the entrance of the diffuser, and the pressure ratio difference ΔP between the diffuser and bleed channel is about 7 times. As the backpressure increases to 13.1, the terminal shock has just been pushed out from the diffuser, airflow in two channels are mixed instantly. However, due to the low pressure near the bleed window, the pressure of the mixed airflow does not increase but decreases compared with the previous airflow in the diffuser. It reduces the force pushing the terminal shock forward, thus a small-amplitude oscillation occurs at the entrance of the diffuser at this time. Just a moment later, driven by the downstream high pressure, the terminal shock will still move upstream. The mixing effect of the two airstream weakens while the mainstream pressure starts to rise and the bleed channel pressure begins to drop. As the terminal shock reaches the farthest position, the upper foot of the shock wave is close to the position of the reflected shock wave, and there is a large adverse pressure gradient as shown in Fig. 35. The backpressure is not high enough to overcome the adverse pressure gradient to push the terminal shock forward. After a slight oscillation, the terminal shock starts to return downstream. Influence of background wave and the bleed window are the main reasons which cause the shock wave oscillation.
4.0 Conclusions
This study explored the aerodynamic performance and variable geometric rules of a two-dimensional inlet operating in a wide speed range. Numerical simulation and wind tunnel experiment were conducted. The comparison of results between numerical simulations and experiments indicate that the numerical simulation shows an agreement with the experimental data on wall pressure distribution. So the flow field can be predicted by numerical simulation results combined with experimental data with a reasonable accuracy. According to the wind tunnel test and numerical simulation results, the conclusions are as follows:
(1). The variable geometry scheme adopted solves the contradiction between the starting performance at low Mach number and the aerodynamic performance at high Mach number. The inlet works normally and stably over a wide speed range. The total pressure recovery coefficient reached 0.87,0.74 and 0.47 at Mach number2, 3 and 4, respectively.
-
(2). As backpressure increases, shock train changes from strong
 $\lambda$-type to weak $\lambda$-type and finally to normal shock wave. The structure of shock train changes to match the lower pressure caused by the large bleed window. For the inlet with large bleed window, the region near the throat consists of three areas including the low pressure near the bleed window, which could not be ignored. Low -pressure airflow near the large bleed window mixes the original high-pressure airflow behind the shock train, which leads to the decline of the overall pressure in the area from suction slots to entrance of the diffuser.
-
(3). Total pressure recovery of the inlet is based on the backpressure ratio. The performance near the critical condition improves to 8.5% as Pe/P0 increases from 13 to 14.6 at Mach number 2.5. The large bleed window promotes the anti-backpressure capacity of the inlet. It proves that the scheme adopted in this paper has a great effect on terminal shock wave control and inlet performance improvement.
-
(4). Low-frequency and high-amplitude oscillation, high-frequency and small-amplitude oscillation exist at the same time when the backpressure ratio is 13.1. Low-frequency oscillation is the primary oscillation while higher-frequency peaks are harmonic signatures related to the primary oscillation. Influence of background wave and the large bleed window are the main reasons causing the oscillation.


Acknowledgements
This work is supported by the National Natural Science Foundation (No.11772155) and Postgraduate Research & Practice Innovation Program of Jiangsu Province (No.KYCX18_0313).
Supplementary material
To view supplementary material for this article, please visit https://doi.org/10.1017/aer.2021.76