1. INTRODUCTION
Many astrophysical phenomena involve the interaction of shock waves with inhomogeneous background media (Remington et al., Reference Remington, Drake and Ryutov2006). Among the factors influencing the dynamics of the interaction are the amplitude of the density variations and the spatial scale length of these variations (Philippe et al., Reference Philippe, Canaud, Fortin, Garaude and Jourdren2004). Scaled laboratory experiments would allow researchers to study the basic physics involved in the process and to validate the use of astrophysical simulation codes. Most experiments carried out so far use a laser-driven shock wave to study its interaction on a single “clump”. A major disadvantage of these experiments is that the volume that can be shocked with lasers is very small (on the order of 100 μm). In contrast, magnetically accelerated flyer plates can drive strong shocks in millimeter-sized targets. This technique has achieved flyer velocities of more than 20 km/s and is already being used routinely for equation-of-state measurements, in which shock pressures in the megabar range have been achieved (Knudson et al., Reference Knudson, Desjarlais and Dolan2008). Shock wave interaction experiments using magnetically accelerated flyer plates have been proposed for the Z machine (Drake, Reference Drake2002).
While the parameters achievable with Z are unmatched, its limited shot rate (typically one shot per day) and the high operation costs require complementary experiments on smaller pulsed-power machines to develop the experimental setup and to take additional measurements. We have therefore started to develop the experimental capabilities for such experiments and have demonstrated velocities of up to 8 km/s with 50 μm thick aluminum flyer plates (Neff et al., Reference Neff, Ford, Wright, Martinez, Plechaty and Presura2009, Reference Neff, Martinez, Plechaty, Stein and Presura2010) using the Zebra accelerator at the Nevada Terawatt Facility (NTF). We are currently designing initial shock wave experiments with transparent targets (Plexiglas, ClearFlex), which allow us to monitor the shock wave propagation with standard laser diagnostics; first tests demonstrate that the shock is indeed visible in the diagnostics. Using transparent targets in our experiments is an intermediate step; once X-ray backlighting is operational in our facility, we will switch to low-density foam targets that allow for a higher compression ratio and the possibility of density modulations.
In this paper, we present a new one-dimensional hydrodynamic simulation code that we have developed to model the shock dynamics in homogeneous targets. This allows us to predict the shock strength and the shock attenuation in the experiment. Since the code uses Hugoniot parameters for its calculations, running the simulation does not require access to SESAME equation-of-state data. To validate the code, we compare the results of a simulation for a flyer impact onto a Plexiglas target with results obtained from analytic theory.
The structure of this paper is as follows. We start in Section II by discussing the properties of Hugoniot curves and how they can be used to calculate the initial shock parameters before the shock is attenuated. In Section III we discuss the physical model and the numerical approximations in our simulation code, followed by a detailed discussion of a sample impact simulation in Section IV. Having compared the results with analytic theory, we conclude by giving an outlook on planned experiments at the Nevada Terawatt Facility and planned code improvements.
2. ANALYTICAL CALCULATION OF THE INITIAL SHOCK PARAMETERS
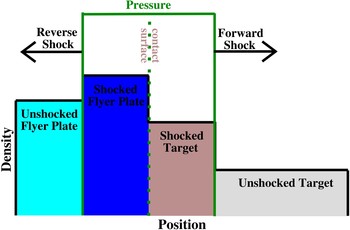
In our experiments, a flyer plate that has been accelerated magnetically impacts on a stationary target, creating shock waves. The situation shortly after the impact is illustrated in Figure 1. The impact creates a shock wave moving into the target (forward shock) and a shock wave moving into the flyer plate (reverse shock). A contact surface separates the shocked flyer material and the shocked target material. Since the flyer plate and the target stay in contact, the fluid velocity is continuous across the contact surface. Furthermore, the contact surface has no mass (and therefore no momentum), so that the pressure also has to be continuous across the contact surface. In contrast, the density and other properties like the specific internal energy are discontinuous across the contact surface. Once the reverse shock reaches the end of the flyer, it is reflected as a rarefaction wave that then catches up with the forward shock and attenuates it.
(Color online) Schematic flyer impact experiment. A flyer plate moving with constant velocity impacts upon a target at rest. Initially two shock waves are formed: a forward shock moving into the target and a reverse shock moving into the flyer plate. Shown are the density (boxes) and the pressure (green line) distribution in the system. The flyer and the target are separated by a contact surface. The pressure and the fluid velocity are continuous across this surface, whereas the density is not.

The initial properties of the shock waves can be calculated from basic considerations. For shock waves, the conservation of mass, momentum, and energy implies three jump conditions, the Rankine-Hugoniot equations (Zel'dovich & Raizer, Reference Zel'dovich and Raizer2002). Hugoniot curves combine these jump conditions with the equation-of-state and map the states that can be achieved by compression with a single shock from a given initial state of the medium, depending on the shock strength. In our calculations, we assume that the stress tensor is diagonal, thereby neglecting shear stress. The stress tensor is then equivalent to a scalar pressure term. This model is similar to the treatment of fluids, with the key difference that the solid can support tensile stress (equivalent to a negative pressure). This scalar pressure approximation is valid as long as the pressure is much larger than the yield strength of the solid, since in this case the non-diagonal elements of the stress tensor are much smaller than its diagonal pressure components.
Hugoniot curves can be expressed in different sets of state variables, for instance, shock pressure-specific volume (p S − V), shock pressure-fluid velocity (p S − u), or shock velocity—fluid velocity (U S − u). For many materials, the last relation is linear in good approximation if no phase transition takes place (Davison (Reference Davison2008); Zel'dovich & Raizer, (Reference Zel'dovich and Raizer2002)):

Here C 0 is a parameter that is usually very close to the bulk sound speed (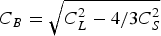 ; C L: longitudinal sound speed, C S: shear wave velocity) of the material, and S is a dimensionless constant (Marsh, Reference Marsh1980). Combining this linear relationship with the Rankine-Hugoniot equations yields a relation for the shock pressure (Davison, Reference Davison2008):

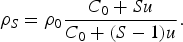
For the compressed target it follows that its density is given by
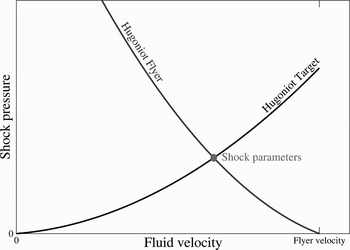
The continuity of pressure and fluid velocity at the contact surface separating the shocked target from the shocked flyer can be used to determine the parameters of both shock waves by plotting the shock pressure—fluid velocity Hugoniot curves of the flyer and the target. The Hugoniot curve of the flyer is calculated from the standard Hugoniot curve (Eq. (2)) by reflecting the principal Hugoniot at the vertical axis (since the reverse shock is moving to the left) and then shifting the curve to the right, so that it is centered on the flyer velocity (v fl), since the flyer material initially moves with the flyer velocity. This corresponds to the equation

Calculating the intersection of the two curves determines the pressure and the fluid velocity in the region between the two shock waves, since both properties are continuous across the contact surface. This method is illustrated in Figure 2.
Determining the shock properties. Plotted are the Hugoniot curves for the target material (forward shock) and the impacting flyer plate (reverse shock). The intersection determines the shock pressure and fluid velocity for both the forward shock and the reverse shock.

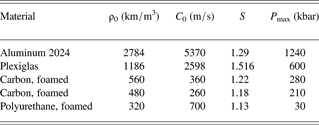
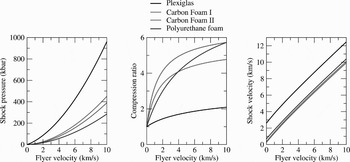
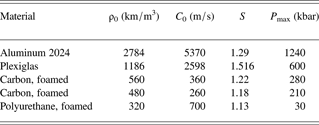
To give an overview over the range of shock pressures and compression ratios that can be achieved with experiments at the NTF Zebra facility, we have calculated the corresponding curves for flyer velocities of up to 10 km/s and several target materials. All calculations assume aluminum flyers. The target materials in the calculations are Plexiglas, which was used for first impact experiments (Neff et al., Reference Neff, Ford, Wright, Martinez, Plechaty and Presura2009, Reference Neff, Martinez, Plechaty, Stein and Presura2010), carbon foam at two densities, and polyurethane foam. The Hugoniot data used for these calculations is listed in Table 1.
Hugoniot Parameters. Given are the density (ρ0), the Hugoniot parameters (Eqn. (1)) and the pressure up to which the Hugoniot data has been validated (P max). The data is taken from (Marsh (Reference Marsh1980); Davison (Reference Davison2008))
The calculated shock pressures, compression ratios, and shock velocities are plotted as a function of the initial flyer velocity in Figure 3. The calculations show that we can reach large shock pressures and compression ratios with our flyer impact experiments. A 5 km/s aluminum flyer hitting a Plexiglas target creates a 319 kbar shock that has a velocity of 7.8 km/s and achieves a compression ratio (compressed density/initial density) of 1.8. In experiments using the foam targets listed in Table 1, the same flyer creates shocks with up to 131 kbar pressure that move with a velocity of up to 5.8 km/s and reach a compression ratio of up to 5.2.
Shock pressures, compression ratios and shock velocities. The shock parameters are plotted as a function of the initial flyer plate velocity for several target materials. All calculations assume an aluminum 2024 flyer plate. Four target materials are analyzed: Plexiglas (1186 kg/meter3), carbon foam at 560 kg/m3 (I) and 481 kg/m3 (II) and polyurethane foam (320 kg/m3). Since only the initial shock properties are calculated, the thickness of the flyer does not influence the results.

These parameters apply to the initial phase of the shock, as depicted in Figure 1. Once the reverse shock reaches the left end of the flyer, a rarefaction wave is launched that catches up with the forward shock and attenuates it. The situation is further complicated by additional reflections at the flyer-target interface and the free surface of the flyer. To calculate the resulting shock profile, we have developed a uni-axial (1D) hydrodynamic simulation code. The following sections describe the simulation code and a sample simulation for an impact onto a Plexiglas target.
3. SIMULATING THE EVOLUTION OF ONE-DIMENSIONAL SHOCK WAVES
Modeling the dynamics of a non-viscous fluid requires solving the Euler equations (which ensure the conservation of mass, momentum, and energy) coupled with an equation-of-state for the material. Usually the material is modeled based on tabulated SESAME data, or modeled as a Mie-Grüneisen solid, or a polytropic gas. In contrast, in our simulation code (impact), we use an alternative approach that uses the linear Hugoniot curve (Eq. (1)) to calculate the stress in the medium (Drumheller, Reference Drumheller1998). In using this approach, we make three assumptions.
First, we assume that the shock pressure is much higher than the shear strength of the material (which is typically less than 1 kbar). This limitation rules out the simulation of elastic or elastic-plastic waves. Second, we assume that the Hugoniot curve for secondary shocks is very similar to the principal Hugoniot curve, so that the knowledge of the principle Hugoniot is sufficient for the calculations. The error made in this approximation is modest; for instance, in aluminum, it is smaller than 9% for shocks of up to 300 kbar (Davison, Reference Davison2008). Third, we also assume that we can approximate the decompression isentrope with the principal Hugoniot. This error is also small; for aluminum, it is smaller than 2% for a relaxation from pressures of up to 300 kbar (Davison, Reference Davison2008).
The overall error caused by these approximations is minor and our approach has the advantage over more complete equations of state (like SESAME) that it uses Hugoniot parameters, which are readily available for a wide variety of materials (for example, in data collections (Marsh, Reference Marsh1980)).
To determine the shock evolution, our code solves the one-dimensional Euler equations using a Lagrangian grid. It is straightforward to simulate problems involving more than one material, since there is no fluid transport across cell boundaries, so that the type of material in each cell does not change. Another advantage of using a Lagrangian grid is that it ensures the conservation of mass independent of numerical errors, since the mass elements assigned to each cell are fixed.
The Euler equations that we use to model our problem do not take viscosity into account. However, we include an artificial viscous stress (von Neumann-Richtmyer viscosity) in our calculations to stabilize the numerics. This artificial viscosity spreads the shock front over several grid points, but does not influence the jump conditions, provided the resulting width of the shock front is much smaller than the typical dimension of the problem (von Neumann & Richtmyer, Reference von Neumann and Richtmyer1950).
The code solves the system of partial differential equations by the following method. In the first step, the arrays for grid positions, grid velocities, grid acceleration, mass densities, and stress are initialized. The code then iterates over time, approximating spatial derivatives by finite differences. To calculate the time derivatives, our code uses the explicit Euler scheme with an adaptive time step. Based on a given start value, the time step is increased by a constant factor in each time iteration, until it reaches the maximum time step. This limit ensures the stability of the solution and is given by the minimum of the transit time for a signal across any grid cell

where Δx (i, t) is the width of the i-th cell, and U S (i,t) is the shock speed in the i-th cell (calculated from the fluid velocity and the linear Hugoniot curve). We use an additional safety factor (<1) to limit the time step further. A consequence of this limit for the time step is that an increase in spatial resolution results in a decrease of the time step, so doubling the spatial resolution increases the required computations by a factor of up to four.
Each time iteration consists of several computations. In the first computation, the code calculates the acceleration of each grid point from the two stresses applied in the elements on both sides of it. In the next computation, the new velocity of the grid point is calculated from its previous velocity and the acceleration. Then the new grid positions are calculated, resulting in the new density. The last computation determines the new stress by adding the artificial viscous stress to the stress calculated from the principal Hugoniot. This completes the time step, and the time iteration proceeds.
The code saves the calculated fluid properties at specified time intervals, enabling us to study the evolution of the problem in detail. In the next section, we discuss the evolution of the shock for a flyer impacting on Plexiglas, which is the material we used in our first impact tests (Neff et al., Reference Neff, Ford, Wright, Martinez, Plechaty and Presura2009, Reference Neff, Martinez, Plechaty, Stein and Presura2010). Using a transparent target material allows us to determine the shock structure with optical methods such as shadowgraphy or schlieren imaging.
4. A SAMPLE CASE: AN ALUMINUM FLYER PLATE IMPACTING A PLEXIGLAS TARGET
The simulation assumes that a 100 μm thick aluminum flyer plate impacts onto a 3 mm thick Plexiglas target at a speed of 5 km/s. The Hugoniot data for the materials used in this simulation is listed in Table 1. The code uses free-moving boundaries by setting the external stress acting on the left-hand side of the flyer and the right-hand side of the target to zero. The simulation uses an initial grid spacing of 1 μm for both the flyer and the target, resulting in a total of 3101 grid points.
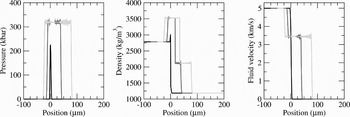
We know from our previous discussion (see Section 2) that in the initial phase of the impact (before the reverse shock reaches the left end of the flyer) a rectangular pressure pulse is created and that the target and flyer are separated by a contact surface. The analytical calculations outlined in Section 2 yield a shock pressure of 319 kbar, a fluid velocity of 3.45 km/s, a shock velocity of 7.8 km/s, and density of 2.12·103 kg/m3 of the shocked Plexiglas.
To compare these results with our simulation, we have plotted profiles for the pressure, the density, and the fluid velocity in Figure 4 for this initial phase. The profiles are plotted for three times: 0.1 ns, 5 ns, and 10 ns after the beginning of the impact. To make the graphs easier to analyze, we have set the initial position of the flyer-target interface to zero. Comparing the simulated profiles to the analytical results, we see that the very beginning of the simulation (see the snapshots at 0.1 ns) the code has problems sampling the problem correctly, since only a few grid points are inside the shocked region. This is most obvious in the pressure plot, which shows a peak pressure of only 225 kilobar. Once a sufficient number of grid points are involved (see the snapshots at 5 ns), the code reproduces the analytical results very accurately. The amplitudes of the calculated shock pressure, fluid velocity, and densities match the calculated results very precisely, and the only difference between the analytical results and the simulation are numerical oscillations on top of the profiles. These oscillations are of small amplitude and do not increase over time (as can be seen by comparing the snapshots at 5 ns and 10) and therefore do not influence the results significantly.
Initial shock profiles. Plotted are the calculated shock pressure, mass density, and fluid velocity at three times: 0.1 ns, 5 ns, and 10 ns after the beginning of the impact. These results are for a 100 μm thick aluminum flyer plate impacting a Plexiglas target at a speed of 5 km/s. The position coordinate is centered on the initial position of the flyer-target interface. The profiles for t = 0.1 ns differ from the analytical results, since the number of grid points involved in the sampling is insufficient. Later on, however, the calculated profiles match the analytical results, with the exception of some low-amplitude numerical oscillations.

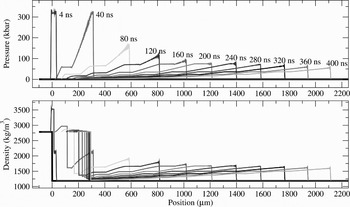
At later times, reflections at the free surface of the flyer and at the interface between the flyer and the target result in an attenuation of the shock as it propagates into the target. Figure 5 shows the evolution of the pressure and the density distribution within the first 400 ns. Within this time, the shock travels over 2 mm into the target. The shock pressure starts dropping after propagating for approximately 300 μm; it drops from 319 kbar to 55 kbar after 2.1 mm. The simulation show a detailed structure behind the shock front, due to the effect of the aforementioned reflections. Once the flyer has transferred nearly all its kinetic energy to the target, the profile simplifies and approaches that of the impulsive load problem: a shock front followed by a simple rarefaction wave. The density plots show that the flyer plate has slowed considerably after 150 ns and nearly all its kinetic energy has been transferred to the target material. At this point, the velocity of the flyer plate is only 600 m/s, showing that the flyer has transferred more than 99% of its initial kinetic energy to the target.
Shock evolution. Plotted are the pressure and density profiles for a 100 μm thick aluminum flyer (velocity 5 km/s) impacting a Plexiglas target at rest. Shown are the initial state (bold line) and the profiles at 4 ns and for every 40 ns. The initial shock pressure is 319 kbar; after 400 ns it is reduced to 55 kbar.

For a polytropic gas, the impulsive load problem has a self-similar solution, in which the position of the forward shock front (X) is given by a power law (Zel'dovich & Raizer, 2002)

with A and α constant. The allowed range of the parameter α is limited by the conservation of momentum and energy, limiting it to 1/2 < α < 2/3.
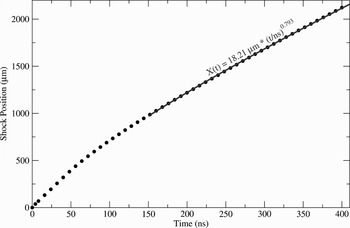
This behavior suggests that the exponential behavior might also be applicable for materials with other equations-of-state, as in our case. To test this hypotheses, we have plotted the shock position over time and used regression to fit a power-law ansatz to the data (for t > 150 ns). Figure 6 shows the results. The plot shows that the power law ansatz is in very good agreement with the data. The best fit is given by

Movement of the shock front. Plotted is the position of the forward shock front (X) over time (t). For late times (t > 150 ns), the data is fitted with a power-law ansatz (X(t) = A·t α).

The exponent α is slightly bigger than the maximum for a polytropic gas (2/3); the shock is therefore slightly less attenuated in the solid target than it would be in a polytropic gas.
The power law can also be used to calculate the shock properties in the impulsive load limit without referring to the simulation results directly. Taking the time derivative of Eq. (7) yields the shock velocity:

From Equations (1, 2, 8) it follows that

Equations (1,3,8) yield the shocked density

After propagating for 2 mm, the shock pressure has fallen to 17% of its initial value, the shock velocity to 54% of its initial value, and the shocked density to 75% of the initial shocked density. Since the flyer parameters used in this calculated are comparable to those already demonstrated in our facility (Neff et al., Reference Neff, Martinez, Plechaty, Stein and Presura2010), this shows that we will be able to drive strong shocks in our transparent target for a distance of more than 1 mm.
5. CONCLUSIONS
We have demonstrated that our new simulation code impact is able to reproduce the shock profiles that are expected analytically. While finite viscosity and heat conduction will smooth the profiles slightly in reality, the effects on the overall shock properties is small.
We are also currently working on improving our experimental setup for flyer acceleration by using a recently developed load current multiplier (Chuvatin et al., Reference Chuvatin, Rudakov, Weber, Bayol and Cadiergues2005) that has already been successfully tested on Zebra. This will increase our load current from 1 MA to 1.4–1.6 MA. The resulting increase of magnetic pressure in our short-circuit load will enable us to reach higher flyer velocities and/or use thicker flyer plates (currently 8 km/s for a 50 μm thick aluminum flyer). Together with new diagnostics (VISAR and X-ray backlighting), this will enable us to carry out scaled flyer-impact experiments with foam target.
ACKNOWLEDGMENTS
This work has been supported by DOE/NNSA under UNR grant DE-FC52-06NA27616.