1. Introduction
Volcano–sedimentary sequences are stratigraphic successions derived from the combination of volcanic and sedimentary events. They commonly occur in the areas surrounding volcanic arcs (e.g. Be’Erishlevin et al. Reference Be’Erishlevin, Eyal, Eyal, Whitehouse and Litvinovsky2012; Wang et al. Reference Wang, Zhu, Liu, Luo, Ge, Zhang, Ren and Cui2017; Song et al. Reference Song, Xiao, Collins, Glorie, Han and Li2018), with a distinctive feature of the alternation of primary volcanic facies and sedimentary facies (Boulter et al. Reference Boulter, Hopkinson, Ineson and Brockwell2004). This presents an opportunity to accurately discriminate formation mechanism according to the coupled geochemical fingerprints of volcanics and sediments (e.g. Ali-Bik et al. Reference Ali-Bik, Rahim, Wahab, Abayazeed and Hassan2017; Wang et al. Reference Wang, Zhu, Liu, Luo, Ge, Zhang, Ren and Cui2017). Specifically, marine chemical sediments within volcano–sedimentary sequences are important for tracing past surface processes. Their trace elements together with C–O–Nd isotope systematics recorded certain aspects of seawater composition through Earth’s history, and reflect a balance between mantle-derived and continental-derived inputs (Bolhar et al. Reference Bolhar, Kamber, Moorbath, Fedo and Whitehouse2004; Alexander et al. Reference Alexander, Bau, Andersson and Dulski2008).
The Songpan–Ganzi Orogen (SGO) is located in the eastern Tibetan Plateau and to the west of the Yangtze Block (Fig. 1a). It was formed during final closure of the Palaeo-Tethys Ocean and Triassic continental collision between the North China, Yangtze and Qiangtang Blocks (Xu et al. Reference Xu, Hou, Wang, Fu and Huang1992). The SGO is characterized by a 5–15 km thick Triassic flysch sequence that was intruded by Late Triassic to Early Jurassic granitoids (Roger et al. Reference Roger, Jolivet and Malavieille2010). Extensive studies have long been conducted on the petrogenesis of the Triassic flysch (e.g. She et al. Reference She, Ma, Mason, Li, Wang and Lei2006; Zhang et al. Reference Zhang, Li, Wei, Cai and Zhang2008) and granitoid melts (e.g. Xiao et al. Reference Xiao, Zhang, Clemens, Wang, Kan, Wang, Ni and Liu2007; Yuan et al. Reference Yuan, Zhou, Sun, Zhao, Wilde, Long and Yan2010). However, little attention has been paid to the pre-Triassic strata, which could offer important information on the SGO development history.
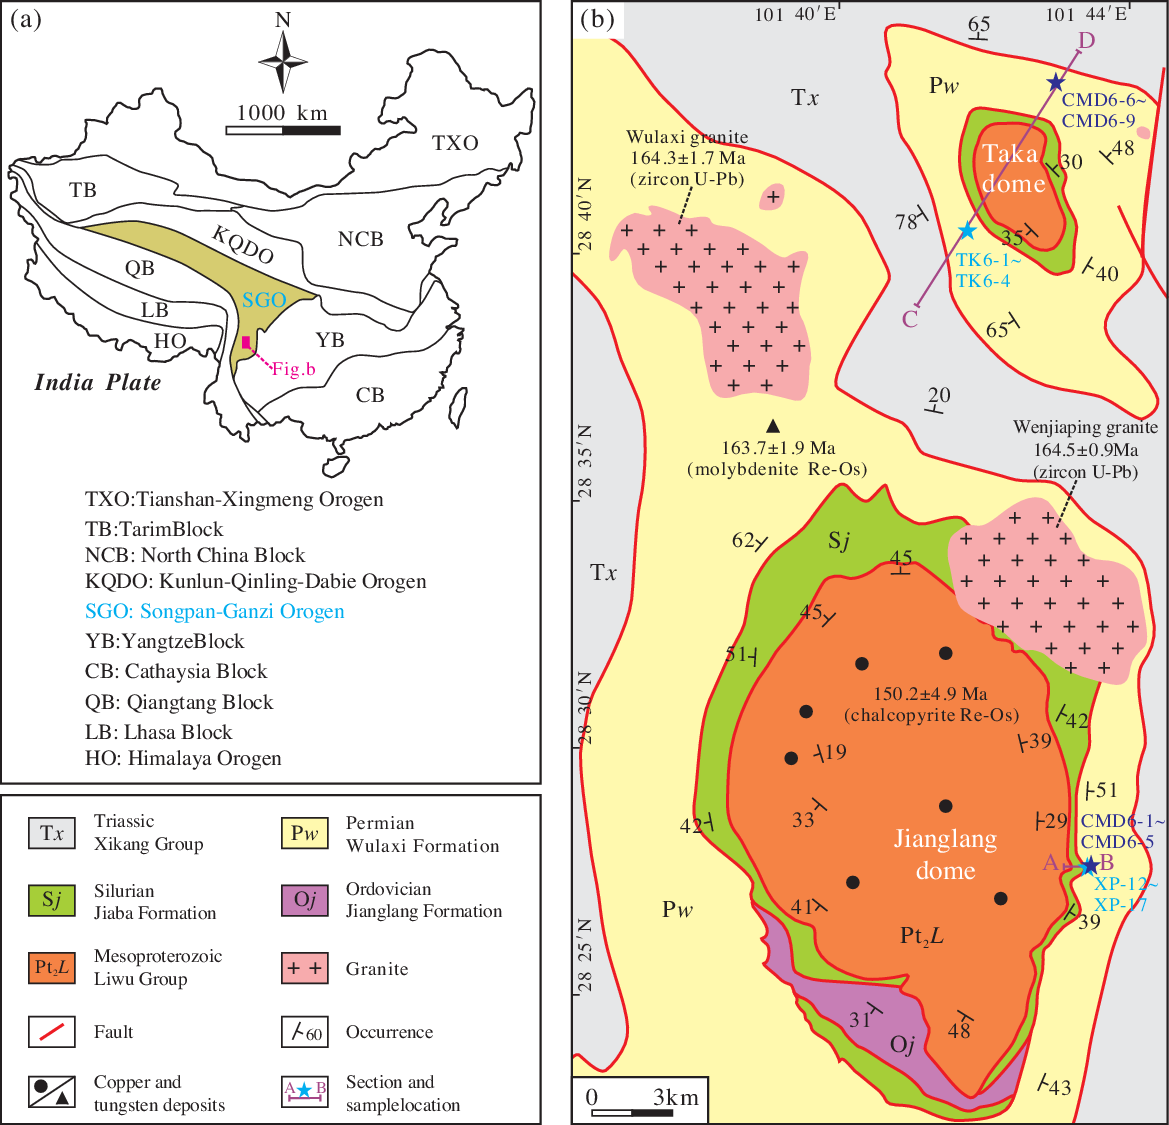
Tectonic position (a) and regional geological map (b) of the Jianglang dome and the Taka dome, modified after Yan et al. (Reference Yan, Zhou, Song and Fu2003).

Previous studies identified a group of tectonic domes in the eastern margin of the SGO, and classified them as metamorphic core complexes (Yan et al. Reference Yan, Song, Fu and Tian1997). These domes were formed under an extensional regime at the end of the Variscan period (Early Devonian to Late Permian), and were related to regional thermal anomaly and magmatic activity (Yan et al. Reference Yan, Song, Fu and Tian1997). They thus provide deep insights for understanding tectonic evolution of the eastern Tibetan Plateau and the Palaeo-Tethys ocean (Xu et al. Reference Xu, Hou, Wang, Fu and Huang1992; Yan et al. Reference Yan, Zhou, Song and Fu2003). The Jianglang dome and the Taka dome situate in the southern SGO (Fig. 1), and their Permian strata are composed of marble with sandwiched metabasalt. However, this metavolcano–sedimentary assemblage has not been systematically studied in available publications, and its formation mechanism remains an enigma.
Stable C–O isotope and radiogenic Nd isotope studies can provide information about the marble origin (e.g. Murra et al. Reference Murra, Casquet, Locati, Galindo, Baldo, Pankhurst and Rapela2016; Tao et al. Reference Tao, Zhang, Li, Zhu and Ke2018; Zhu et al. Reference Zhu, Zhang, Lu and Bader2018; Lajoinie et al. Reference Lajoinie, Lanfranchini, Recio, Sial, Cingolani, Ballivián Justiniano and Etcheverry2019). For example, O isotope is used to distinguish the sedimentary carbonate (δ18OV-SMOW = 30–15 ‰) from igneous carbonatite (δ18OV-SMOW = 10–6 ‰; Tao et al. Reference Tao, Zhang, Li, Zhu and Ke2018). Further, combined investigation of geochemistry and zircon U–Pb geochronology can clearly reveal the metabasalt protolith generation (e.g. Li & Chen, Reference Li and Chen2014; Schneider et al. Reference Schneider, Hoffmanna, Münker, Patyniakd, Sprungb, Roerdinke, Garbe-Schönberg and Kröner2019). Therefore, an integrated study of geochemical and isotopic data is conducted on the Permian metavolcano–sedimentary sequence in the southern SGO. These data place significant constraints on its depositional age and tectonic setting, and help to provide an insight into the SGO tectonic evolution.
2. Geological setting
The SGO covers a triangular-shaped area of c. 2.2 × 10⁵ km2 at the junction of the North China, Yangtze and Qiangtang blocks (Fig. 1a). This region is bounded by the Longmenshan thrust belt to the east, Kunlun–Animaqing suture to the north, and Jinshajiang suture and Yidun volcanic arc to the southwest (Xu et al. Reference Xu, Hou, Wang, Fu and Huang1992). The SGO is mainly filled by a 5–15 km thick succession of folded Middle to Late Triassic flysch (Xikang Group), and a 4–6 km thick pre-Triassic stratum exposed along its eastern and southern margins (Roger et al. Reference Roger, Jolivet and Malavieille2010). The voluminous flysch series are dominated by a sequence of alternating shale and sandstone, with minor carbonate and greywacke. They were fed from a peripheral arc and the adjacent continental blocks, and also recorded supracrustal history during Triassic continental collision (Weislogel et al. Reference Weislogel, Graham, Chang, Wooden, Gehrels and Yang2006). Granitoid melts intruded into the flysch series from Late Triassic to Early Jurassic (Roger et al. Reference Roger, Jolivet and Malavieille2010). These intrusions show A-type and adakitic affinities, and were interpreted to reflect delamination-related extension (Roger et al. Reference Roger, Malavieille, Leloup, Calassou and Xu2004; Xiao et al. Reference Xiao, Zhang, Clemens, Wang, Kan, Wang, Ni and Liu2007; Zhang et al. Reference Zhang, Parrish, Zhang, Xu, Yuan, Gao and Crowley2007).
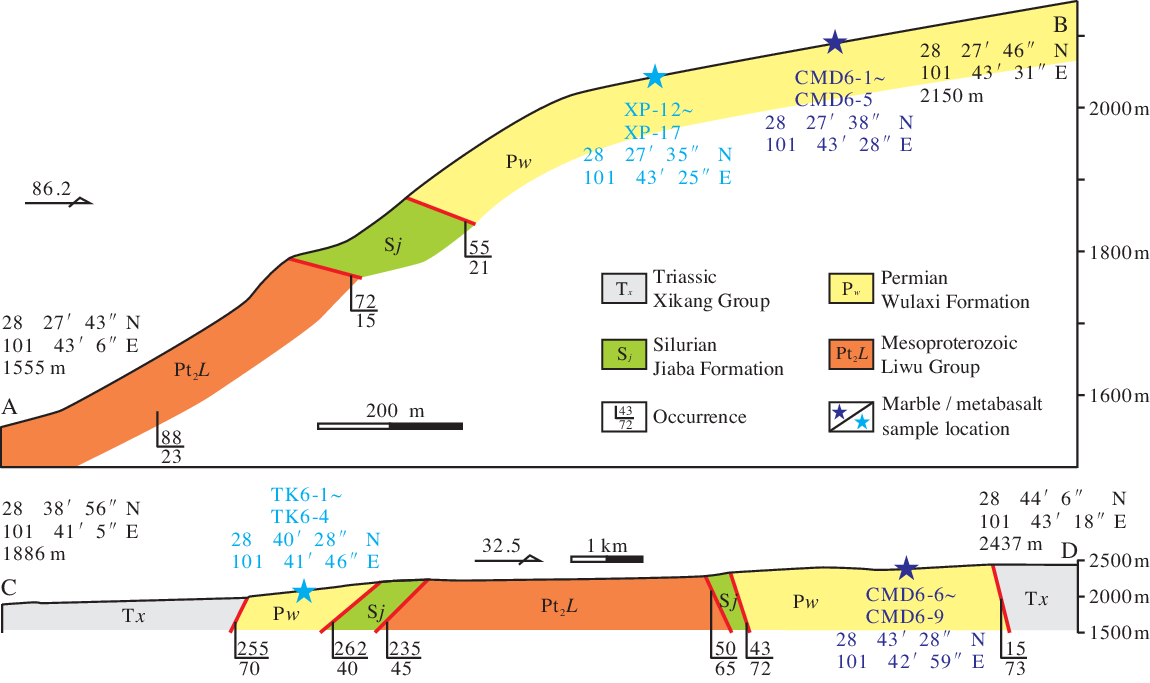
The Jianglang dome and the Taka dome are located in the southern margin of the SGO (Fig. 1). They consist of three tectonostratigraphic units: (1) a core of schist complex known as the Mesoproterozoic Liwu Group, (2) an overlying ductilely deformed middle slab of the Palaeozoic metasedimentary and metabasic rocks and (3) a weakly metamorphosed sedimentary cover of the Triassic Xikang Group (Yan et al. Reference Yan, Zhou, Song and Fu2003). The middle slab is separated from both the upper cover unit and the lower core complex by detachment faults (Figs. 1b, 2), which were interpreted as extensional in origin. There are also numerous detachment faults within the middle slab (Yan et al. Reference Yan, Zhou, Song and Fu2003). The Liwu Group mainly comprises two-mica (±quartz) schist, quartzite and minor interlayered metabasalt, with whole-rock Sm–Nd isochron age of 1677–1674 Ma. They underwent amphibolite to upper greenschist facies metamorphism since the Neoproterozoic, with temperatures of 620–300 °C and pressures of 5.0–2.0 × 10⁸ Pa (Yan et al. Reference Yan, Song, Fu and Tian1997, Reference Yan, Zhou, Song and Fu2003). A series of hydrothermal Cu-sulphide deposits with high ore grades (average >2.5 wt % Cu) and large Cu reserves (>0.8 × 10⁶ tons) occur within this group. More recently, Zhou et al. (Reference Zhou, Li, Zhang, Li, Yuan, Feng, Li, Liao and Wang2017) obtained their mineralization age of 150.2 ± 4.9 Ma using direct chalcopyrite Re–Os dating (Fig. 1b).
Measured section in the Jianglang and Taka domes.

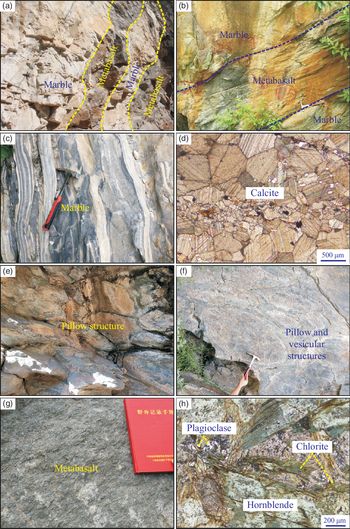
The middle slab is chiefly composed of (1) the Ordovician Jianglang Formation of quartzite and phyllite, (2) the Silurian Jiaba Formation of siliceous rock, carbonaceous slate and minor metabasalt, and (3) the Permian Wulaxi Formation of marble with sandwiched metabasalt. These strata show amphibolite to green-schist facies metamorphism during the Jurassic, under temperatures of 555–510 °C and a pressure of 3.8 × 10⁸ Pa calculated using hornblende–plagioclase geothermometry (Yan et al. Reference Yan, Song, Fu and Tian1997). Specifically, the Wulaxi Formation was assigned a Permian age based on regional stratigraphic correlation; it shows a total thickness of >1047.8 m, and an interbedded assemblage (Fig. 3a, b) of the 110.1–4.8 m thick marble and 55.2–1.3 m thick metabasalt (SBGMR, 1991).The Triassic Xikang Group, a major component of the SGO, is composed of terrigenous flysch and experienced lower greenschist facies metamorphism. These rocks are locally overprinted by later thermo-metamorphism as shown by biotite porphyoblasts cross-cutting cleavage. Two biotite separates yielded K–Ar ages of 131 Ma and 121 Ma, respectively (Yan et al. Reference Yan, Zhou, Song and Fu2003).
Field and microscopic features of the Permian marble and metabasalt. (a, b) The Permian marble interbedded with metabasalt. (c) Marble with banded structure in some locations. (d) Marble consisting of calcite. (e, f) Metabasalt with pillow and vesicular structures. (g) Metabasalt without xenoliths. (h) Metabasalt comprising plagioclase and hornblende with chloritization.

The Wenjiaping and Wulaxi granitic plutons are distributed in this study area (Fig. 1b). Previous laser ablation – inductively coupled plasma–mass spectrometry (LA-ICP-MS) zircon U–Pb dating indicates their emplacement ages of 164.5 ± 0.9 Ma and 164.3 ± 1.7 Ma, respectively (Dai et al. Reference Dai, Zhu, Li, Zhang, Tang and Shen2017). The Wulaxi tungsten deposit within the Permian strata is close to the above two granitic plutons (Fig. 1b). It has a mineralization age of 163.7 ± 1.9 Ma according to molybdenite Re–Os dating, and is proposed to be a magmatic–hydrothermal origin in a post-collisional setting (Li et al. Reference Li, Zhou, Zhang, Dai, Ma, Ma and Shen2016).
3. Sampling and analytical methods
In this paper, we employ geochemical and isotopic studies on marble and metabasalt samples to determine their formation mechanism and tectonic setting. The sample locations, marked in Figures 1b and 2, were chosen for their superior field outcrops. Five marble and six metabasalt samples were collected from the Jianglang dome, while four marble and four metabasalt samples were selected from the Taka dome (Fig. 1b). The sampling marble and metabasalt layers are 20–5 m and 8–1.5 m in thickness. Our samples are mainly gathered from four general locations, with sampling distances of 10–2 m. All these locations are far away from the structural belts (Fig. 2).
The marble is well bedded with banded structure in some locations (Fig. 3c), indicating that it has been ductilely deformed. It consists mainly of coarse-grained (800–50 μm) and subhedral to euhedral calcite with clear mechanical twins (Fig. 3d), suggesting a diagenetic origin. The metabasalt has obvious pillow and vesicular structures (Fig. 3e, f) without typical xenoliths (Fig. 3g) in the field. It primarily comprises hornblende (~80 %, 1000–50 μm) with chloritization (Fig. 3h), and plagioclase (~15 %, 200–10 μm) with polysynthetic twins, with minor quartz (<3 %, ~30 μm) and magnetite (~2 %, 100–50 μm).
Fresh marble and metabasalt samples were crushed to 200 meshes for whole-rock geochemistry determination. The measurements were carried out using the ME-XRF26 and ME-MS81 methods at the ALS Chemex Company of Guangzhou, China. Major oxides were conducted by wavelength-dispersive X-ray fluorescence spectrometry, with analytical errors less than 2 %. Trace elements were performed using a Perkin-Elmer ELAN 6000 ICP-MS with analytical precision better than 3 %. The general analytical procedures are described in Qi et al. (Reference Qi, Xu, Cawood, Wang and Du2019). Standard samples OREAS120 and NCSDC73303, as well as our studied samples TK6-3 and XP-16, were analysed in different test batches to monitor the analytical accuracy. Their concentrations were found to be in good agreement with the certified values as shown in Supplementary Table S1 in the Supplementary Material available online at https://doi.org/10.1017/S0016756820000230.
Marble carbon (C) and oxygen (O) isotopic analyses were also performed at the ALS Chemex Company of Guangzhou, China. The investigated samples were converted to CO2 using dehydrated phosphoric acid under a vacuum at 70 °C for 1 hour. C–O isotope ratios were measured using a MAT-253 gas mass spectrometer. Their isotopic data were reported in the conventional δ13CV-PDB and δ18OV-SMOW notations, with analytical uncertainties better than ±0.05 ‰ and ±0.08 ‰, respectively. The method accuracy was checked by measuring the international reference material NBS-19. It yielded δ13CV-PDB and δ18OV-SMOW values of 2.1 ‰ and 28.4 ‰, which were compatible with the certified values (1.95 ‰ and 28.6 ‰; Hoefs, Reference Hoefs2015). The calculation formula δ18OV-SMOW = 1.03091 * δ18OV-PDB + 30.91 (Hoefs, Reference Hoefs2015) was used to determine δ18OV-PDB values from δ18OV-SMOW.
Samarium (Sm) and neodymium (Nd) isotopic measurements of six marble samples were made on a Thermo Finnigan TRITON thermal ionization mass spectrometer (TIMS) at the Tianjin Center, China Geological Survey. Nd isotopic ratios were normalized to a 146Nd/144Nd ratio of 0.7219, and the precision for Sm and Nd concentrations was less than 0.5 % (2σ). The BCR-2 basalt standard yielded Sm = 6.497 ppm, Nd = 28.55 ppm, 147Sm/144Nd = 0.1376 and 143Nd/144Nd = 0.512645 ± 5 (2σ), consistent with the literature values of 6.58 ppm for Sm, 28.8 ppm for Nd (Bell et al. Reference Bell, Anglin and Franklin1989). Blanks during the course of this study averaged 0.02 ng for Sm and 0.03 ng for Nd.
Sample XP-12 for zircon U–Pb dating was collected from a 4.5 m thick metabasalt layer in the Jianglang dome (Figs. 1b, 2), with a weight of ~10 kg. There is no distinct evidence that might indicate crustal assimilation, such as xenoliths (Fig. 3g). Zircons were separated with conventional heavy liquid and magnetic separation methods. The grains were mounted in epoxy, polished and then gold-coated. Cathodoluminescence (CL) images were taken to examine their internal morphology. Zircon U–Pb isotopic measurements were conducted at Nanjing FocuMS Technology Co. Ltd. Teledyne Cetac Technologies Analyte Excite laser-ablation system (Bozeman, Montana, USA) and Agilent Technologies 7700x quadrupole ICP-MS (Hachioji, Tokyo, Japan) were combined for zircon U–Pb dating. The 193 nm ArF excimer laser, homogenized by a set of beam delivery systems, was focused on zircon surface with fluence of 6.0 J cm−2. Ablation protocol employed a spot diameter of 35 μm at 8 Hz repetition rate for 40 s (equating to 320 pulses). Helium was applied as carrier gas to efficiently transport aerosol to ICP-MS. Zircon 91500 was used as an external standard to correct instrumental mass discrimination and elemental fractionation during the ablation. Zircon GJ-1 was treated as quality control for geochronology. These two standards were analysed every eight analyses. The obtained mean 207Pb/206Pb age of 91500 (1063.2 ± 1.8 Ma) and 206Pb/238U age of GJ-1 (600.4 ± 2.5 Ma) are within experimental error of their recommended values (1065.4 ± 0.6 Ma, Wiedenbeck et al. Reference Wiedenbeck, Alle, Corfu, Griffin, Meier, Oberli, Von Quadt, Roddick and Spiegel1995; 599.8 ± 4.5 Ma, Jackson et al. Reference Jackson, Pearson, Griffin and Belousova2004). Lead abundance of zircon was externally calibrated against NIST SRM 610 with Si as internal standard. Raw data reduction was performed offline by ICPMSDataCal software (Liu et al. Reference Liu, Gao, Hu, Gao, Zong and Wang2010).
4. Results
4.a. Marble
4.a.1 Rare earth elements and yttrium
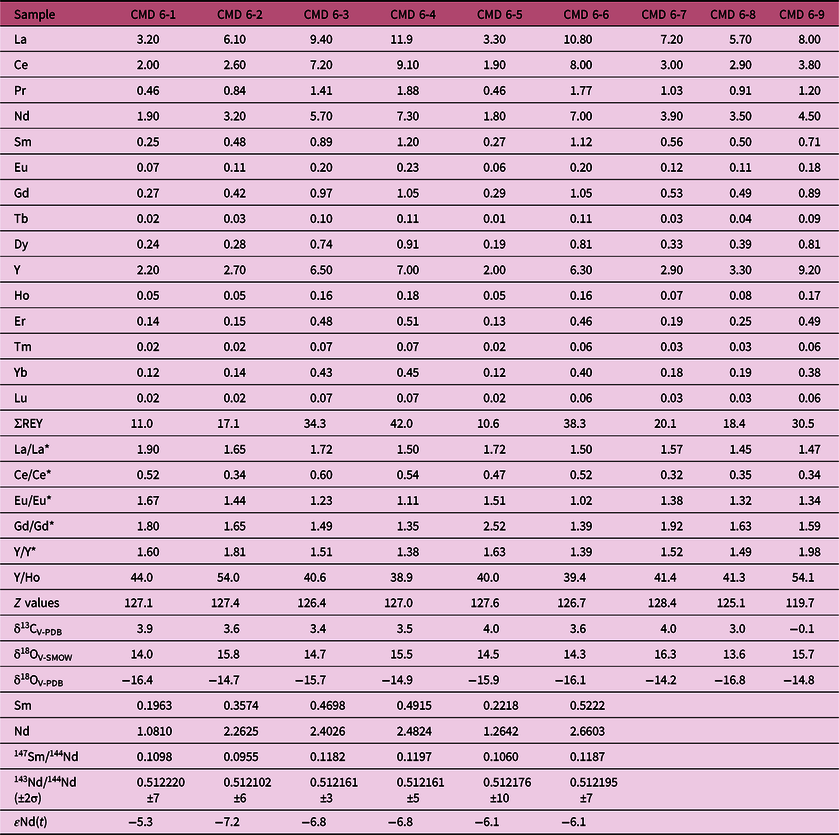
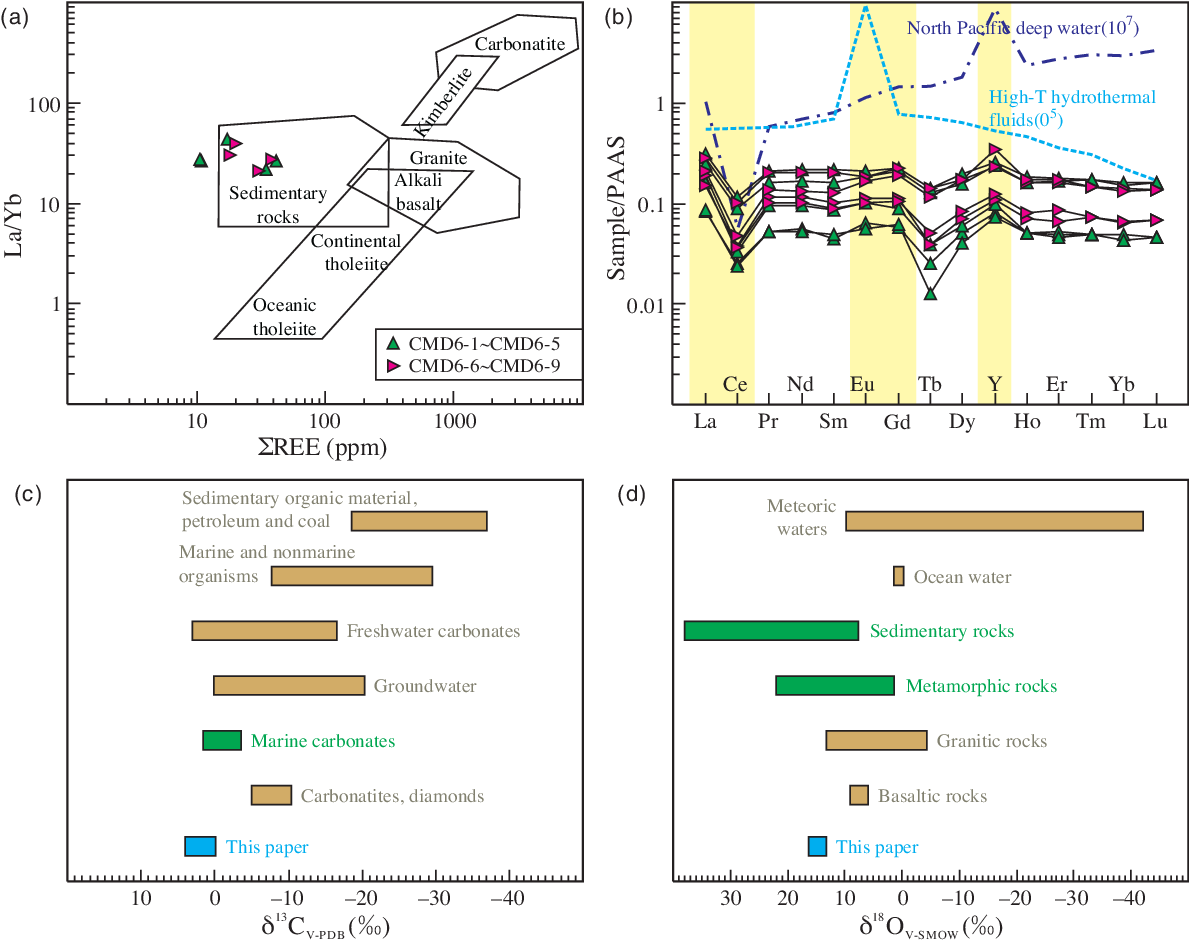
Rare earth elements and yttrium (REY) abundances of the Permian marble are provided in Table 1. The samples have relatively high La (average 7.29 ppm), Ce (average 4.50 ppm), Pr (average 1.11 ppm), Nd (average 4.31 ppm) and Y (average 4.68 ppm) concentrations, while other elements are present commonly lower than 1.00 ppm. They exhibit depletion in rare earth elements (REEs) and yttrium, with low ΣREY varying between 42.0 ppm and 10.6 ppm. The La/Yb vs ΣREE diagram apparently indicates a sedimentary origin for their protolith (Fig. 4a). Importantly, the marble samples show marked negative Ce anomalies (Ce/Ce* = 0.60–0.32), and positive La (La/La* = 1.90–1.45), Eu (Eu/Eu* = 1.67–1.02), Gd (Gd/Gd* = 2.52–1.35) and Y (Y/Y* = 1.98–1.38) anomalies in their PAAS (Post-Archaean Australian Shale)-normalized REY pattern (Fig. 4b).
Rare earth elements (ppm), C–O isotopic (‰) and Sm–Nd isotopic data of the Permian marble

Notes: (1) The calculation of anomalies is according to Bolhar et al. (Reference Bolhar, Kamber, Moorbath, Fedo and Whitehouse2004) and Bau & Dulski (Reference Bau and Dulski1996), La/La* = LaPAAS/(3PrPAAS − 2NdPAAS), Ce/Ce* = CePAAS/(2PrPAAS − NdPAAS), Eu/Eu* = EuPAAS/(0.67SmPAAS + 0.33TbPAAS), Gd/Gd* = GdPAAS/(0.33SmPAAS + 0.67TbPAAS), Y/Y* = YPAAS/(0.5DyPAAS + 0.5HoPAAS), and the values of PAAS after McLennan (Reference McLennan1989). (2) εNd(t) is calculated back to the age of 255 Ma.
(a) La/Yb vs ΣREE protolith reconstruction diagram (after Allegre & Minster, Reference Allegre and Minster1978). (b) PAAS-normalized REY pattern of the Permian marble, the values of PAAS, North Pacific deep water and high-T hydrothermal fluids after McLennan (Reference McLennan1989), Alibo & Nozaki (Reference Alibo and Nozaki1999) and Bau & Dulski (Reference Bau and Dulski1999), respectively. (c, d) Carbon and oxygen isotopes of important geological reservoirs and this paper, modified after Hoefs (Reference Hoefs2015).

4.a.2. C–O isotopes
C–O isotope data of the Permian marble are listed in Table 1. The samples have δ13CV-PDB values ranging from 4.0 ‰ to −0.1 ‰, similar to marine carbonates and different from carbonatites (Fig. 4c). They show high δ18OV-SMOW values of 16.3 ‰ to 13.6 ‰, which are in the field of sedimentary and metamorphic rocks (Fig. 4d). Their calculated δ18OV-PDB values vary between −14.2 ‰ and −16.8 ‰.
4.a.3. Sm–Nd isotopes
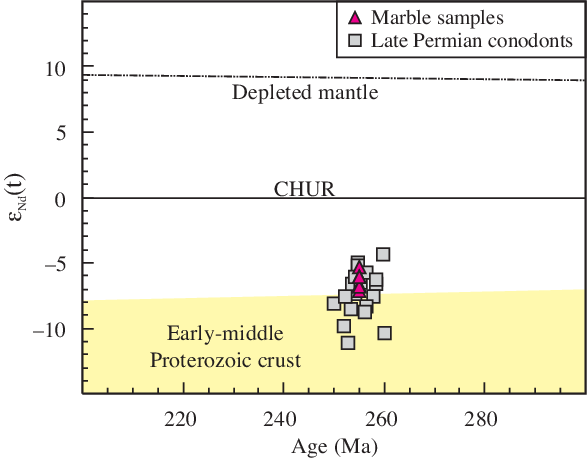
The marble samples yield 147Sm/144Nd ratios varying between 0.1197 and 0.0955, and 143Nd/144Nd ratios ranging from 0.512220 to 0.512102 (Table 1). They are characterized by negative ε Nd(t = 255 Ma) values of −5.3 to −7.2, which are consistent with those of Late Permian conodonts (Keto & Jacobsen, Reference Keto and Jacobsen1988; Martin & Macdougall, Reference Martin and Macdougall1995) and are close to the Early–Middle Proterozoic crust evolutionary curve (Fig. 5).
εNd(t) vs age plots of the Permian marble, the data of Late Permian conodonts after Keto & Jacobsen (Reference Keto and Jacobsen1988) and Martin & Macdougall (Reference Martin and Macdougall1995).

4.b. Metabasalt
4.b.1. Bulk rock chemistry
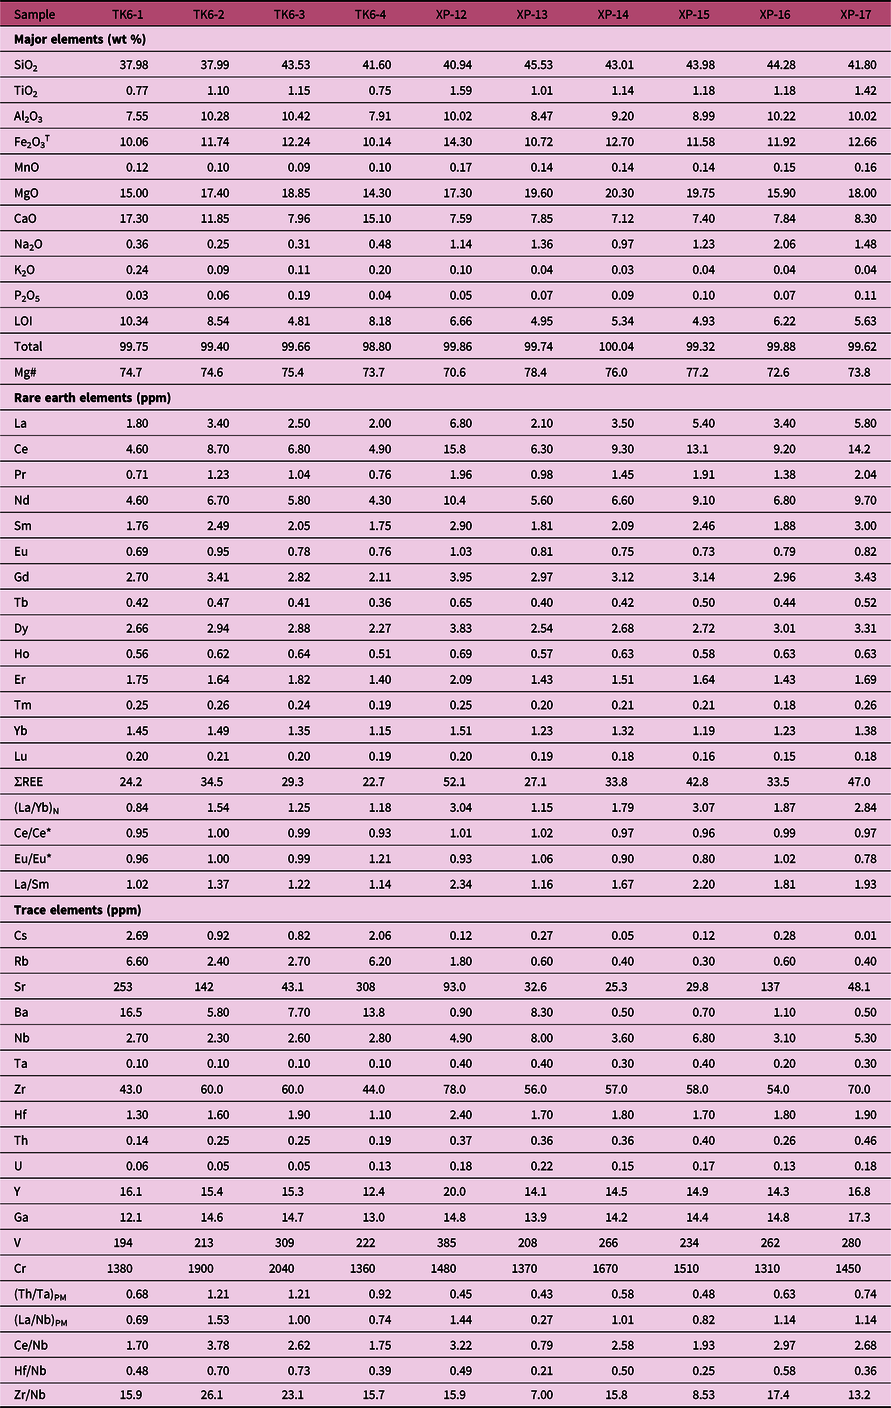
Major and trace element contents of the Permian metabasalt are presented in Table 2. The samples are characterized by low SiO2 (45.53–37.98 wt %) with high Fe2O3 T (14.30–10.06 wt %) and MgO (20.30–14.30 wt %) contents. They have medium TiO2 (average 1.13 wt %), Al2O3 (average 9.31 wt %) and CaO (average 9.83 wt %) concentrations. Other major oxides commonly occur in low contents (<1 wt %). These major element contents are normalized to 100 % on LOI (loss on ignition)-free basis before plotting them to diagrams.
Bulk rock chemical contents of the Permian metabasalt

Notes: (1) Fe2O3 T is total Fe, and LOI is loss on ignition. (2) Mg# = 100Mg/(Mg + ΣFe2+) in mole. (3) δCe = 2CeN/(LaN + PrN), δEu = 2EuN/(SmN + GdN), and the value of chondrite after Taylor & McLennan (Reference Taylor and McLennan1985). (4) PM is primitive mantle, and its value after Sun & McDonough (Reference Sun and McDonough1989).
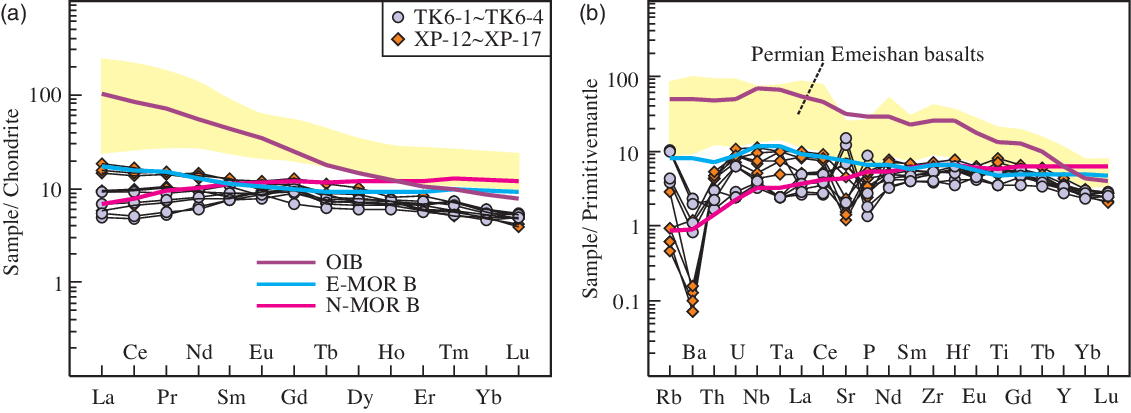
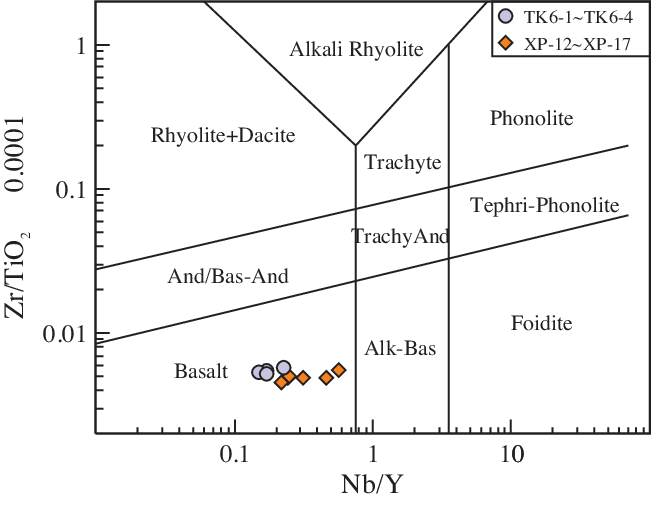
The samples exhibit high La (average 3.67 ppm), Ce (average 9.29 ppm) and Nd (average 6.96 ppm) abundances. They have variable REE contents (ΣREE = 52.1–22.7 ppm) and MORB (mid-ocean ridge basalt)-like flat REE profiles ((La/Yb)N = 3.07–0.84) with insignificant Ce (Ce/Ce* = 1.02–0.93) and Eu (Eu/Eu* = 1.21–0.78) anomalies on the chondrite-normalized REE diagrams (Fig. 6a). They show high concentrations of Sr (308–25.3 ppm, average 111 ppm), Ba (16.5–0.50 ppm, average 5.58 ppm), Zr (average 58.0 ppm), Y (average 15.4 ppm), Ga (average 14.4 ppm), V (385–194 ppm, average 257 ppm) and Cr (2040–1310 ppm, average 1547 ppm). On the Zr/TiO2–Nb/Y diagram, they are plotted in the field of basalt (Fig. 7); this is consistent with their low SiO2 contents. The metabasalt samples still have flat patterns on the primitive mantle-normalized trace element diagrams, similar to E- (enriched) and N- (normal) MORB (Fig. 6b). No negative anomalies in high field strength elements (HFSEs, e.g. Nb, Ta and Ti) or positive anomalies in large ion lithophile elements (LILEs, e.g. Rb, Th and U) are significantly observed.
REE pattern (a) and trace element (b) diagrams of the metabasalt, the values of chondrite, primitive mantle and Emeishan basalts after Taylor & McLennan (Reference Taylor and McLennan1985), Sun & McDonough (Reference Sun and McDonough1989) and Xiao et al. (Reference Xiao, Xu, Mei, Zheng, He and Pirajno2004), respectively, and the data of OIB (ocean island basalt), E-MORB and N-MORB after Sun & McDonough (Reference Sun and McDonough1989).

Zr/TiO2 vs Nb/Y diagram of the metabasalt, modified after Irvine & Baragar (Reference Irvine and Baragar1971).

4.b.2. Zircon U–Pb geochronology
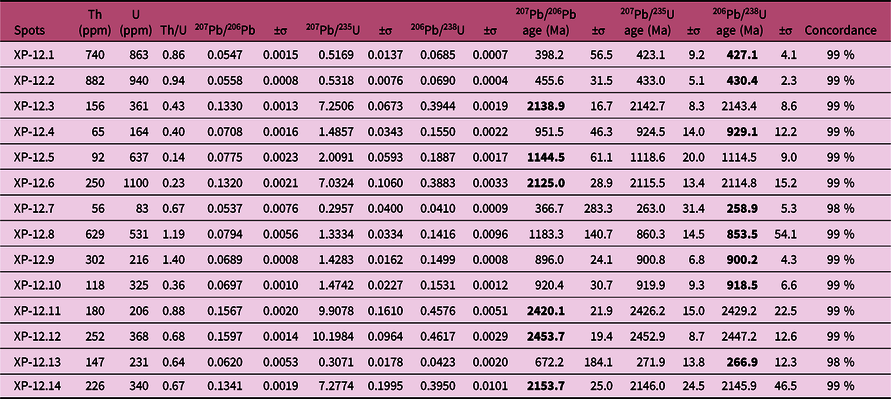
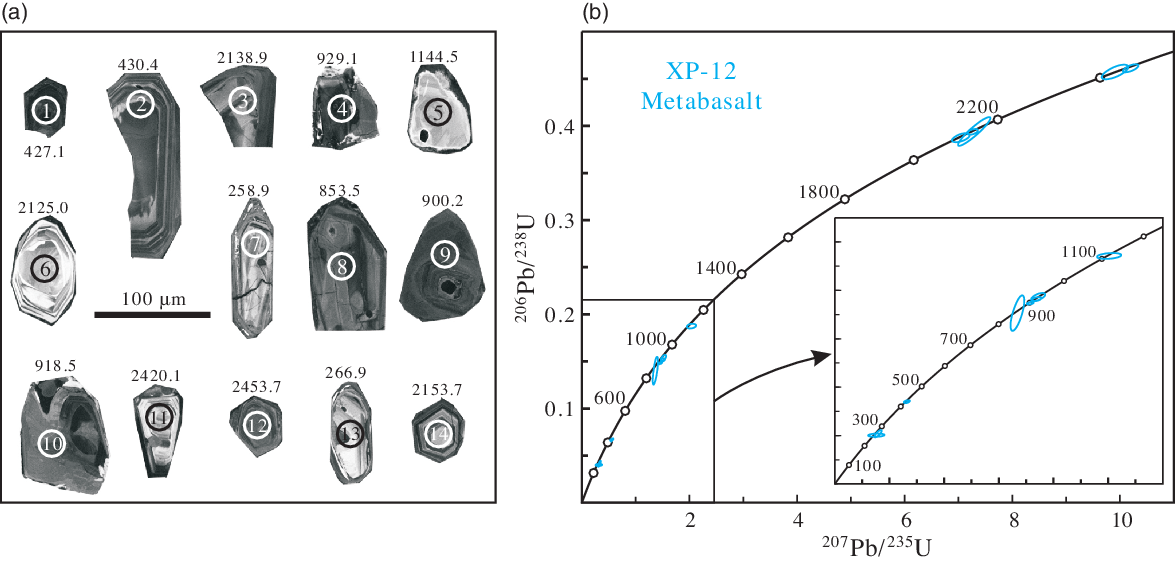
Zircon U–Pb dating data of the metabasalt sample XP-12 are listed in Table 3. The zircons are mostly subhedral, subrounded and fragmentary with various sizes (Fig. 8a). They are up to 150 μm in length and have length/width ratios up to 2, with varying Th/U ratios of 1.40–0.14. Their CL images commonly show apparent oscillatory zoning although some are dull and blurry. These features are indicative of magmatic (e.g. spots 2 and 7 with high Th/U ratios) and metamorphic (e.g. spots 5 and 6 with low Th/U ratios) origin (Hoskin & Schaltegger, Reference Hoskin and Schaltegger2003), and are similar to zircons from mafic volcanics and gabbroic rocks (Song et al. Reference Song, Su, Li, Zhang, Niu and Zhang2010). Six zircons yield 207Pb/206Pb ages of 2453.7–1144.5 Ma, while the other eight grains have 206Pb/238U ages of 929.1–258.9 Ma. All zircons are scattered along the concordia curve (Fig. 8b), indicating that they represent a detrital population.
Zircon U–Pb isotopic data of the Permian metabasalt sample XP-12

CL images with U–Pb ages (a) and concordia plots of zircon U–Pb data (b) for the metabasalt sample.

5. Discussion
5.a. Depositional palaeoenvironment
5.a.1. Protolith of the Permian marble
At amphibolite and higher grades of metamorphism, both limestone and carbonatite become marbles that are difficult to distinguish in the field (Bas et al. Reference Bas, Subbarao and Walsh2002). However, the Permian marble in the southern SGO shows layered and banded sedimentary structures (Fig. 3a, b, c). Its δ13CV-PDB and δ18OV-SMOW values are clearly different from those of carbonatite and igneous rocks (Fig. 4c, d), suggesting a non-magmatic origin. Moreover, the La/Yb vs ΣREE diagram further indicates its geochemical similarity to sedimentary rocks (Fig. 4a). We thus advocate that the marble protolith was not igneous carbonatite, but sedimentary carbonate rocks.
Some previous workers proposed a Z value [Z = 2.048 * (δ13CV-PDB + 50) + 0.498 * (δ18OV-PDB + 50)] to identify marine (Z > 120) and freshwater (Z < 120) carbonates (Keith & Weber, Reference Keith and Weber1964). In this paper, the calculated Z values of the Permian marble samples range between 128.4 and 119.7, with an average of 126.2 (Table 1), indicating a marine signature for their protolith. In addition, the marble samples show superchondritic Y/Ho ratios of 38.9–54.1, negative Ce (Ce/Ce* = 0.60–0.32) and positive La (La/La* = 1.90–1.45), Gd (Gd/Gd* = 2.52–1.35) and Y (Y/Y* = 1.98–1.38) anomalies (Table 1) in their PAAS-normalized REY profiles (Fig. 4b), with similar Nd isotope composition to Late Permian conodonts (Fig. 5). These features are typical of modern seawater summarized in previous studies (Bau & Dulski, Reference Bau and Dulski1996; Webb & Kamber, Reference Webb and Kamber2000; Bolhar et al. Reference Bolhar, Kamber, Moorbath, Fedo and Whitehouse2004; Alexander et al. Reference Alexander, Bau, Andersson and Dulski2008), and confirm that the Permian marble protolith was marine carbonate with compatible carbon isotopic compositions (Fig. 4c).
5.a.2. Effects of detritus, diagenesis and metamorphism
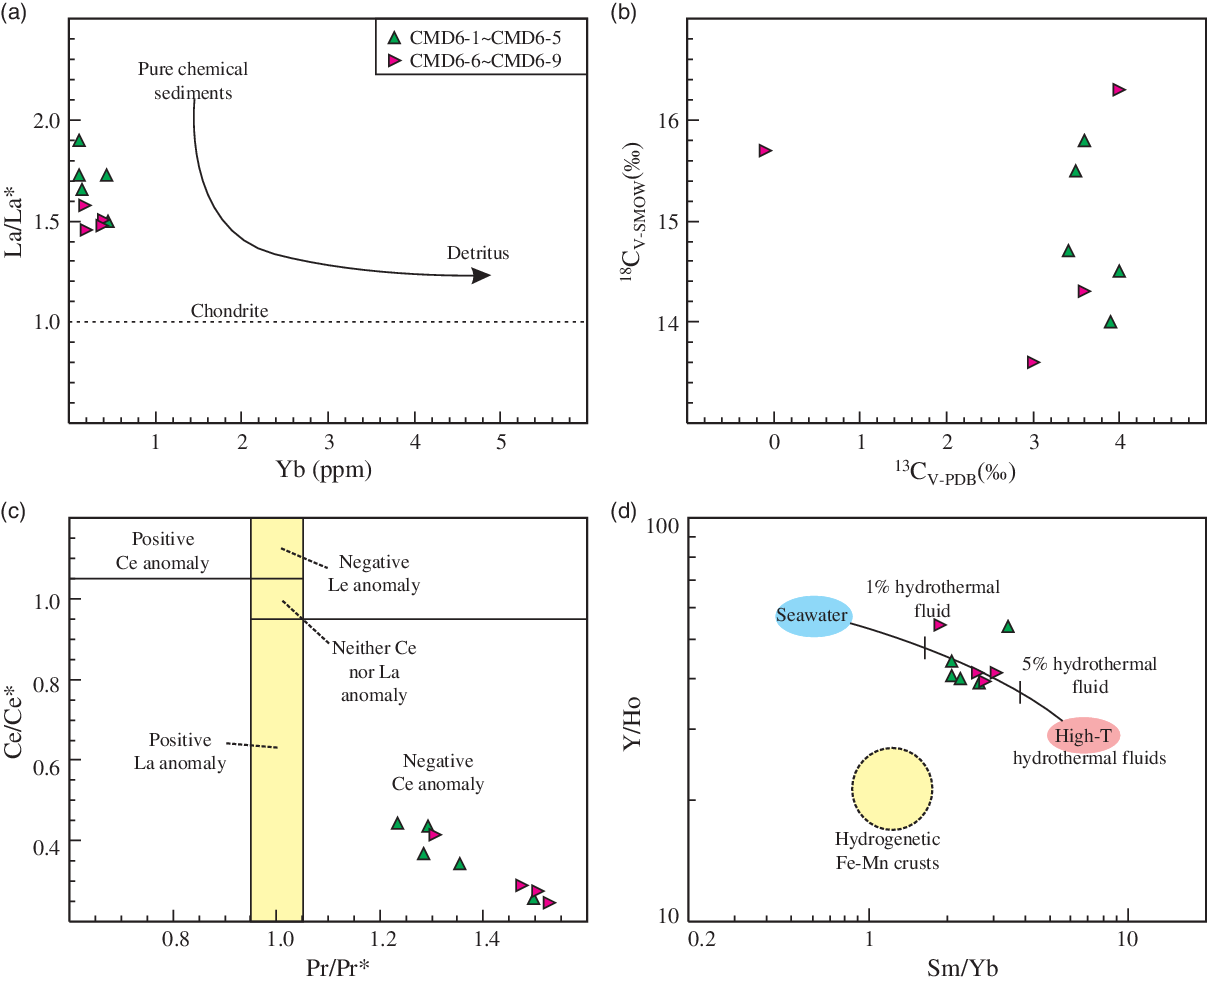
Marine sedimentary rocks recorded the oceanic environmental conditions during their formation. However, detritus contribution and diagenetic effect must be evaluated in order to interpret their REY and isotopic data properly. Minor amounts of crustal materials, when incorporated into the chemical leaching process, are sufficient to obscure original REY signatures (Bolhar et al. Reference Bolhar, Kamber, Moorbath, Fedo and Whitehouse2004). Only if complications by detritus contaminants are ruled out can REY compositions of sedimentary carbonate provide meaningful information regarding ancient water chemistry and depositional environment (Haley et al. Reference Haley, Klinkhammer and McManus2004). As terrestrial detritus and chondrite display a constant Y/Ho ratio of ~26, small admixtures of any contaminants would depress seawater-like Y/Ho ratios of >44 (Bolhar et al. Reference Bolhar, Kamber, Moorbath, Fedo and Whitehouse2004). In this study, the Permian marble samples have superchondritic Y/Ho ratios ranging from 38.9 to 54.1 (average 43.7; Table 1), indicating an insignificant amount of terrestrial clastic materials during the deposition. Previous researchers have argued that pure marine chemical sediments display pronounced seawater-like features, such as positive La anomaly. For example, Webb & Kamber (Reference Webb and Kamber2000) found that the shallow carbonate environment at Heron Reef was characterized by La/La* greater than 1.2. With increasing detritus contamination, these features wane and some trace element concentrations (e.g. Yb and Zr) are finally elevated (Viehmann et al. Reference Viehmann, Bau, Smith, Beukes, Dantas and Bühn2015). According to our geochemical data, the Permian marble shows high La/La* values and extremely low Yb contents (Table 1), suggesting little involvement of terrestrial detritus (Fig. 9a).
(a) La/La* vs Yb diagram for the Permian marble (after Viehmann et al. Reference Viehmann, Bau, Smith, Beukes, Dantas and Bühn2015). (b) δ18OV-SMOW vs δ13CV-PDB diagram. (c) Ce/Ce* vs Pr/Pr* discrimination diagram for Ce anomaly (after Bau & Dulski, Reference Bau and Dulski1996), here Ce/Ce* = 2CePAAS/(LaPAAS + PrPAAS), Pr/Pr* = 2PrPAAS/(CePAAS + NdPAAS), and the values of PAAS after McLennan (Reference McLennan1989). (d) Y/Ho vs Sm/Yb disgram (after Alexander et al. Reference Alexander, Bau, Andersson and Dulski2008).

REY are often considered to be immobile elements and they could not be mobilized during diagenesis and metamorphism (Bau & Möller, Reference Bau and Möller1993). Despite the vulnerability of carbonates during diagenetic and metamorphic processes, they could often retain original isotope compositions even under medium- to high-grade conditions (Melezhik et al. Reference Melezhik, Gorokhov, Fallick and Gjelle2001; Murra et al. Reference Murra, Casquet, Locati, Galindo, Baldo, Pankhurst and Rapela2016). In this paper, the Permian marble samples do not show extremely low δ18O values (Table 1), implying that their oxygen isotopes have not been markedly affected (Kent-Corson et al. Reference Kent-Corson, Ritts, Zhuang, Bovet, Graham and Page Chamberlain2009). Previous workers uncovered that diagenesis and metamorphism could homogenize the original carbon and oxygen isotopic compositions of carbonate (Quade et al. Reference Quade, Garzione and Eiler2007), causing a strong positive covariation between δ18O and δ13C values (Singh et al. Reference Singh, Parkash, Awasthi and Singh2012). However, these isotopic data show no correlation (Fig. 9b), and thus suggest that diagenesis and metamorphism had negligible effects on their original geochemical and isotopic compositions.
5.a.3. Palaeoseawater redox and hydrothermal input
Cerium (Ce) can exist in either trivalent or tetravalent forms depending on its redox conditions. Negative Ce anomaly is associated with the oxidation of Ce(III) to Ce(IV) and thus can trace redox conditions of palaeoseawater (Elderfield & Greaves, Reference Elderfield and Greaves1982), when signals are not altered by post-depositional diagenetic REY exchange (Shields & Stille, Reference Shields and Stille2001). Because positive La anomaly can produce false negative Ce anomaly, Bau & Dulski (Reference Bau and Dulski1996) introduced a simple diagram to identify true Ce anomaly, and it indicates that all the marble samples have significant Ce anomalies (Fig. 9c). In this paper, Ce anomalies are calculated as Ce/Ce* = CePAAS/(2PrPAAS − NdPAAS) according to Bolhar et al. (Reference Bolhar, Kamber, Moorbath, Fedo and Whitehouse2004), and yield Ce/Ce* values of 0.60 to 0.32 (Table 1). These features imply that oxygen in the Permian seawater was present in high concentrations.
Previous studies indicated strongly positive Eu anomaly for submarine high-temperature (>350 °C) hydrothermal solutions (Bau & Dulski, Reference Bau and Dulski1999; Douville et al. Reference Douville, Bienvenu, Charlou, Donval, Fouquet, Appriou and Gamo1999), which resulted in pronounced positive Eu anomalies of marine chemical sediments, such as Precambrian banded iron formations (Bekker et al. Reference Bekker, Slack, Planavsky, Krapez, Hofmann, Konhauser and Rouxel2010). According to the recommended Eu/Eu* [Eu/Eu* = EuPAAS/(0.67SmPAAS + 0.33TbPAAS)] calculation method (Bau & Dulski, Reference Bau and Dulski1996), the Permian marble samples show Eu/Eu* values from 1.67 to 1.02 with an average of 1.34 (Table 1). This is indicative of submarine high-T hydrothermal fluids. It is noteworthy that the samples display weakly positive Eu anomalies in their PAAS-normalized REY patterns, and we attribute this to their adjacent positive Gd anomalies (Fig. 4b). Furthermore, Alexander et al. (Reference Alexander, Bau, Andersson and Dulski2008) introduced a two-component mixing model to detect the proportion of seawater and high-T hydrothermal fluids in the original mixture. According to the Y/Ho vs Sm/Yb diagram, extremely small quantities of high-T hydrothermal solutions (5 % to 1 %) were sufficient to yield positive Eu anomalies for the protolith (marine carbonate) of the Permian marble samples (Fig. 9d).
5.b. Petrogenesis of the metabasalt protolith
5.b.1. Effects of metamorphism on whole-rock compositions
The Permian metabasalt samples have a large range of LOI values between 10.34 wt % and 4.81 wt % (Table 2), indicating that they underwent varying degrees of metamorphic fluid flow. This is consistent with the presence of hydrous minerals, such as chloritization (Fig. 3h). This feature implies that some mobile element contents might be significantly modified during metamorphism. Therefore, the effect of metamorphism and mobility of major and trace elements must be evaluated before we discuss the petrogenesis of the Permian metabasalt.
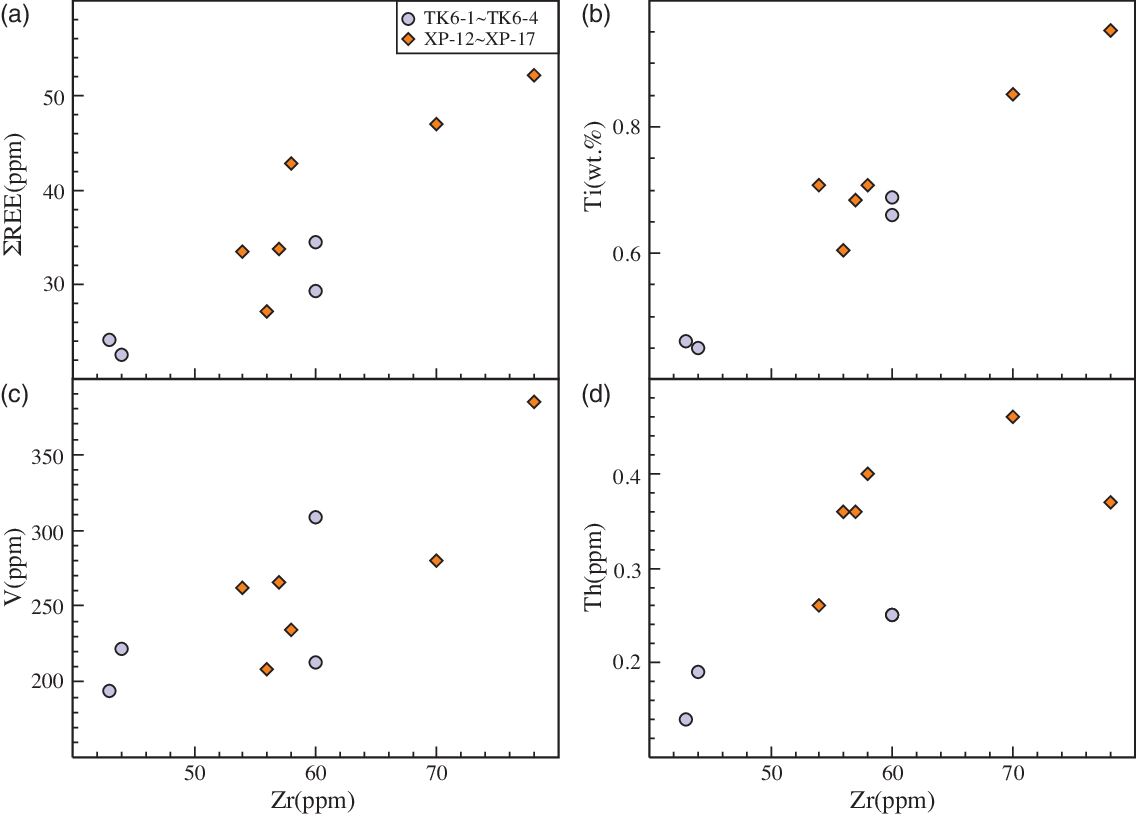
Zirconium (Zr) is considered to be the most immobile element during low-grade metamorphism of mafic igneous rocks, and can be used to evaluate the metamorphic effects on their chemical composition (Polat et al. Reference Polat, Hofmann and Rosing2002). In this study, the metabasalt samples commonly display a positive correlation between Zr and some REEs (e.g. Sm and Yb), HFSEs (e.g. Ti and Hf), V and Th (Fig. 10), suggesting that they were immobile during metamorphism. Hence, these immobile elements are only briefly considered in the following discussion.
Selected elements vs Zr for the metabasalt.

5.b.2. Fractional crystallization and crustal contamination
The effects of magma differentiation and crustal contamination must be determined before assessing the potential magma sources for the Permian metabasalt. The samples have a narrow range of MgO contents (20.30–14.30 wt %) and Mg# values (78.4–70.6; Table 2), and their major oxides and trace elements show no correlations with MgO. These geochemical signatures could be attributed to the stable magma composition with insignificant fractional crystallization.
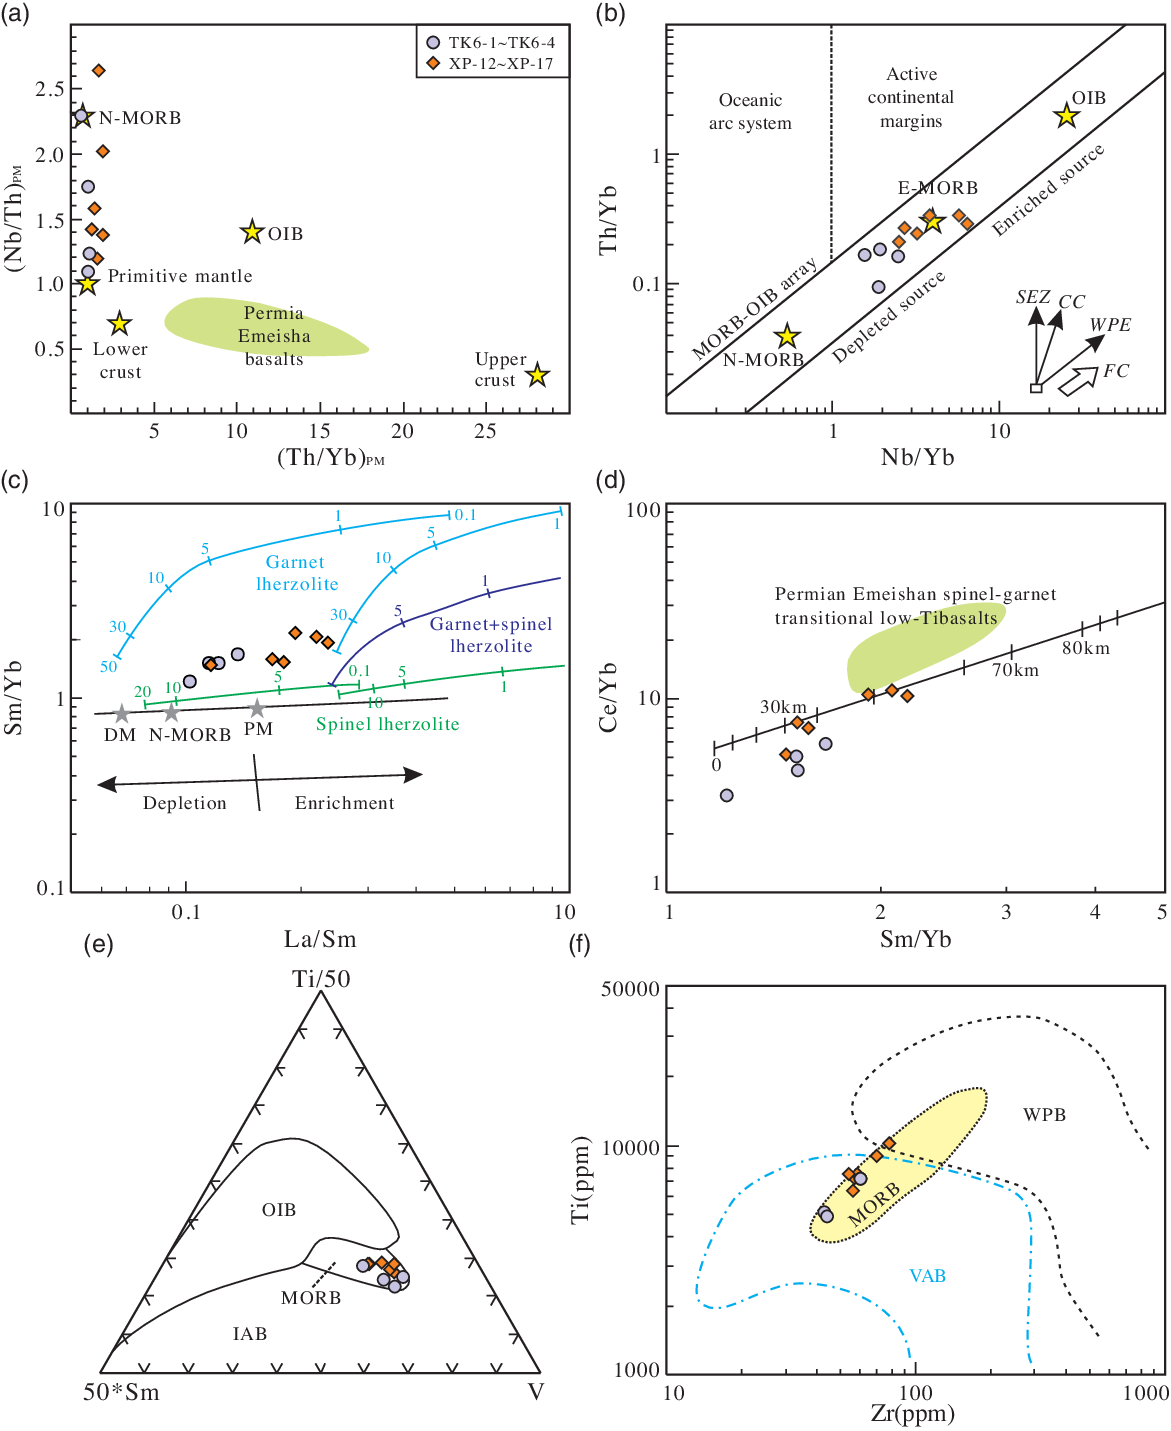
Crustal contamination of basalts is expected when these materials representing considerable volumes of melts intruded across a continental crust of certain thickness (Reichow et al. Reference Reichow, Saunders, White, Al´Mukhamedov and Medveded2005). The (Nb/Th)PM vs (Th/Yb)PM diagram is commonly used to evaluate the involvement of crustal contamination (Pearce, Reference Pearce2008). Almost all the metabasalt samples fall in the field between the primitive mantle and N-MORB, and are far away from the upper crust (Fig. 11a). This feature indicates negligible crustal contamination during the magma evolution. Moreover, our samples show low La/Sm ratios of 2.34 to 1.02, (Th/Ta)PM ratios of 1.21 to 0.43 and (La/Nb)PM ratios of 1.53 to 0.27 (Table 2). This also argues strongly against significant crustal contamination, which displays high La/Sm (>4.5), (Th/Ta)PM (>2) and (La/Nb)PM (>2) values (Peng et al. Reference Peng, Mahoney, Hooper, Harris and Beane1994). Additionally, the Permian metabasalt samples do not possess negative anomalies in Nb and Ta on the primitive mantle-normalized trace element diagrams (Fig. 6b), which otherwise are generally interpreted as an indicator of crustal contamination. However, 14 detrital zircons are separated from ~10 kg metabasalt sample XP-12, and this is undeniably a symbol of crustal contamination (Tchameni et al. Reference Tchameni, Mezger, Nsifa and Pouclet2001). Therefore, the magma should be hybridized a little by ancient crust during the protolith formation.
(a) Plots of (Nb/Th)PM vs (Th/Yb)PM for the metabasalt. (b) Th/Yb vs Nb/Yb diagram (after Pearce, Reference Pearce2008). SZE: subduction zone enrichment; CC: continental contamination; WPE: within-plate enrichment; FC: fractional crystallization. (c) Sm/Yb vs La/Sm diagram (after Zhao & Zhou, Reference Zhao and Zhou2007). DM: depleted mantle; PM: primitive mantle. Numbers along lines represent the degree of partial melting. (d) Ce/Yb vs Sm/Yb diagram (after Cen et al. Reference Cen, Li, Wang, Pang, Li, Xing, Zhao and Tao2016). Data sources: primitive mantle, N-MORB and OIB from Sun & McDonough (Reference Sun and McDonough1989); upper and lower crust from Taylor & McLennan (Reference Taylor and McLennan1985); Permian Emeishan basalts from Xu et al. (Reference Xu, Chung, Jahn and Wu2001) and Xiao et al. (Reference Xiao, Xu, Mei, Zheng, He and Pirajno2004). (e, f) Tectonic discrimination diagrams for the metabasalt, after Vermeesch (Reference Vermeesch2006) and Pearce & Peate (Reference Pearce and Peate1995), respectively.

5.b.3. Mantle source and melting conditions
Trace element variations of the Permian metabasalt samples indicate little fractional crystallization and crustal contamination, and hence their chemical compositions can reflect the magma source signatures. The samples are characterized by low SiO2 (45.53–37.98 wt %) with high Fe2O3 T (14.30–10.06 wt %) and MgO (20.30–14.30 wt %) contents (Table 2). Their chondrite-normalized REE patterns and primitive mantle-normalized trace element profiles resemble N-MORB and E-MORB, and are markedly different from ocean island basalt (OIB) (Fig. 6). Many important trace element ratios, including Ce/Nb (3.78–0.79), Hf/Nb (0.73–0.21) and Zr/Nb (26.1–7.00), are also comparable to those of MORB (Ce/Nb = 3.78–0.79, Hf/Nb = 0.73–0.21, Zr/Nb = 26.1–7.00) and inconsistent with those of OIB (Ce/Nb = 0.73, Hf/Nb = 0.16, Zr/Nb = 5.85; Sun & McDonough, Reference Sun and McDonough1989). Significantly, they plot within a mantle array on the Th/Yb vs Nb/Yb diagram (Fig. 11b), suggesting a mantle source with negligible input of subduction components. Moreover, the metabasalt samples show enrichment in HFSEs (e.g. Nb, Ta and Ti), with mostly negative anomalies in Ba, Sr and Eu (Fig. 6b). These geochemical features are commonly indicative of magma generation by partial melting of a depleted mantle reservoir (Han et al. Reference Han, Wang, Jahn, Hong, Kagami and Sun1997; Yang et al. Reference Yang, Li, Santosh, Yang, Zhang and Tong2013a).
Primary basaltic melts should have high Cr abundances (>1000 ppm) and Mg# values (81–73, Frey et al. Reference Frey, Green and Roy1978). Comparatively, the Permian metabasalt samples show Cr contents of 2040–1310 ppm and Mg# values of 78.4–70.6 (Table 2), indicating a primary nature. Additionally, they are characterized by flat HREE patterns together with elevated HREE concentrations higher than chondritic values, which most likely suggest a mantle source containing spinel rather than garnet (Ayalew et al. Reference Ayalew, Jung, Romer, Kersten, Pfänder and Garbe-Schönberg2016). A useful approach to investigate the nature of mantle source is through melt modelling. To minimize the influence, we use HFSE and REE ratios (e.g. La/Yb and Sm/Yb) to determine their magma source. La/Yb values are sensitive to the source mineralogy, because Yb is compatible with garnet but not with spinel (McKenzie & O’Nions, Reference McKenzie and O’Nions1991). The Sm/Yb and La/Sm values are mostly plotted along the partial melting curve of spinel lherzolite (Fig. 11c), and show low degrees of melting (<10 %). Moreover, the Ce/Yb vs Sm/Yb diagram indicates that the primary melts were mainly produced at c. 30–60 km (Fig. 11d). In conclusion, the mantle source of the metabasalt protolith was likely to be a depleted MORB-type mantle reservoir and was mainly composed of spinel lherzolite at a depth of 30–60 km.
5.b.4. Tectonic setting
According to our field observations, the investigated metabasalt clearly shows pillow and vesicular structures, and is interbedded within the Permian marble (Fig. 3). These geological features reliably indicate a submarine formation environment. It is noteworthy that the studied metabasalt was roughly coeval with Late Permian (~260 Ma) Emeishan flood basalts, which are part of an important large igneous province (LIP) along the western margin of the Yangtze Block (Xu et al. Reference Xu, Chung, Jahn and Wu2001). However, our samples display distinct difference with the Emeishan basalts in their geochemical composition (Figs 6, 11). We thus conclude that the Permian metabasalt in the south rim of the SGO was not the product of the Emeishan LIP.
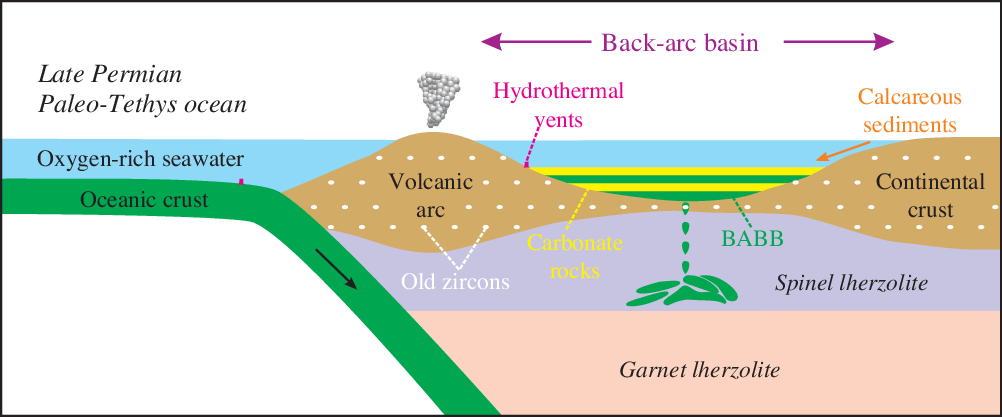
As mentioned above, the metabasalt samples have geochemical similarities to MORB in their element ratios (Table 2), REE patterns and trace element profiles (Fig. 6). In this paper, the geochemical data were also plotted on a series of discriminant diagrams using immobile trace elements (e.g. Ti, Sm and Zr) to interpret the tectonic setting. On the Ti–Sm–V and Ti–Zr diagrams, most of the samples plot within the MORB field (Fig. 11e, f). However, if their protolith was derived from a mid-ocean ridge setting, the coexisting sedimentary rocks should commonly be siliceous rocks instead of carbonates (e.g. Safonova et al. Reference Safonova, Simonov, Kurganskaya, Obut, Romer and Seltmann2012, Reference Safonova, Biske, Romer, Seltmann, Simonov and Maruyama2015; Luo et al. Reference Luo, Xu, Shi, Zhao, Faure and Chen2016). Previous workers have indicated that primary back-arc basins mainly produce arc-like lavas (Hawkins et al. Reference Hawkins, Lonsdale, Macdougall and Volpe1990; Gao et al. Reference Gao, Zhang, Yang, Pan, Luo, Guo, Xu, Tao, Zhang and Wu2018), while mature ones chiefly generate MORB-like lavas (Taylor & Martinez, Reference Taylor and Martinez2003). Significantly, our samples do not show geochemical affinities with arc volcanics (Fig. 11b, e, f), such as depletion in HFSEs (e.g. Nb, Ta and Ti) and enrichment in LILEs (e.g. Rb, Th and U; Fig. 6). Therefore, we propose a mature back-arc basin setting for the protolith (back-arc basin basalt) of the Permian metabasalt (Fig. 12). This is in favour of the viewpoint of Roger et al. (Reference Roger, Jolivet and Malavieille2008), who proposed that the Permian palaeo-ocean in this region was a marginal basin developed in a back-arc setting. Back-arc extension and thinning of continental crust have been uncovered by previous studies (Taylor & Martinez, Reference Taylor and Martinez2003). We thus deduce that only a small amount of detrital zircons could be involved during magma ascent owing to the thin crust. This is consistent with the fact that zircon grains were barely separated from ~10 kg metabasalt sample XP-12 in the present study (Fig. 8). Further, back-arc basins have extensive submarine hydrothermal activity released from sea-floor hydrothermal vents (Bekker et al. Reference Bekker, Slack, Planavsky, Krapez, Hofmann, Konhauser and Rouxel2010), which is responsible for the positive Eu anomalies (Eu/Eu* = 1.67–1.02) in the Permian marble.
Schematic diagram showing the petrogenetic model for protolith of the Permian metavolcano–sedimentary sequence. BABB: back-arc basin basalt.

5.c. Zircon age spectrum
Experience has substantiated that zircon will not precipitate until Zr concentration reaches 10 000 ppm or more in basaltic liquids (White, Reference White2013). However, zircons separated from metabasalt sample XP-12 have Zr abundances of 78.0–43.0 ppm. Combined with zircon morphology and their scattered age spectrum (Fig. 8), we further suggest a detrital origin for them. Importantly, a crucial aspect for understanding the role of the studied Permian metavolcano–sedimentary sequence during the SGO tectonic evolution is to constrain its deposition age and to detect the geological significance of zircon age spectrum.
In the western Yangtze Block, the Kangding Complexes consist of granitic gneisses and were metamorphosed to upper greenschist to amphibolite facies. They were traditionally considered to be Archaean or Palaeoproterozoic basement according to whole rock Pb–Pb and Rb–Sr dating (e.g. He et al. Reference He, Chen, Yang, Min and Liu1988; Zhang et al. Reference Zhang, Luo and Yang1990). However, extensive zircon U–Pb data have shown a Neoproterozoic age for them in recent years (860–750 Ma, e.g. Zhou et al. Reference Zhou, Yan, Kennedy, Li and Ding2002; Geng et al. Reference Geng, Yang, Wang, Du, Ren and Zhou2008). Some scholars even suggested no Archaean to Palaeoproterozoic crystalline basements in this region (e.g. Geng et al. Reference Geng, Yang, Wang, Ren, Du and Zhou2007). In this paper, five 2453.7–2125.0 Ma zircons were obtained from the Permian metabasalt (Table 3), probably indicating that there are Archaean or Palaeoproterozoic crystalline basements in the studied domes and their vicinity. This is further confirmed by the 2385–2211 Ma amphibolite newly discovered in the Jianglang dome (Zhang et al. Reference Zhang, Dai, Wang, Yang, Tang and Liang2016).
Previous studies proposed that the Rodinia supercontinent assembled through worldwide orogenic events at c. 1300–900 Ma, and its break-up occurred at c. 860–570 Ma (Li et al. Reference Li, Bogdanova, Collins, Davidson, Waele, Ernst, Fitzsimons, Fuck, Gladkochub, Jacobs, Karlstromk, Lu, Natapovm, Pease, Pisarevsky, Thrane and Vernikovsky2008). The SGO was considered to have been built on oceanic crust above a west-dipping subduction zone, and later collided with the western Yangtze Block (Zhou et al. Reference Zhou, Yan, Kennedy, Li and Ding2002). In this paper, five zircons yield U–Pb ages of 1144.5–853.5 Ma (Fig. 8), implying the SGO tectonic evolution can be correlated with the Rodinia supercontinent globally (Zhou et al. Reference Zhou, Yan, Kennedy, Li and Ding2002; Roger et al. Reference Roger, Jolivet and Malavieille2010). Two 430.4–427.1 Ma zircons were probably related to the Caledonian (Early to Middle Palaeozoic) tectonomagmatic events. In addition, two 266.9–258.9 Ma zircons were most likely derived from the c. 260 Ma Emeishan LIP (Xiao et al. Reference Xiao, Xu, Mei, Zheng, He and Pirajno2004). Its eruption was coincident with rifting of the western Yangtze Block, and formed the Songpan–Ganzi basin that was a branch of the Palaeo-Tethys (Roger et al. Reference Roger, Jolivet and Malavieille2010).
Field observations show that the Permian strata are composed of marble with sandwiched metabasalt (Fig. 3a, b). This is indicative of roughly coeval sedimentation and volcanism. As mentioned above, we propose that zircons within the mebasalt sample were all of detrital origin. Hence, the youngest age of 258.9 Ma (Fig. 8) is regarded as the maximum depositional age for the protolith. Previous U–Pb dating revealed several Early Triassic magmatic rocks in the SGO and its vicinity. This is exemplified by the 248 Ma Hejiazhuang granodiorite (Yang et al. Reference Yang, Liu, Li, Wang, Zhang and Wang2013b), the 247.7 Ma Kaiyuan basalt (Zhang et al. Reference Zhang, Huang, Luo and Yan2014), the 245 Ma Baimaxueshan K-feldspar granite (Reid et al. Reference Reid, Wilson, Shun, Pearson and Belousova2007) and the 240 Ma Suwalong biotite granite (Reid et al. Reference Reid, Wilson, Shun, Pearson and Belousova2007). However, the mebasalt contains no coeval zircons and it should be earlier than Early Triassic. Therefore, we suggest a Late Permian age for the investigated metavolcano–sedimentary assemblage, with gravel-bearing marble resembling Late Permian brecciated limestone in its vicinity (Yan et al. Reference Yan, Song, Fu and Tian1997).
6. Conclusions
In the southern SGO, the Permian metavolcano–sedimentary sequence is composed chiefly of marble with sandwiched metabasalt. Our geochemical and isotopic data presented in this study yield the following conclusions:
-
(1) C–O–Nd isotope systematics and REY tracing indicate that the marble protolith was marine carbonate, which was deposited in oxygenated seawater with an input of 5 % to 1 % submarine high-T hydrothermal fluids.
-
(2) The metabasalt protolith resembles back-arc basin basalt. It experienced negligible fractional crystallization and crustal contamination, and melted in the 30–60 km spinel stability field. This rock contains detrital zircons significantly related to the Palaeoproterozoic crystalline basement, Rodinia supercontinent, Caledonian events and c. 260 Ma Emeishan LIP.
-
(3) Combined with previous studies, the investigated metavolcano–sedimentary sequence was assigned a Late Permian age.
Acknowledgements
This work was financially supported by National Natural Science Foundation of China (grant No. 41902068) and Young Scholars Development Fund of Southwest Petroleum University (grant No. 201499010083). We are grateful to two anonymous reviewers and Dr Kathryn Goodenough for their constructive comments and many important corrections in English.
Supplementary material
To view supplementary material for this article, please visit https://doi.org/10.1017/S0016756820000230